The given graph represents the percentage distribution of the total expenditure of a company. Study the graph and answer the question that follows .
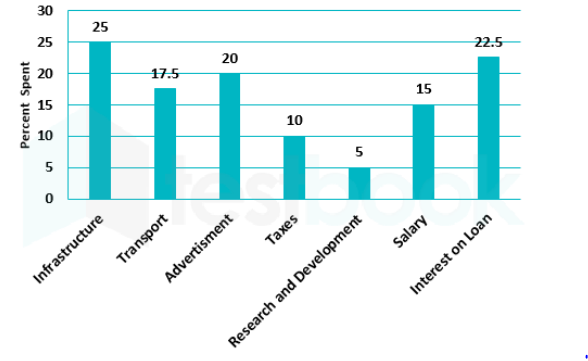
What is the ratio of the total expenditure on 'Infrastructure' and 'Transport' to the total expenditure on 'Taxes' and 'Interset on Loans' ?
15:13
17:13
14:13
16:13
The correct Answer is:B
Step by step video & image solution for The given graph represents the percentage distribution of the total expenditure of a company. Study the graph and answer the question that follows . What is the ratio of the total expenditure on 'Infrastructure' and 'Transport' to the total expenditure on 'Taxes' and 'Interset on Loans' ? by Maths experts to help you in doubts & scoring excellent marks in Class 14 exams.
Updated on:21/07/2023Similar Questions
The given graph represents the percentage distribution of the total expenditure of a company. Study the graph and answer the question that follows,
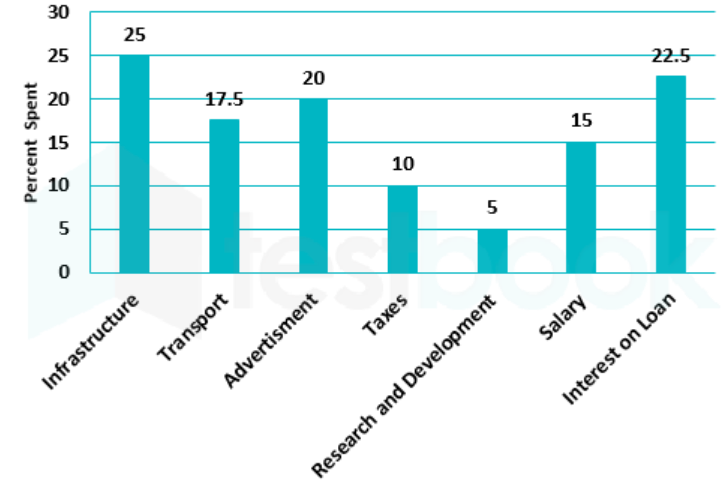
The expenditure on 'Interest on loans' is what percentage more than the expenditure on 'Transpott' ?
View SolutionThe give graph represents the percentage distibution of the total expenditure of a company. Study the graph and answer the question that follows .
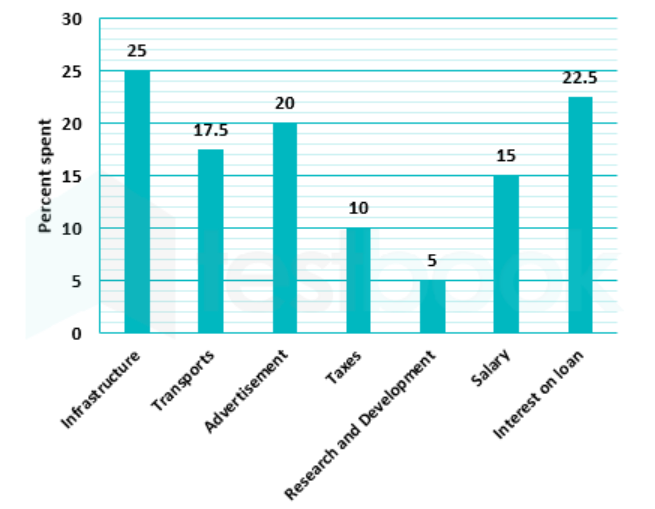
The total expenditure of the company is how many times the total expenditure on 'Research and Development' and 'Salary'?
View Solution
Knowledge Check
The bar graph shows the percentage distribution of the total expenditure of a company under varios expense heads during 2005. Study the bar graph and answer the following four questions.
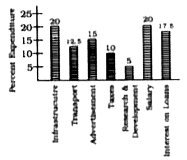
The ratio of the total expenditure on infrastructure and transport to the total expenditure on taxes and interest on loans isA5:4B13:11C9:7D8:7Study the given graph and answer the question that follows.
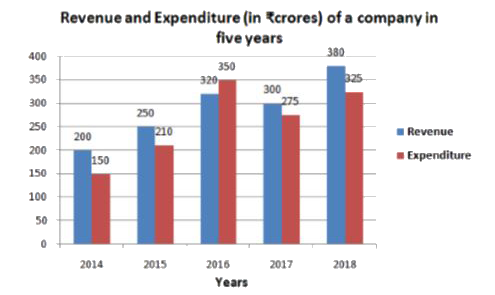
What is the ratio of the total expenditure in 2015 and 2016 to the total revenue of the company in 2016 and 2018?Aa) 4 : 5Bb) 19 : 20Cc) 6 : 7Dd)0.47222222222222The bar diagram shows the monthly expenditure of a company. Study the graph and answer the questions.
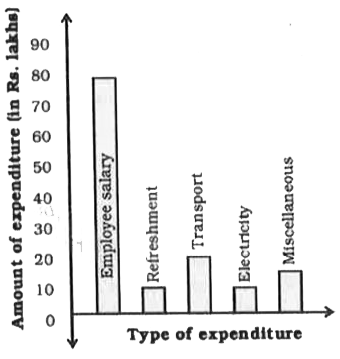
The total monthly expenditure of the company is :ARs. 153 lakhsBRs. 315 lakhsCRs. 135 lakhsDRs. 531 lakhs
The bar-graph given below shows the percentage distribution of total expenditures of a company under various expense heads during 2013. Study the graph and answer the given questions.
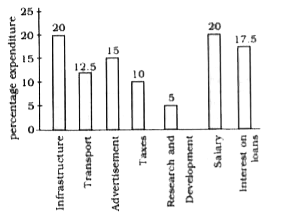
The ratio of the total expenditure on infrastructure and transport to the total expenditure on taxes and interest on loans is
View SolutionStudy the given graph and answer the question that follows
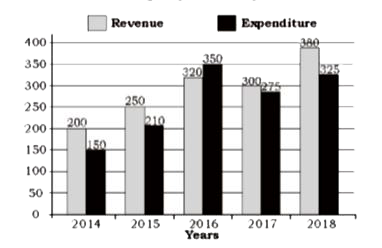
What is the ratio of the total expenditure in 2015 and 2016 to the total revenue of the company in 2016 and 2018?
View SolutionThe graph shows Income and Expenditure of a company. Study the graph and answer the questions.
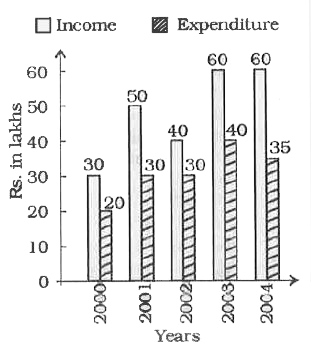
The income in 2002 was equal to the expenditure in the year
View SolutionThe bar diagram shows the monthly expenditure of a company. Study the graph and answer the questions.
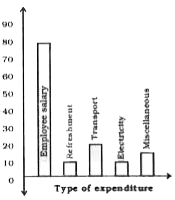
The total monthly expenditure of the company is :
View SolutionThe bar diagram shows the monthly expenditure of a company. Study the graph and answer the questions.
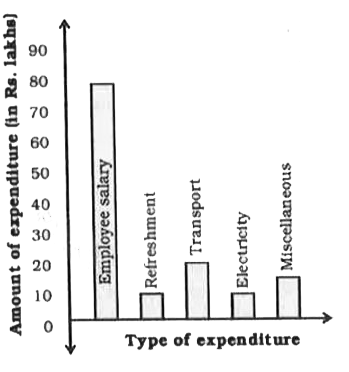
The ratio between expenditure on transport and employee salary on monthly basis is :
View Solution
