The following bar graph shows the marks (out of 100) of students A, B, C, D, E and F in the subjects mentioned.
निम्नलिखित दंड आरेख में, वर्णित
विषयों में छात्रों A, B, C, D, E और F के अंक (100 में से) दिखाए गए हैं।
 Based on this, only 2 students crossed the average marks in which subject:
इसके आधार पर, केवल 2 छात्रों ने किस विषय में औसत अंकों को पार किया है?
Maths/ गणित
Economics/ अर्थशास्त्र
Commerce/वाणिज्य
Civics/नागरिक शास्त्र
Step by step video & image solution for The following bar graph shows the marks (out of 100) of students A, B, C, D, E and F in the subjects mentioned. निम्नलिखित दंड आरेख में, वर्णित विषयों में छात्रों A, B, C, D, E और F के अंक (100 में से) दिखाए गए हैं। Based on this, only 2 students crossed the average marks in which subject: इसके आधार पर, केवल 2 छात्रों ने किस विषय में औसत अंकों को पार किया है? by Maths experts to help you in doubts & scoring excellent marks in Class 14 exams.
Updated on:21/07/2023Topper's Solved these Questions
Similar Questions
The graphs of the equations 3x+y-5=0 and 2x-y-5=0 intersect at the point P(α,β). What is the value of (3α+β) ?
समीकरण 3x+y-5=0 तथा 2x-y-5=0 के आरेख एक बिंदु P(α,β) पर एक-दूसरे को काटते है (3α+β) का मान क्या है ?
View SolutionAfter giving two successive discounts, each of x%, on the marked price of an article, total discount is Rs. 259.20. If the marked price of the article is Rs. 720, then the value of x is :
View SolutionMatch the following Column A to Column B

View SolutionMatch the following Column A to Column B

View SolutionMatch the following Column A to Column B

View SolutionThe inequation represented by the graph given below is :
View SolutionThe inequation that best describes the graph given below is _________
View SolutionThe inequation that best describes the following graph is _________
View SolutionIn the given figure, PQRS is a parallelogram. A and B are the mid-point of ¯¯¯¯¯¯PQ and ¯¯¯¯¯SR respectively. If PS=BR, then the quadrilateral ADBC is a…………………… ,
ltimg src="https://d10lpgp6xz60nq.cloudfront.net/physics_images/PS_MATH_IX_C12_E05_020_Q01.png" width="80%"gt
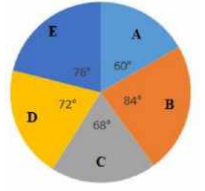
View SolutionThe given pie-chart shows the break-up of total marks obtained by a student in five subject A, B,C, D and E. The maximm marks in each subject is 150 and he obtained a total of 600 marks. निम्नलिखित वृत्त आरेख (पाई चार्ट) में एक विद्यार्थी द्वारा पांच विषयों (A, B,C, D और E) में प्राप्त कुल अंकों का विभाजन (ब्रेकअप) दर्शाया गया है। प्रत्येक विषय में अधिकतम अंक 150 हैं और उसने कुल 600 अंक प्राप्त किए हैं। The total marks obtained by the student in subject C and E is approximately how much percent more than what he obtained in A and D together? C और E विषयों में विद्यार्थी के द्वारा प्राप्त कुल अंक, उसके द्वारा A और D में प्राप्त कुल अंको से कितने प्रतिशत अधिक है?
View SolutionStudy the bar diagram and answer the questions. बार-आरेख का अध्ययन करें और प्रश्नों का उत्तर दें। Average marks obtianed by the students for all subjects in second term is दूसरी बार में सभी विषयों में छात्रों द्वारा प्राप्त औसत अंक क्या हे?
View SolutionThe number of students in classes A and B are 60 and 70, respectively. The average score in mathematics of students in B is 57 and that of all students in A and B is 63. What is the average score of students in A?
कक्षा A और B में छात्रों की संख्या क्रमश: 60 और 10 है | B में गणित में छात्रों का औसत अंक 57 तथा A और B के सभी छात्रों का गणित में औसत अंक 63 है |A के छात्रों का औसत अंक ज्ञात करें |
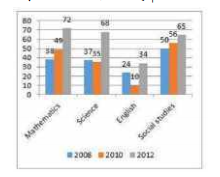
View SolutionThe given bar graph shows the number of marks scored by a student in each subject in three years.
दिया गया दंड आरेख एक छात्र के द्वारा तीन वर्षो में प्रत्येक विषय में लाये गए अंकों को दर्शाता है | In the given chart, in which subject was the lowest marks scored in 2010?
इस दंड आरेख के अनुसार वर्ष 2010 में किस विषय में सबसे कम अंक आये थे?
View SolutionThe given pie-chart shows the break-up of total marks obtained by a student in five subjects A, B, C, D and E. The maximum marks in each subject is 150 and he obtained a total of 600 marks.
दिया गया पाई-चार्ट एक छात्र के द्वारा पांच विषयों A, B, C, D और E में प्राप्त किये गए कुल अंकों को विच्छेदित करके दर्शाता है | प्रत्येक विषय का अधिकतम अंक 150 है और उसे कुल 600 अंक मिले हैं | The total marks obtained by the student in subjects C and E is approximately how much percent more than what he obtained in A and D together?
इस छात्र द्वारा विषय C और E में प्राप्त किये गए अंक उसके द्वारा A और D में एक साथ प्राप्त किये गए अंक से लगभग कितने प्रतिशत अधिक हैं ?
View SolutionIn the given bar graph, the percentage decrease in the number of students in Institute A in 2016 is what percent of students in 2015. इस दंड आरेख में संस्थान A में 2016 में छात्रों की संख्या में प्रतिशत कमी 2015 के छात्रों की संख्या का क्या प्रतिशत है ?
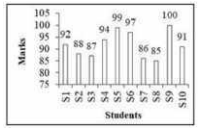
View SolutionThe bar graph given below presents the marks (out of 100) obtained by 10 students in a subject.
यह दंड आरेख एक विषय में 10 छात्रों के प्राप्तांक ( 100 में से ) को दर्शाता है | What is the average of the marks obtained by all the students?
सभी छात्रों के द्वारा प्राप्त किये गए अंकों का औसत क्या है ?
View Solution
