The table given below shows the number of units of a product produced and sold by a company in 6 years.
निम्न तालिका एक कंपनी द्वारा छह वर्षों के दौरान उत्पादित और बेचे गए उत्पाद की यूनिटों की संख्या दर्शाती है|
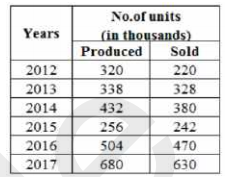 In which year, the production of product units is about 31.4% lower than units sold in 2017?
किस वर्ष में, उत्पाद की यूनिटों का उत्पादन 2017 में बेची गई यूनिटों की तुलना में लगभग 31.4% कम है ?
2014
2013
2012
2016
Step by step video & image solution for The table given below shows the number of units of a product produced and sold by a company in 6 years. निम्न तालिका एक कंपनी द्वारा छह वर्षों के दौरान उत्पादित और बेचे गए उत्पाद की यूनिटों की संख्या दर्शाती है| In which year, the production of product units is about 31.4% lower than units sold in 2017? किस वर्ष में, उत्पाद की यूनिटों का उत्पादन 2017 में बेची गई यूनिटों की तुलना में लगभग 31.4% कम है ? by Maths experts to help you in doubts & scoring excellent marks in Class 14 exams.
Updated on:21/07/2023Topper's Solved these Questions
Similar Questions
The table given below shows the number of units of a product produced and sold by a company in 6 years.
निम्न तालिका एक कंपनी द्वारा छह वर्षों के दौरान उत्पादित और बेचे गए उत्पाद की यूनिटों की संख्या दर्शाती है|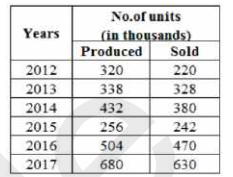 Find the ratio of the total number of units sold in 2013 and 2015 to the number of units produced in
2015 and 2016?
2013 और 2015 में बेची गई उत्पाद के यूनिटों की कुल संख्या तथा 2015 और 2016 में उत्पादित यूनिटों की संख्या का अनुपात ज्ञात कीजिए ?
View SolutionThe table given below shows the number of units of a product produced and sold by a company in 6 years.
निम्न तालिका एक कंपनी द्वारा छह वर्षों के दौरान उत्पादित और बेचे गए उत्पाद की यूनिटों की संख्या दर्शाती है|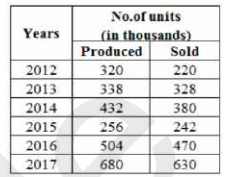 The number of units sold in 2016 is approximately what percent more than the average number of
units produced from 2012 to 2016?
2016 में बेची गई उत्पाद के यूनिटों की संख्या, 2012 से लेकर 2016 तक उत्पादित औसत यूनिटों की संख्या से लगभग कितने प्रतिशत अधिक है ?
View Solution
Knowledge Check
The following table presents the number of units of a product produced and sold by a company during six years.
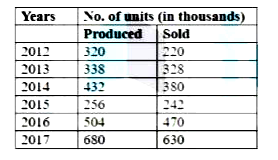
The number of units of the product sold in 2016 is approximately what percent more than the average production of the units in 2012 to 2016 ?A24B32C27D21
The given Bar Graph presents the number of students of two schools for six years.
दिया गया दंड आरेख (बार ग्राफ) छह वर्षो के दौरान दो स्कूलों में विद्यार्थियों की संख्या को दर्शाता है|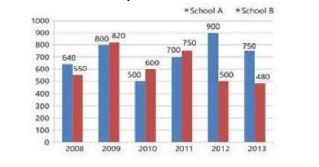 In which year, percentage increase of students in school A is the highest in comparison to its previous year ?
किस वर्ष में, स्कूल A की विद्याथियों की संख्या में प्रतिशत वृद्धि इसके पिछले वर्ष की तुलना में सबसे अधिक है?
View SolutionThe table shows the production of different types of cars (in thousands).
यह तालिका एक कंपनी द्वारा अलग-अलग कारों के उत्पादन ( हज़ार में ) को दर्शाती है |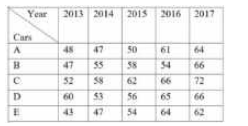 The total production of type B cars during 2013 to 2016 is approximately what percent less than the total production of cars in 2017?
2013 से 2016 के दौरान B प्रकार की कारों का कुल उत्पादन 2017 में कारों के कुल उत्पादन से लगभग कितना प्रतिशत कम है ?
View SolutionThe given Bar Graph presents the number of students of two schools for six years.
दिया गया दंड आरेख (बार ग्राफ) छह वर्षो के दौरान दो स्कूलों में विद्यार्थियों की संख्या को दर्शाता है|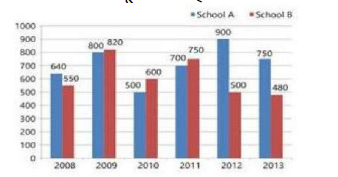 In which year, the percentage increase in students in school B is the highest in comparison to its previous year?
किस वर्ष में, स्कूल B के विद्यार्थियों की संख्या में प्रतिशत वृद्धि इसके पिछले वर्ष की तुलना में सबसे अधिक है?
View SolutionTable shows the production of rice (in million tonnes) of three states over six years.
यह तालिका तीन राज्यों में छः वर्षों में दौरान चावल के उत्पादन ( मिलियन टन में ) को दर्शाती है | What is the ratio of the production of rice in all three states in the year 2014 to that in 2016?
सभी तीन राज्यों में वर्ष 2014 तथा 2016 में उत्पादित चावल की मात्रा में अनुपात ज्ञात करें |
View SolutionThe given Bar Graph presents the number of students of two schools for six years.
दिया गया दंड आरेख छः वर्ष की अवधि में दो विद्यालयों में छात्रों की संख्या को दर्शाता है | In which year, the percentage increase in students in school B is the highest in comparison to its
previous year?
किस वर्ष में, विद्यालय B में छात्रों की संख्या में प्रतिशत वृद्धि इसके पिछले वर्ष की तुलना में सबसे अधिक रही है?
View SolutionThe table shows the number of cars sold by three showrooms over a period of six years.
यह तालिका तीन शोरूम द्वारा छः वर्षों की अवधि में बेची गयी कारों की संख्या दर्शाती है |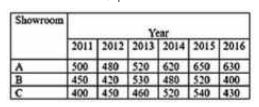 What is the average number of cars sold by showroom A over the given six years (nearest to one decimal place)?
दिए गए छः वर्षों में शोरूम A द्वारा बेची गयी कारों की औसत संख्या कितनी है ? (एक दशमलव स्थान के निकटतम )
View SolutionThe table shows the production of different types of cars (in thousands).
यह तालिका एक कंपनी द्वारा अलग-अलग कारों के उत्पादन ( हज़ार में ) को दर्शाती है |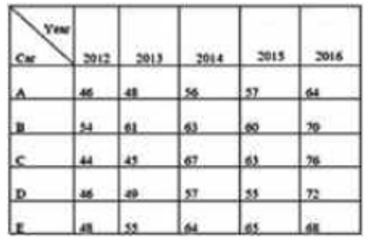 The average production of type C cars during 2012 to 2016 is approximately what percent less than the total production of type D cars in 2012 and type E cars in 2014?
2012 से 2016 के दौरान C प्रकार की कारों का औसत उत्पादन 2012 में D प्रकार एवं 2014 में E प्रकार की कारों के कुल उत्पादन से लगभग कितना प्रतिशत कम है ?
View Solution
