the following graph shows the expenditure on education sector by Indian government for the year 2014-15 to 2019-20
निम्नलिखित आरेख भारत सरकार के द्वारा वर्ष 2014-15 से 2019-20 तक शिक्षा के क्षेत्र में किये गए व्यय को दर्शाता है।
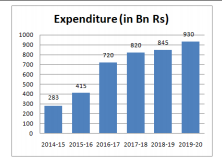 If the government plans to increase the expenditure by 30% on the average expenditure in 2016-17, 2017-18, 2018-19, then the approximate amount (in billion of rupees) to be spent in 2020-21 is:
यदि सरकार 2016-17, 2017-18, 2018-19 में औसत व्यय के आधार पर व्यय को 30% बढ़ाना चाहती है,
तो वर्ष 2020-21 में लगभग कितनी राशि ( अरब रुपये में ) खर्च की जाएगी।
1162.6
1129.5
1033.5
1087.3
Step by step video & image solution for the following graph shows the expenditure on education sector by Indian government for the year 2014-15 to 2019-20 निम्नलिखित आरेख भारत सरकार के द्वारा वर्ष 2014-15 से 2019-20 तक शिक्षा के क्षेत्र में किये गए व्यय को दर्शाता है। If the government plans to increase the expenditure by 30% on the average expenditure in 2016-17, 2017-18, 2018-19, then the approximate amount (in billion of rupees) to be spent in 2020-21 is: यदि सरकार 2016-17, 2017-18, 2018-19 में औसत व्यय के आधार पर व्यय को 30% बढ़ाना चाहती है, तो वर्ष 2020-21 में लगभग कितनी राशि ( अरब रुपये में ) खर्च की जाएगी। by Maths experts to help you in doubts & scoring excellent marks in Class 14 exams.
Updated on:21/07/2023Topper's Solved these Questions
Similar Questions
The given Bar Graph presents Income and Expenditure (in crores of Rupees) of a company for the five years, 2014 to 2018.
दिया गया दंड आरेख पांच वर्षों अर्थात 2014 से 2018 तक एक कंपनी के आय एवं व्यय ( करोड़ रुपये में ) को दर्शाता है |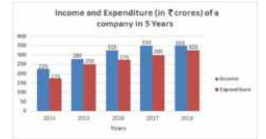 In which year is the Expenditure more than 40% as compared to the Expenditure in the previous year?
किस वर्ष में व्यय पिछले वर्ष के व्यय की तुलना में 40% अधिक है ?
View SolutionThe given Bar Graph presents Income and Expenditure (in crores of Rupees) of a company for the five years, 2014 to 2018.
दिया गया दंड आरेख पांच वर्षों अर्थात 2014 से 2018 तक एक कंपनी के आय एवं व्यय ( करोड़ रुपये में ) को दर्शाता है |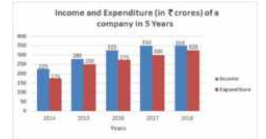 What is the ratio of total Expenditure to total Income of the company in 2014, 2016 and 2017?
2014, 2016 और 2017 में कंपनी के कुल व्यय और कुल आय में क्या अनुपात है ?
View Solution
Knowledge Check
The expenditure of the company in 2017 is what percentage less than the average revenue in 2014,2015 and 2016.
A1129B1119C813D1213the given bar graph presents income and Expenditure of a company for the five years, 2014 to 2018
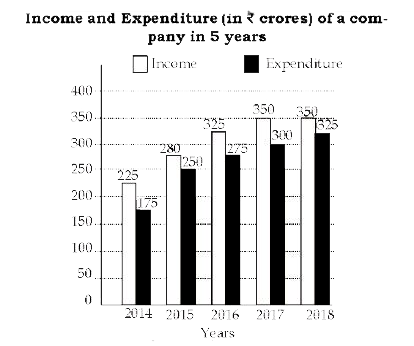
What is the ratio of total expenditure to total income of the company in 2014,2016 and 2017?A13:18B3:4C15:16D5:6The given bar graph presents the Revenue and Expenditure of a company during the five year period 2014-2018
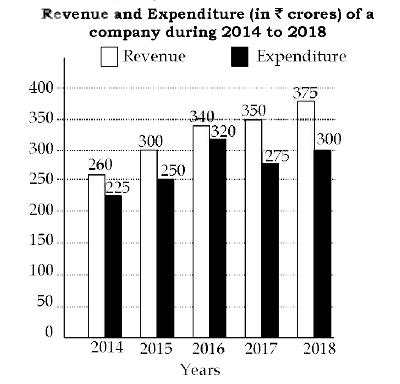
What is the ratio of the total revenue of the company in 2015 and 2018 to that of its expenditure in 2014 and 2018.A5:4B7:5C9:7D13:10
The given Bar Graph presents Income and Expenditure (in crores of Rupees) of a company for the five years, 2014 to 2018.
दिया गया दंड आरेख पांच वर्षों अर्थात 2014 से 2018 तक एक कंपनी के आय एवं व्यय ( करोड़ रुपये में ) को दर्शाता है |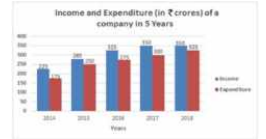 The expenditure of the company in 2017 is what percentage less than the average revenue (per year) in 2014, 2015 and 2016?
2017 में कंपनी का व्यय 2014, 2015 और 2016 की औसत आय ( प्रति वर्ष) से कितना प्रतिशत कम है ?
View SolutionThe given Bar Graph presents Income and Expenditure (in crores of Rupees) of a company for the five years, 2014 to 2018.
दिया गया दंड आरेख पांच वर्षों अर्थात 2014 से 2018 तक एक कंपनी के आय एवं व्यय ( करोड़ रुपये में ) को दर्शाता है |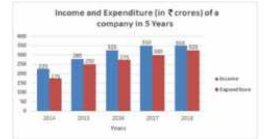 What is the ratio of the total revenue of the company in 2015 and 2018 to that of its expenditure in 2014 and 2018?
2015 तथा 2018 में कंपनी की कुल आय और 2014 तथा 2018 में कंपनी के कुल व्यय में क्या अनुपात है ?
View SolutionThe given Bar Graph present the Imports and Exports of an item (in tonnes) manufactured by a company for the five financial years, 2013-2014 to 2017-2018.
दिया गया दंड आरेख (बार ग्राफ) पांच वित्त वर्षों, 2013-2014 से 2017-2018, के दौरान किसी कंपनी दवारा निर्यात किसी वस्तु (टन में] के आयात और निर्यात को दर्शाता है|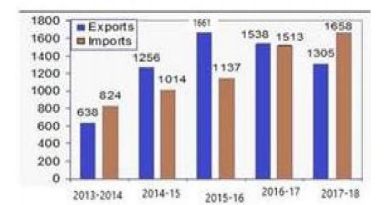 What is the ratio of total Imports to total Exports during 2014- 2015, 2015- 2016 and 2016- 2017?
वर्ष 2014-2015, 2015-2016 33 2016-2011 के दौरान, कुल आयात और निर्यातों का अनुपात कितना है?
View Solutionthe given bar graph presents income and Expenditure of a company for the five years, 2014 to 2018

The average income of the company in five years in what percentage more than its expenditure in 2015?
View SolutionGovernment usually classifies its expenditure in term of planned and non-planned expenditure. Identify, which is the correct definiton of Planned expenditure?
View Solution
