The following graph shows the number of students (in hundreds) in three different courses in four different institutes.Study the graph and answer the question. What is the total number of students (in hundreds) in M.Sc. course across all institutes?
निम्नलिखित आरेख चार अलग-अलग संस्थानों में तीन अलग-अलग पाठ्यक्रमों में छात्रों की संख्या , (सैकड़ों में) दिखाता है। आरेख का
अध्ययन करें और प्रश्न का उत्तर दें।
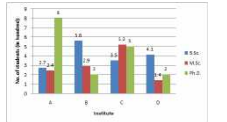
सभी संस्थानों में M.Sc. पाठ्यक्रम में छात्रों की कुल संख्या (सो में ) कितनी है?
11.5
11.9
10.5
10.8
Step by step video & image solution for The following graph shows the number of students (in hundreds) in three different courses in four different institutes.Study the graph and answer the question. What is the total number of students (in hundreds) in M.Sc. course across all institutes? निम्नलिखित आरेख चार अलग-अलग संस्थानों में तीन अलग-अलग पाठ्यक्रमों में छात्रों की संख्या , (सैकड़ों में) दिखाता है। आरेख का अध्ययन करें और प्रश्न का उत्तर दें। सभी संस्थानों में M.Sc. पाठ्यक्रम में छात्रों की कुल संख्या (सो में ) कितनी है? by Maths experts to help you in doubts & scoring excellent marks in Class 14 exams.
Updated on:21/07/2023Topper's Solved these Questions
Similar Questions
The given bar graph represents the number of students who appeared in the board examination in session 2017-18 and 2018-19. Study the graph and answer the question that follows. What is the ratio of the total number of students appeared in examinations in 2017-18 and 2018-19?
दिया गया दंड आरेख सत्र 2017-18 और 2018-19 सत्र में बोर्ड परीक्षा में उपस्थित होने वाले छात्रों की संख्या को दर्शाता है। आरेख का अध्ययन करें और प्रश्न का उत्तर दें।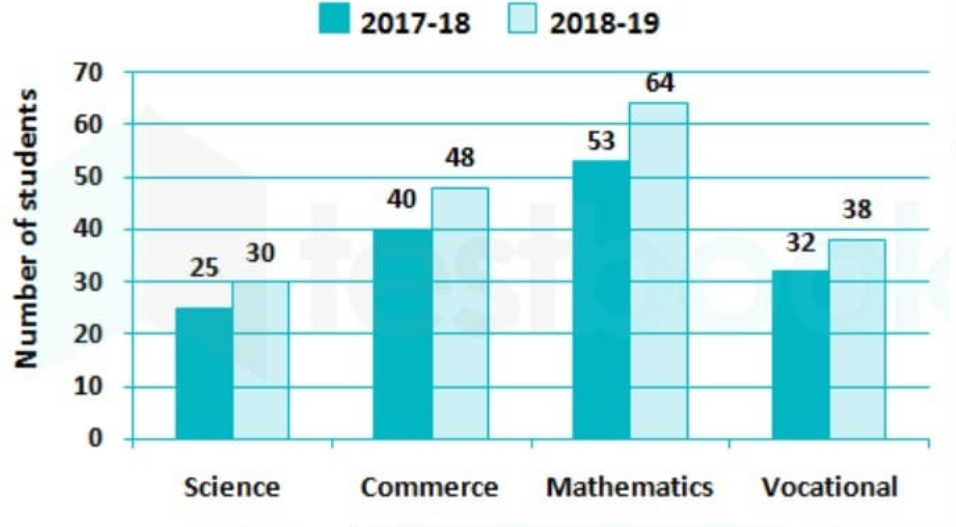
2017-18 और 2018-19 में परीक्षा में उपस्थित हुए छात्रों की कुल संख्या का अनुपात कया है ?
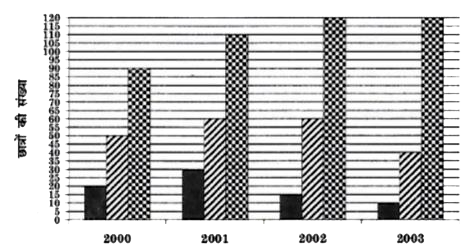
View SolutionThe graph shows the result of 10th class students of a school for 4 years. Study the graph and answer the questions:
The number of students appeared for the 10th class exam in the year 2002 is.
निम्नलिखित दण्ड आरेख 10 वीं कक्षा के छात्रों का 4 वर्ष का परीक्षा परिणाम दर्शाता है। आरेख का अध्ययन कीजिए और निम्नलिखित प्रश्नों का उत्तर दीजिए : छात्रों की संख्या
वर्ष 2002 में 10 वीं कक्षा की परीक्षा में शामिल छात्रों की संख्या बताइए:
View SolutionThe bar graph given below shows the number of cars parked in a parking area during ten different days. What is the total number of cars parked in the parking area for all 10 days ?
नीचे दिया गया दंड आरेख किसी पार्किंग क्षेत्र में दस अलग-अलग दिनों में खड़ी कारों की संख्या को दर्शाता है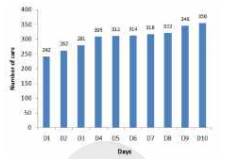 पार्किंग क्षेत्र में सभी 10 दिनों में खड़ी कारों की कुल संख्या कितनी है ?
View SolutionThe following graph shows the number of boys and girls in class V, class VI, class VII and class VIII. Study the graph and answer the question.
निम्नलिखित आरेख कक्षा V, कक्षा VI, कक्षा VII और कक्षा VIII में लड़कों और लड़कियों की संख्या दर्शाता है। आरेख का अध्ययन करें और प्रश्न का उत्तर दें। Which class has the maximum number of students?
किस कक्षा में छात्रों की अधिकतम संख्या है?
View SolutionThe following graph shows the sales of cars (in thousands) in four cities in 4 years. Study the graph and answer the questions.
निम्नलिखित आरेख 4 वर्षों में चार शहरों में कारों की बिक्री (हज़ार में) को दर्शाता है। इस आरेख का अध्ययन कीजिए तथा प्रश्नों के उत्तर दीजिए। In 2019, what is the average number of sales among all the four cities?
2019 में, सभी चार शहरों में औसत बिक्री कितनी रही है?
View SolutionThe following pie chart shows the percentage-wise distribution of the number of students in five different schools P, Q, R, S and T. The total number of students in all five schools together is 8400.
निम्नलिखित पाई चार्ट पांच अलग-अलग स्कूलों P, Q, R, S और T में छात्रों की संख्या के प्रतिशत को दर्शाता है। सभी पाँच स्कूलों में कुल छात्रों की संख्या 8400 है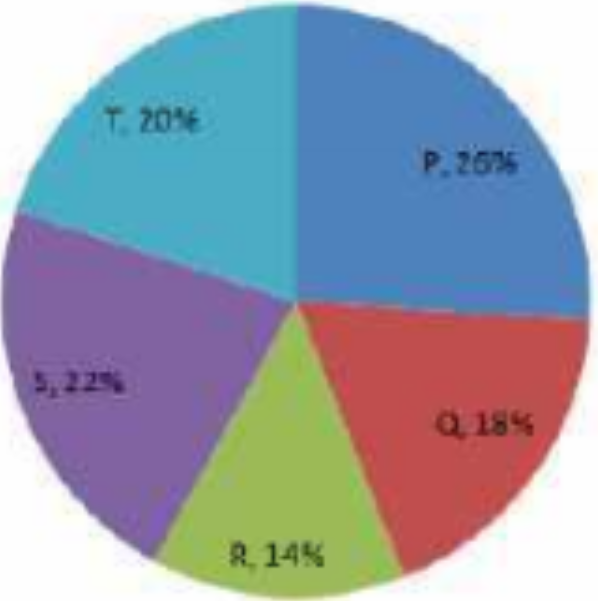 Find the average number of students in schools R and S together.
स्कूलों R और S में एक साथ छात्रों की औसत संख्या ज्ञात कीजिए।
View SolutionThe following graph shows the number of boys and girls in class V, class VI, class VII and class VIII. Study the graph and answer the question.
निम्नलिखित आरेख कक्षा V, कक्षा VI, कक्षा VII और कक्षा VIII में लड़कों और लड़कियों की संख्या दर्शाता है। आरेख का अध्ययन करें और प्रश्न का उत्तर दें। What is the average number of girls in all the classes?
सभी कक्षाओं में लड़कियों की औसत संख्या क्या है?
View SolutionThe Table shows the number of students from different schools playing different games.
यह तालिका अलग-अलग विद्यालयों के छात्रों की संख्या को दर्शाती है जो अलग-अलग खेल खेलते हैं ?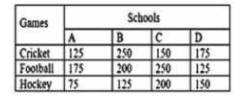 What is the average of the number of students who play cricket in all four schools?
सभी चार विद्यालयों में क्रिकेट खेलने है छात्रों की औसत संख्या कितनी
View SolutionIn the given bar graph, the percentage decrease in the number of students in Institute A in 2016 is what percent of students in 2015.
इस दंड आरेख में संस्थान A में 2016 में छात्रों की संख्या में प्रतिशत कमी 2015 के छात्रों की संख्या का क्या प्रतिशत है ?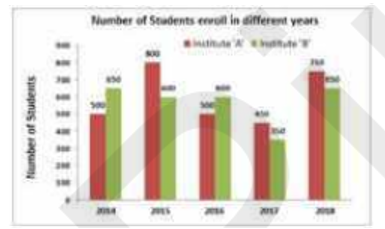
View SolutionThe following graph shows the number of boys and girls in class V, class VI, class VII and class VIII. Study the graph and answer the question.
निम्नलिखित आरेख कक्षा V, कक्षा VI, कक्षा VII और कक्षा VIII में लड़कों और लड़कियों की संख्या दर्शाता है। आरेख का अध्ययन करें और प्रश्न का उत्तर दें। In which class, the percentage increase in the number of boys as compared to its previous class is least?
किस कक्षा में लड़कों की संख्या में पिछले कक्षा की तुलना में प्रतिशत की वृद्धि सबसे कम है?
View Solution
