Study the bar graph and answer the questions that follows.
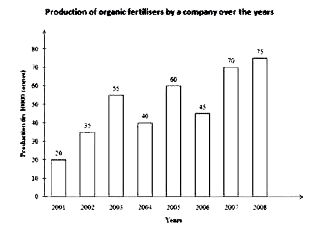
The ratio of the total production of organic fertilisers by the company in the years 2005, 2006 and 2008 to the total production in the years 2001, 2002, 2003 and 2004, is :
5:6
3:4
6:5
4:3
Step by step video & image solution for Study the bar graph and answer the questions that follows. The ratio of the total production of organic fertilisers by the company in the years 2005, 2006 and 2008 to the total production in the years 2001, 2002, 2003 and 2004, is : by Maths experts to help you in doubts & scoring excellent marks in Class 14 exams.
Updated on:21/07/2023Topper's Solved these Questions
Similar Questions
Knowledge Check
Study the bar graph and answer the question that follows.
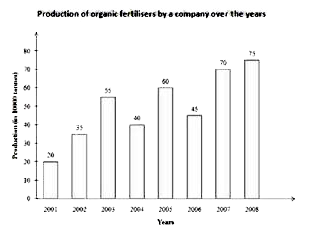
The ratio of the total production of organic fertilizers by the company in the years 2005. 2006 and 2008 to the total production in the years 2001, 2002, 2003 and 2004. is:A5:6B4:3C6:5D3:4Study the following graph and answer the following questions :-
Following graph shows the actual & target productin of a companry over the period (in thousand tonnes)
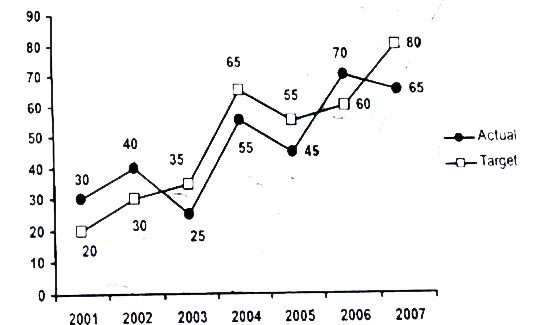
the target production in the year 2001, 2003 and 2005 together is what percent of acutal production of 2002, 2004 and 2006 together ?A2613%B3712%C6643%D6623%Study the following bar diagram carefully and answer the four questions.
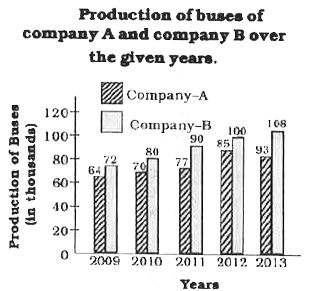
The ratio of the average production of company A in 2009 and 2010 to the average production of company B in the same years isA147:170B81:95C67:76D85:99
Study the following bar graph and answer the question given
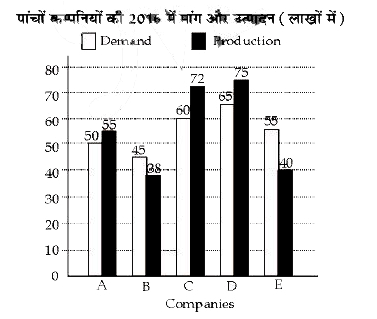
The ratio of the total demand of motorcycles of companies A,C and E to the total production of motorcycles of B and C is:
View SolutionStudy the following graph carefully and answer the questions that follow
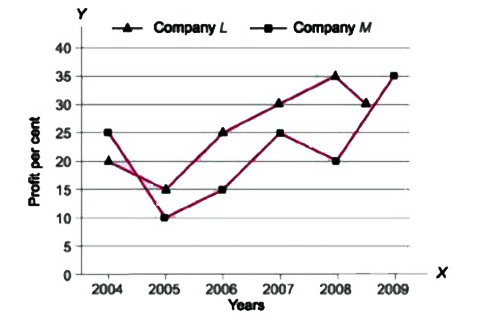
If the profit earned by company L in the year 2005 was ? 1.84 lak , what was the profit earned by the company in the year 2006 ?
View SolutionStudy the following graph carefully and answer the questions that follow
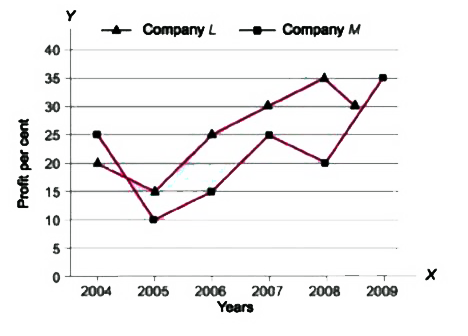
If the profit earned by company M in the year 2008 was ? 3.63 lak , what was the amont of profit earned by it in the year 2006 ?
View SolutionThe table shows the production of different types of cars by a company (in thousands) in 5 years. Study the table and answer the questions.
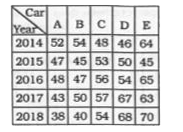
What is the ratio of the total production of type C cars in 2015 and type D cars in 2017 taken together to the total production of type B cars in 2016 and type A cars in 2017 taken together ?
View SolutionStudy the table graph carefully to answer the questions that follows
Production of main crops in India (in million tonnes)
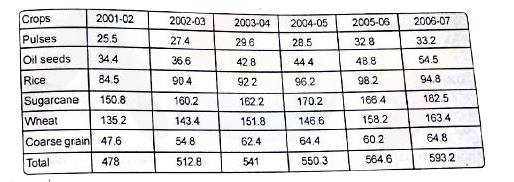
Production of rice was what percentage of the total crops produced in the year 2001-02 ?
View Solution

