Study the following bar diagram and answer the question that follows.
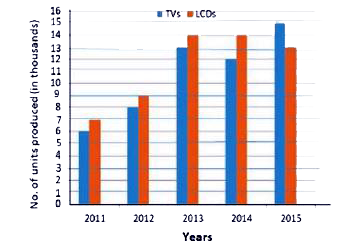
निम्नलिखित दंड आरेख का अध्ययन करें और उस प्रश्न का उत्तर दें जो पूछा गया है। The production (in thousands) of electronic items (TV and LCD) in a factory during the period from
2011 to 2015.
2011 से 2015 की अवधि के दौरान
एक कारखाने में इलेक्ट्रॉनिक वस्तुओं (TV और LCD) का उत्पादन (हजारों में)
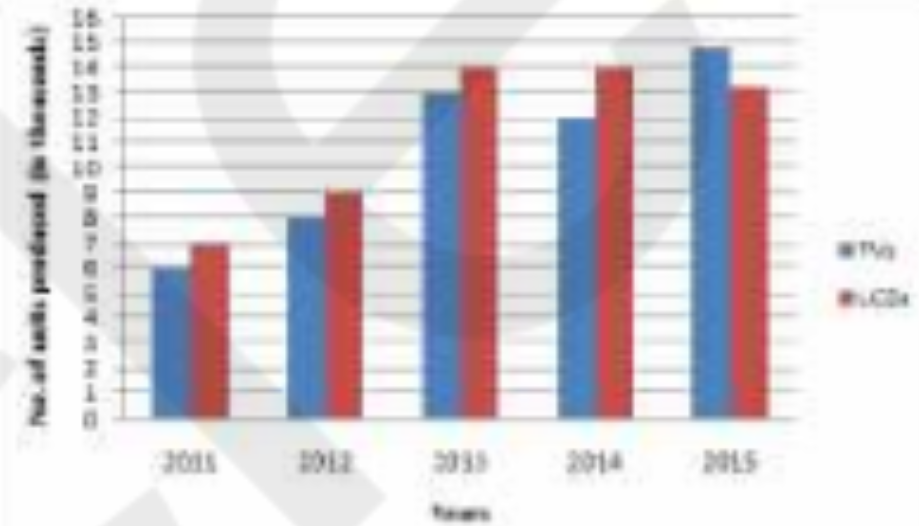 The ratio of the total production of LCDs in the year 2012 and 2014 to the total production of TV’s in the year 2012 and 2014 is:
वर्ष 2012 और 2014 में एलसीडी के कुल उत्पादन और वर्ष 2012 और 2014 में टीवी के कुल उत्पादन का अनुपात है:
23:20
19:21
23:25
21:25
The correct Answer is:A
Step by step video & image solution for Study the following bar diagram and answer the question that follows. निम्नलिखित दंड आरेख का अध्ययन करें और उस प्रश्न का उत्तर दें जो पूछा गया है। The production (in thousands) of electronic items (TV and LCD) in a factory during the period from 2011 to 2015. 2011 से 2015 की अवधि के दौरान एक कारखाने में इलेक्ट्रॉनिक वस्तुओं (TV और LCD) का उत्पादन (हजारों में) The ratio of the total production of LCDs in the year 2012 and 2014 to the total production of TV’s in the year 2012 and 2014 is: वर्ष 2012 और 2014 में एलसीडी के कुल उत्पादन और वर्ष 2012 और 2014 में टीवी के कुल उत्पादन का अनुपात है: by Maths experts to help you in doubts & scoring excellent marks in Class 14 exams.
Updated on:21/07/2023Topper's Solved these Questions
Similar Questions
Study the following bar diagram and answer the question that follows.
The production (in thousands) of electronic items (TV and LCD) in a factory during the period from 2011 to 2015.
 The difference between the average production of LCDs and that of the TVs from 2011 to 2013 is
View SolutionStudy the following bar diagram and answer the question that follows .
The production ( in thousands) of electronic item (TV and LCD) in a factory during the period from 2011 to 2015 .
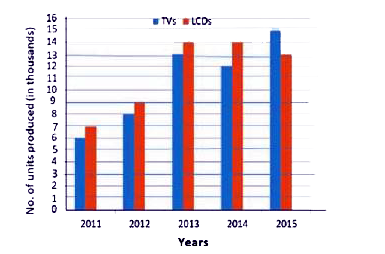
The difference between the average production of LCDs and that of TVs from 2011 to 2013 is :
View Solution
Knowledge Check
Study the following bar diagram carefully and answer the following questions :
निम्नलिखित आरेख का ध्यानपूर्वक अध्ययन करें और दिए गए प्रश्नों का उत्तर दें:
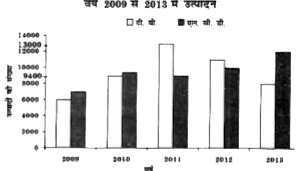
The ratio of production of LCDs in the year 2011 and 2013 is.
वर्ष 2011 और 2013 में एल. सी. डी. के उत्पादन का अनुपात हैA(a) 4:3B(b) 2:3C(c)1:4D(d)3:4Study the following bar diagram carefully and answer the following questions :
निम्नलिखित आरेख का ध्यानपूर्वक अध्ययन करें और दिए गए प्रश्नों का उत्तर दें:
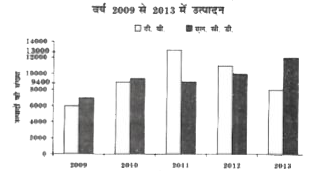
The difference between averages of production of TVs and LCDs from 2009 to 2012 is.
वर्ष 2009 से 2012 तक टी. वी. और एल. सी. डी. के उत्पादन के औसत में अंतर हैA(a) 700B(b) 900C(c) 600D(d) 800Study the following bar diagram carefully and answer the following questions :
निम्नलिखित आरेख का ध्यानपूर्वक अध्ययन करें और दिए गए प्रश्नों का उत्तर दें:
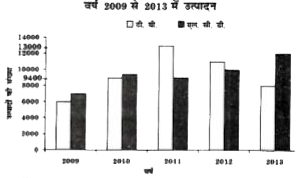
The ratio of production of TVs in the years 2009 and 2010 is.
वर्ष 2009 और 2010 में टी. वी. के उत्पादन का अनुपात -A(a)7:6B(b) 2:3C(c) 6:7D(d) 3:2
Study the following diagram and answer the question that follows .
The production ( in thousands) of electronic items (TV and LCD) in factory during the period 2011 to 2015 .
The ratio of the total production of LCDs in the year 2012 and 2014 to the total production of TVs in the year 2012 and 2014 is :
View SolutionStudy the following bar diagram carefully and answer the following questions. The number of the production of electronic items (TVs and LCDs) in a factory during the period from 2009 to 2013.
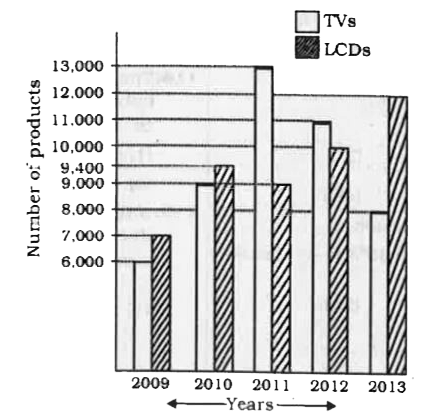
The ratio of production of LCDs in the year 2011 and 2013 is
View SolutionStudy the graph and answer (the question that follows.
आरेख का अध्ययन करें और उस प्रश्न का उत्तर दें जो पूछा गया है What is the ratio of enrolment during 1995-1996 10 the enrolment during 1998-1999?
1998-1999 के दौरान नामांकन तथा ह 1995-1996 के दौरान नामांकन में : क्या अनुपात है?
View SolutionStudy the following bar diagram carefully and answer the following questions. The number of the production of electronic items (TVs and LCDs) in a factory during the period from 2009 to 2013.
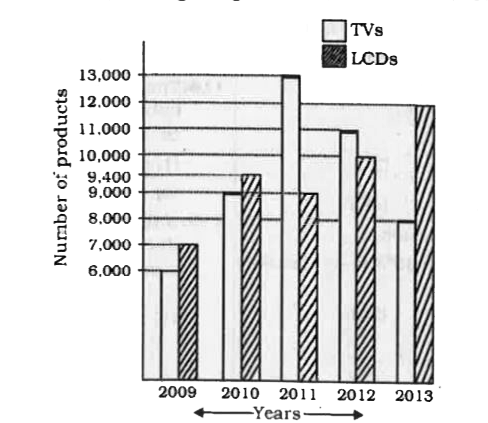
The ratio of production of TVs in the years 2009 and 2010 is
View SolutionStudy the following bar diagram carefully and answer the following questions :
:
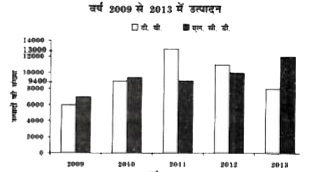
The total number of a products of electronic items is maximum in the year.
View Solution