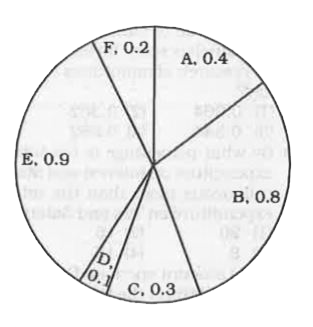
The pie chart shows the annual car production (percentage wise) of six countries A,B,C,D,E and F.
Study the pie chart and answer the question.
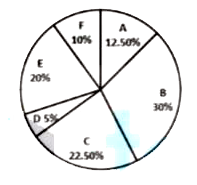
Total number of cars produced =40,00,000
The number of cars produced by country B is what percent more than that produced by country E?
0.6
0.25
0.4
0.5
Step by step video & image solution for The pie chart shows the annual car production (percentage wise) of six countries A,B,C,D,E and F. Study the pie chart and answer the question. Total number of cars produced =40,00,000 The number of cars produced by country B is what percent more than that produced by country E? by Maths experts to help you in doubts & scoring excellent marks in Class 14 exams.
Updated on:21/07/2023Topper's Solved these Questions
Similar Questions
The pie chart shows the annual car production of six countries (A,B,C,D,E,F) study the diagram and answer the following question
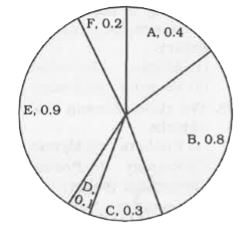
Which country produced the second least number of cars
View SolutionThe pie chart shows the annual car production of six countries (A,B,C,D,E,F) study the diagram and answer the following question
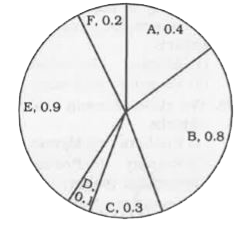
If 35% of the cars produced by these six countries are die then how many petrol cars were produced
View Solution
Knowledge Check
The pie chart shows the annual car production (percentage wise) of six countries A,B,C,D,E and F.
Study the pie chart and answer the question
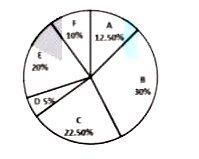
Total number of cars produced =40,00,000
If 45% of the cars numbers of produced by these six countries are diesel cars and the rest are petrol cars, then how many petrol cars were produced?A22lakhB24lakhC25lakhD20lakhThe pie-chart shows the annual car production (in millions) of six countries (A, B, C, D ,E, F). Study the diagram and answer the following questions.
Which country produced the second least number of cars ?ADBFCCDAThe pie chart shows the annual car production of six countries (A,B,C,D,E,F) study the diagram and answer the following question
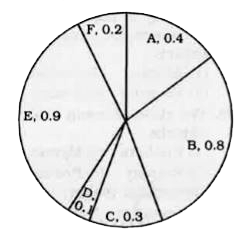
Country E produced how many more cars (in %) than that of country BA10B12.5C11.11D8
The pie chart shows the annual car production of six countries (A,B,C,D,E,F) study the diagram and answer the following question

Country E produced how many more cars (in %) than that of country B
View SolutionStudy the pie chart and answer the question
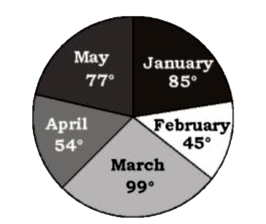
The total number of computers sold in February and April is what percentage more than the number of computers sold in May
View SolutionStudy the pie chart and answer the question
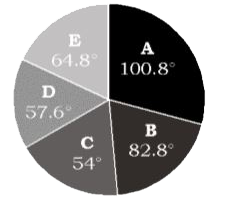
The total number of employees of the company in offices D and E in what percentage more than the number of employees in office A?
View SolutionStudy the given pie chart and answer the question that follows
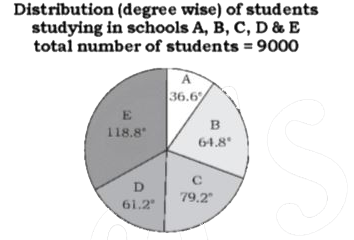
The total number of students in schools D and E is what percentage more than the number of students in schools B and C?
View SolutionThe pie-chart shows the annual car production (in millions) of six countries (A, B, C, D ,E, F). Study the diagram and answer the following questions.
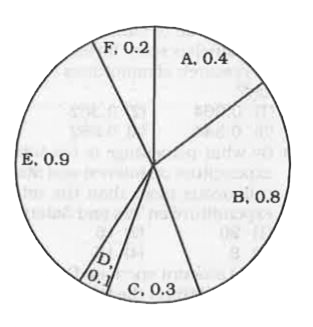
If 35% of the cars produced by these six countries are diesel and the rest are petrol, then how many petrol cars were produced (in millions) ?
View Solution
