The given pie char represents the popularity of ice-cream flavours in the year 2005.
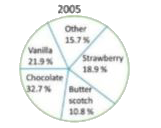
In 2005, if 10 % of the 'other' category is mix fruit flavour and 1570 people surveyed preferred mix fruit flavour, then how many people were surveyed ?
1,75,000
1,00,000
1,50,000
4,00,000
Step by step video & image solution for The given pie char represents the popularity of ice-cream flavours in the year 2005. In 2005, if 10 % of the 'other' category is mix fruit flavour and 1570 people surveyed preferred mix fruit flavour, then how many people were surveyed ? by Maths experts to help you in doubts & scoring excellent marks in Class 14 exams.
Updated on:21/07/2023Topper's Solved these Questions
Similar Questions
The given pie chart represents the popularity of ice-cream flavours in the year 2015.
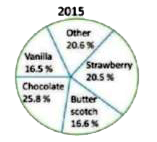
In 2015, if the total sale of chocolate flavour is for ~ 5 , 1 60 , then the total sale (in Rs) for vanilla flavour is:
View SolutionThe given pie chart represents the popularity of ice-cream flavours in the year 2005 and 2015
2015 दिए गए पाई चार्ट वर्ष 2015 में आइसक्रीम के स्वादों की लोकप्रियता को दर्शाता हैं
In 2005, if 40% of the ‘other’ category is mix fruit flavour and 1570 people surveyed preferred mix fruit flavour, then how many people were surveyed?
2005 में, यदि अन्य श्रेणी का 40% मिक्स फ्रूट स्वाद है और 1570 लोगों ने पसंदीदा मिक्स फ्रूट स्वाद है सर्वेक्षण में पता लगा है, तो कितने लोगों का सर्वेक्षण में हिस्सा लिया था |
View Solution
Knowledge Check
The given pie chart represents the popularity of ice-cream flavours in the year 2015.
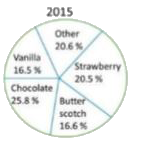
In 2015, if the total sale of vanilla flavour is for ₹ 3,300 , then total sale (in ₹) for chocolate flavour is :A₹ 5,160B₹ 4,100C₹ 4,120D₹ 3,320The given pie charts represent the popularity of ice-cream flavours in the years 2005 and 2015.
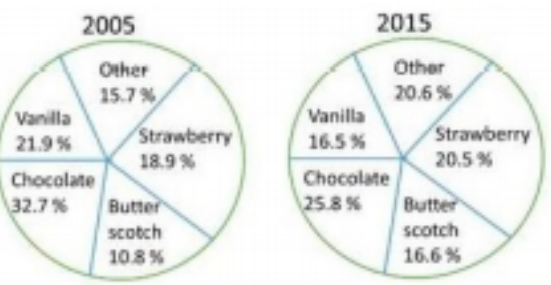
If a percentage point shift results in annual additional sales ₹ 10,000 how much (in ₹), did the combined annual strawberry and butterscotch sales increase from 2005 to 2015 ?A₹ 65,000B₹ 10,000C₹ 74,000D₹ 37,000Study the given information carefully and answer the questions based on it.
A survey was made to find the type of music that a certain group of young people liked in a city. Following pie chart shows the findings of this survey.
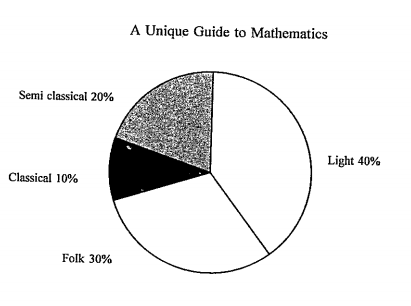
If 20 people liked classical music, how many young people were surveyed?A100B250C150D200
The given pie charts represent the popularity of ice-cream flavours in the years 2005 and 2015.
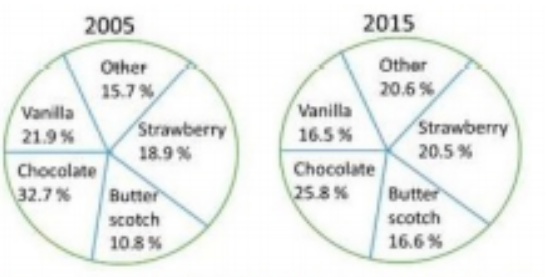
If a percentage point shift results in annual additional sales of Rs 5,000, how much (in Rs), did the combined annual strawberry and butterscotch sales increa se from 2005 ro 2015?
View SolutionThe given pie chart represents the popularity of ice-cream flavours in the years 2005 and 2015
दिए गए पाई चार्ट वर्ष 2005 और 2015 में आइसक्रीम के स्वादों की लोकप्रियता को दर्शाता हैं
If a percentage point shift results in annual addition sales of Rs. 5,000. How much (in Rs.), did the combined annual strawberry and butterscotch sales from 2005 to 2015?
यदि प्रतिशत बिंदु चक्र 10,000 रु की वार्षिक अतिरिक्त बिक्री में बदलता है| तो 2005 और 2015 में स्ट्रॉबेरी और बटरस्कॉच की संयुक्त वार्षिक बिक्री में कितनी वृद्धि की होगी |
View SolutionThe given pie chart represents the popularity of ice-cream flavours in the year 2005 and 2015.
दिया गया पाई चार्ट वर्ष 2005 और 2015 में आइसक्रीम के स्वादों की लोकप्रियता को दर्शाता है ।
If a percentage point shift results in annual additional sales of Rs. 10,000. How much(in Rs.), did the combined annual strawberry and butterscotch sales increase from 2005 to 2015?
यदि प्रतिशत बिंदु में खिसकाव 10,000 रुपये की वार्षिक अतिरिक्त बिक्री का परिणाम देता है, तो 2005 से 2015 में स्ट्रॉबेरी और बटरस्कॉच की संयुक्त वार्षिक बिक्री में कितनी वृद्धि हुई है?
View SolutionA survey was carried out to find the favorite beverage preferred by a certain group of young people. The following pie chart shows the findings of this survey. From this pie chart answer the following:
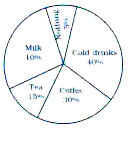
If 45 people like tea, how many people were surveyed?
View SolutionA prestigious company had called for candidates to be interviewed. Their data has been presented by the given Venn diagram. The circle represents MBA candidates from a reputed institution, the triangle represents candidates with an experience of more than10 years, the rectangle represents industrious candidates and the square represents candidates aged between 40 and 50 years. The numbers given in the diagram represent the number of persons of that particular category. The company has called for the final interview, only those candidates who meet all the above criteria. How many people have been called for the final interview?
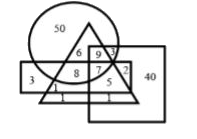
View Solution
