A survey was carried out to find the favorite beverage preferred by a certain group of young people. The following pie chart shows the findings of this survey. From this pie chart answer the following:
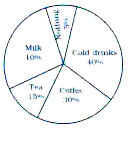
If 45 people like tea, how many people were surveyed?
Step by step video & image solution for A survey was carried out to find the favorite beverage preferred by a certain group of young people. The following pie chart shows the findings of this survey. From this pie chart answer the following: If 45 people like tea, how many people were surveyed? by Maths experts to help you in doubts & scoring excellent marks in Class 8 exams.
Updated on:21/07/2023Topper's Solved these Questions
- DATA HANDLINGBOOK - NCERT EXEMPLARCHAPTER - DATA HANDLINGEXERCISE - EXERCISE (True or False)
23 Videos
- COMPARING QUANTITIESBOOK - NCERT EXEMPLARCHAPTER - COMPARING QUANTITIESEXERCISE - Think and Discuss
2 Videos
- DIRECT AND INVERSE PROPORTIONS BOOK - NCERT EXEMPLARCHAPTER - DIRECT AND INVERSE PROPORTIONS EXERCISE - THINK AND DISCUSS
2 Videos
Similar Questions
A survey was carried out to find the favourite beverage preferred by a certain group of young people. The following pie chart shows the findings of this survey. From this pie chart answer the following:

Which type of beverage is liked by the maximum number of people.
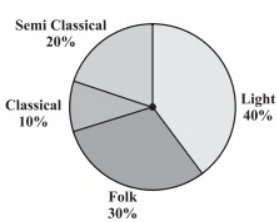
View SolutionA survey was made to find the type of music that a certain group of young people liked in a city.Adjoining pie chart shows the findings of this survey. From this pie chart answer the following:
(i) If 20 people liked classical music, how many young people were surveyed?
(ii) Which type of music is liked by the maximum number of people?
(iii) If a cassette company were to make 1000 CD’s, how many of each type would they make?
View Solution
Knowledge Check
Study the given information carefully and answer the questions based on it.
A survey was made to find the type of music that a certain group of young people liked in a city. Following pie chart shows the findings of this survey.

If 20 people liked classical music, how many young people were surveyed?A100B250C150D200Study the given information carefully and answer the questions based on it.
A survey was made to find the type of music that a certain group of young people liked in a city. Following pie chart shows the findings of this survey.

If total number of young people in that group is 1000, then how many of them like folk music?A120B90C100D300Study the given information carefully and answer the questions based on it.
A survey was made to find the type of music that a certain group of young people liked in a city. Following pie chart shows the findings of this survey.

Which type of music is liked by the maxinum number of peoples?ALightBClassicalCFolkDSemi-classical
The given pie chart shows favorite shows of student of a school
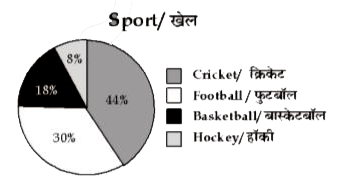
In the given pie chart, if there were 1280 students in all, how many liked football
View SolutionThe given pie-chart shows favourite sport of students of a school.
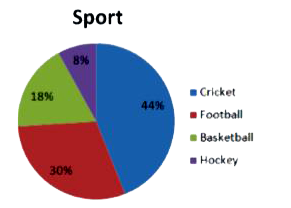
In the given pie-chart, if there were 1280 students in all, how many liked football?
View SolutionThe given pie chart shows favorite sport of students of A school
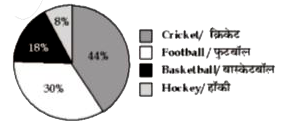
In the given pie chart if the school strength was 2500 how many liked cricket more than hockey?
View SolutionStudy the given information carefully and answer the questions based on it.
A survey was made to find the type of music that a certain group of young people liked in a city
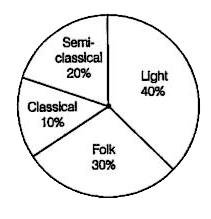
If 20 people liked classical music, then how many young people were surveyed?
View SolutionThe pie chart shows the result of an online survey which asked people about their favourite game. Study the diagram and answer the following questions.
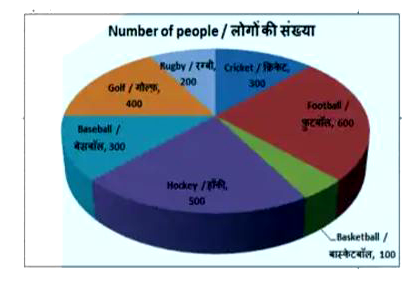
Which game is the favourite of most people surveyed?
View Solution
