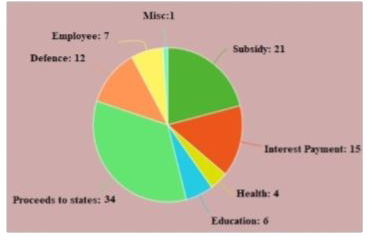
The following pie chart shows percentage expenditure of a country on different heads. The total expenditure in Rs. 1,680(in billion). Study the chart and answer the question.
निम्नलिखित पाई चार्ट अलग-अलग प्रमुखों पर किसी देश का प्रतिशत व्यय दर्शाता है। 1,680 (बिलियन में) कुल खर्च। चार्ट का अध्ययन करें और प्रश्न का उत्तर दें।
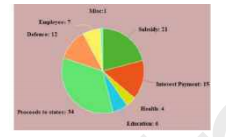 The expenditure for proceeds to state (in billion ₹) is:
571.2
126
684
586.5
Step by step video & image solution for The following pie chart shows percentage expenditure of a country on different heads. The total expenditure in Rs. 1,680(in billion). Study the chart and answer the question. निम्नलिखित पाई चार्ट अलग-अलग प्रमुखों पर किसी देश का प्रतिशत व्यय दर्शाता है। 1,680 (बिलियन में) कुल खर्च। चार्ट का अध्ययन करें और प्रश्न का उत्तर दें। The expenditure for proceeds to state (in billion ₹) is: by Maths experts to help you in doubts & scoring excellent marks in Class 14 exams.
Updated on:21/07/2023Topper's Solved these Questions
Similar Questions
The following pie chart shows percentage expenditure of a country on different heads. The total expenditure in Rs. 1,680(in billion). Study the chart and answer the question.
निम्नलिखित पाई चार्ट अलग-अलग प्रमुखों पर किसी देश का प्रतिशत व्यय दर्शाता है। 1,680 (बिलियन में) कुल खर्च। चार्ट का अध्ययन करें और प्रश्न का उत्तर दें।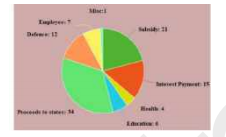
The expenditure on Education is what percentage less than the expenditure on defence ?
शिक्षा पर व्यय रक्षा पर व्यय से कितना प्रतिशत कम है |
View SolutionThe following pie chart shows percentage expenditure of a country on different heads. The total expenditure in Rs. 1,680(in billion). Study the chart and answer the question.
निम्नलिखित पाई चार्ट अलग-अलग प्रमुखों पर किसी देश का प्रतिशत व्यय दर्शाता है। 1,680 (बिलियन में) कुल खर्च। चार्ट का अध्ययन करें और प्रश्न का उत्तर दें।
The central angle of the sector representing expenditure on interest payment is:
ब्याज भुगतान पर व्यय का प्रतिनिधित्व करने वाले क्षेत्र का केंद्रीय कोण है
View Solution
Knowledge Check
The following pie chart shows percentage expenditure of a country on different heads .The total expenditure is Rs. 1,680 (in billions).Study the chart and answer the question.
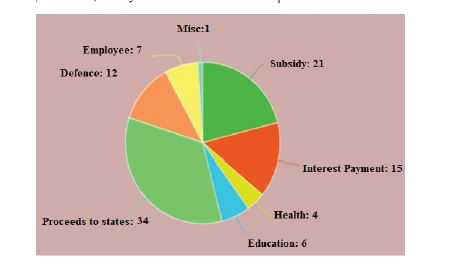
The central angle of the sector representing expenditure on Subsidy is :A75.6∘B108.3∘C90∘D54.9∘The following pie chart shows percentage expenditure of a country on different heads .The total expenditure is Rs. 1,680 (in billions).Study the chart and answer the question.
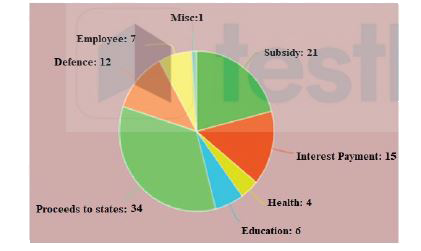
The total amount of expenditure for education and Health (in billions Rs. )is:Aa)84Bb)168Cc)126Dd)186The following pie chart shows percentage expenditure of a country on different heads. The total expenditure is Rs. 1,680 (in billions). Study the chart and answer the question.
The expenditure on Education is what percentage less than the espenditure on Defence ?A150%B125%C100%D50%
The following pie chart shows percentage expenditure of a country on different heads. The total expenditure is Rs.1,680 (in billions). Study the chart and answer the questions
निम्नलिखित पाई चार्ट अलग-अलग प्रमुखों पर किसी देश का प्रतिशत व्यय दर्शाता है। कुल खर्च रु1,680 (अरबों में)। चार्ट का अध्ययन करें और प्रश्नों का उत्तर दें | The central angle of the sector representing expenditure on subsidy is :
सब्सिडी पर व्यय का प्रतिनिधित्व करने वाले क्षेत्र का केंद्रीय कोण ज्ञात करे |
View SolutionThe following pie chart shows the monthly expenditure incurred by a family on various items, and their savings. Study the chart and answer the question that follows
निम्नलिखित पाई चार्ट विभिन्न मदों पर एक परिवार द्वारा किए गए मासिक खर्च और उनकी बचत को दर्शाता है। चार्ट का अध्ययन करें और फिर पूछे गए प्रश्न का उत्तर दें।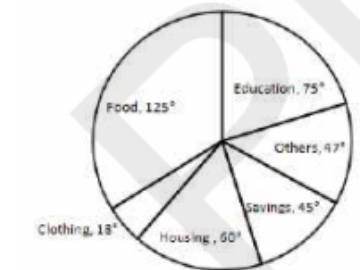
If the expenditure on education is 2,700 more than that on housing, then the total expenditure on food and clothings is:
यदि शिक्षा पर खर्च आवास से ₹2,700 अधिक है, तो भोजन और कपड़े पर कुल खर्च ज्ञात करे।
View SolutionThe following pie chart shows the monthly expenditure incurred by a family on various items, and their savings. Study the chart and answer the question that follows
निम्नलिखित पाई चार्ट विभिन्न मदों पर एक परिवार द्वारा किए गए मासिक खर्च और उनकी बचत को दर्शाता है। चार्ट का अध्ययन करें और फिर पूछे गए प्रश्न का उत्तर दें। If the monthly income is ₹64,800, then the yearly savings are:
यदि मासिक आय ₹64,800 है, तो वार्षिक बचत होती है:
View SolutionThe given pie-chart, shows the percentage distribution of the expenditure incurred in publishing a book. Study the pie-chart and the answer the question based on it. /
दिया गया पाई चार्ट किसी पुस्तक के प्रकाशन में हुए व्ययों के प्रतिशत वितरण को दर्शाता है | इस पाई चार्ट का अध्ययन करें तथा इस पर आधारित प्रश्न का उत्तर दें | In the given pie-chart, by what percentage the Royalty on the book is less than the Printing cost? /
दिए गए पाई चार्ट के अनुसार, इस पुस्तक पर रॉयल्टी प्रकाशन की लागत से कितना प्रतिशत कम है ?
View SolutionThe following pie chart shows percentage expenditure of a country on different heads .The total expenditure is Rs. 1.680 (in billions ). Study chart and answer the question .
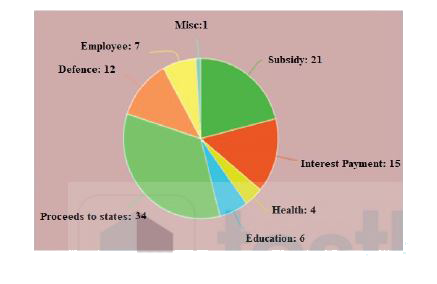
The amount of expenditure on Defence is what percentage more than the expenditure on Education ?
View Solution
