Study the given histogram that shows the marks obtained by students in an examination and answer the question that follows:
दिए गए हिस्टोग्राम का अध्ययन करें जो एक परीक्षा में छात्रों द्वारा प्राप्त किए गए अंकों को दिखाता है और निम्न प्रश्न का उत्तर दे|
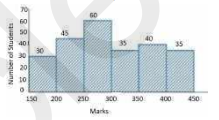 If the total marks obtained by students be represented as a pie chart, then the central angle of thesector representing marks 200 or more but less than 300, is :(correct to one decimal place)
यदि छात्रों द्वारा प्राप्त कुल अंकों को पाई चार्ट के रूप में दर्शाया जाता है, तो 200 या अधिक और 300 से कम अंकों का प्रतिनिधित्व करने वाले क्षेत्र का केंद्रीय कोण है: (एक दशमलव स्थान के लिए सही)
68∘
88∘
154∘
128∘
Step by step video & image solution for Study the given histogram that shows the marks obtained by students in an examination and answer the question that follows: दिए गए हिस्टोग्राम का अध्ययन करें जो एक परीक्षा में छात्रों द्वारा प्राप्त किए गए अंकों को दिखाता है और निम्न प्रश्न का उत्तर दे| If the total marks obtained by students be represented as a pie chart, then the central angle of thesector representing marks 200 or more but less than 300, is :(correct to one decimal place) यदि छात्रों द्वारा प्राप्त कुल अंकों को पाई चार्ट के रूप में दर्शाया जाता है, तो 200 या अधिक और 300 से कम अंकों का प्रतिनिधित्व करने वाले क्षेत्र का केंद्रीय कोण है: (एक दशमलव स्थान के लिए सही) by Maths experts to help you in doubts & scoring excellent marks in Class 14 exams.
Updated on:21/07/2023Topper's Solved these Questions
Similar Questions
Study the given histogram that shows the marks obtained by students in an examination and answer the question that follows:
दिए गए हिस्टोग्राम का अध्ययन करें जो एक परीक्षा में छात्रों द्वारा प्राप्त किए गए अंकों को दिखाता है और निम्न प्रश्न का उत्तर दे|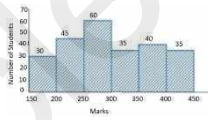 The number of students who obtained less than 200 marks is:
200 से कम अंक प्राप्त करने वाले छात्रों की संख्या है:
View SolutionStudy the given histogram that shows the marks obtained by students in an examination and answer the question that follows:
दिए गए हिस्टोग्राम का अध्ययन करें जो एक परीक्षा में छात्रों द्वारा प्राप्त किए गए अंकों को दिखाता है और निम्न प्रश्न का उत्तर दे|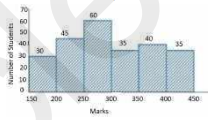 The number of students who obtained less than 250 marks is what percent more than the number of student who obtained 400 or more marks ?(correct to one decimal place)
250 से कम अंक प्राप्त करने वाले छात्रों की संख्या 490 या अधिक अंक प्राप्त करने वाले छात्र की संख्या से कितने प्रतिशत अधिक है? (एक दशमलव तक)
View Solution
Knowledge Check
Study the given histogram that shows the marks obtained by students in examination and answer the question that follows
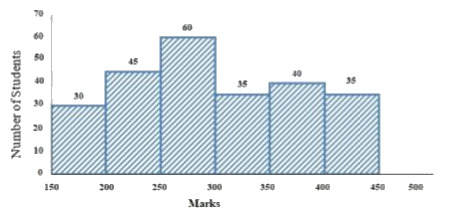
The number of students who obtained less than 200 marks is :AA)45BB)135CC)30DD)75Study the given histogram that shows the marks obtained by students in an examination and answer the question that follows .
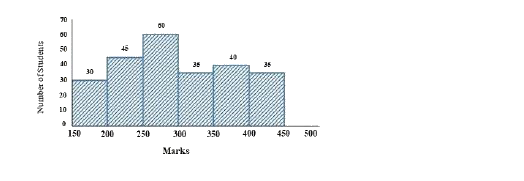
The number of students who obtained less than 250 marks is :A135B75C30D45Study the given histogram that shows the marks obtained by students in a examination and answer the question that follows.
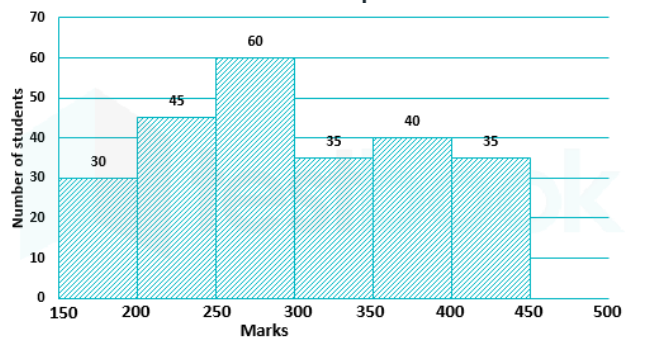
If the total marks obtained by students be represented as a pie chart, then the central angle of the sector representing marks 200 or more but less than 300, is :
(correct to the nearest degree)A154∘B128∘C68∘D88∘
Study the given histogram that shows the marks obtained by students in an examination and answer the questions that follow
दिए गए हिस्टोग्राम का अध्ययन करें जो एक परीक्षा में छात्रों द्वारा प्राप्त किए गए अंकों को दिखाता है और आने वाले प्रश्नों का उत्तर ज्ञात करे|
The number of students who obtained less than 350 marks is what percent more than the number of students who obtained 400 or more marks?(correct to one decimal place )
350 से कम अंक प्राप्त करने वाले छात्रों की संख्या 400 या अधिक अंक प्राप्त करने वाले छात्रों की संख्या की तुलना में प्रतिशत अधिक है| (एक दशमलव स्थान तक )
View SolutionThe given pie chart shows the marks obtained in an examination by a student (in degrees). Observe the pie chart and answer the question that follows:
दिया गया पाई चार्ट एक छात्र द्वारा परीक्षा में प्राप्त अंकों (डिग्री में) को दर्शाता है। पाई चार्ट का निरीक्षण करें और निम्न प्रश्न का उत्तर दें: If the total marks are 720, then the marks obtained in English is what percentage of the marks obtained in Maths?
यदि कुल अंक 720 हैं, तो अंग्रेजी में प्राप्त अंक गणित में प्राप्त अंकों का कितना प्रतिशत है?
View SolutionThe given pie chart shows the marks obtained in an examination by a student (in degrees). Observe the pie chart and answer the question that follows:
दिया गया पाई चार्ट एक छात्र द्वारा परीक्षा में प्राप्त अंकों (डिग्री में) को दर्शाता है। पाई चार्ट का निरीक्षण करें और निम्न प्रश्न का उत्तर दें: If total marks are 720, then the marks obtained in Chemistry, Biology and Maths together is what percentage of the total marks?
यदि कुल अंक 720 हैं, तो रसायन विज्ञान, जीव विज्ञान और गणित में प्राप्त अंक कुल अंकों का कितना प्रतिशत है?
View SolutionIn the given histogram, what is the mean marks of the students, correct to one decimal place?
दिए गए आयतचित्र के अनुसार एक दशमलव स्थान तक छात्रों का माध्य अंक क्या है ?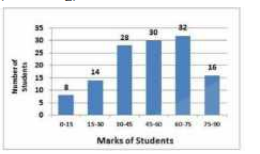
View SolutionStudy the given histogram that shows the marks obtained by students in an examination and examination and answer the question that follows .
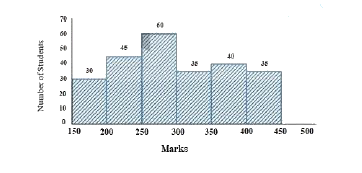
If the total marks obtained by students be represented as a pie chart ,then the central angle corresponding to marks 250 or more but less than 300 is :
(correct to the nearest degree)
View Solution
