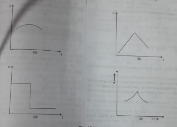
A train whistling at constant frequency is moving towards a station at a constant speed V. The train goes past a stationary observer on the station. The frequency n' of the sound as heard by the observer is plotted as a function of time t (shown in the figure). Identical the expected curve.
 Solution in Punjabi
Step by step video & image solution for A train whistling at constant frequency is moving towards a station at a constant speed V. The train goes past a stationary observer on the station. The frequency n' of the sound as heard by the observer is plotted as a function of time t (shown in the figure). Identical the expected curve. by Physics experts to help you in doubts & scoring excellent marks in Class 11 exams.
Updated on:21/07/2023Topper's Solved these Questions
Similar Questions
Can mechanical waves travel through vacuum?
View SolutionDefine unit
View SolutionWhat is the work done in holding a 15 kg suitcase whiel waiting for a bus for 15 mimnutes?
View SolutionAn observer standing at station observes frequency 219 Hz when a train approaches and 184 Hz when train goes away from him. If velocity of sound in air is 340m//s , then velocity of train and actual frequency of whistle will be
View SolutionA train whistling at constant frequency is moving towards a station at a constant speed V. The train goes past a stationary observer on the station. The frequency n^(') of the sound as heard by the observer is plotted as a function of time t, figure. Identify the expected curve.
View SolutionA railway engine whistling at a constant frequency moves with a constant speed. It goes past a stationary observer standing beside the railway track. The frequency (n) of the sound heard by the observer is plotted agains time (t) . Which of the following best represents the resulting curve?
View SolutionA sound source, emitting sound of constant frequency, moves with a constant speed and crosses a stationary observer. The frequency (n) of sound heard by the observer is plotted against time (t). Which of the following graphs represents the correct variation :-
View SolutionA train is moving at a speed of 72 kmph towards a station sounding a whistle of frequency 640Hz. What is the apparent frequency of the whistle as heard by a man standing on the platform when train approaches towards him.
View SolutionA train whistling at constant frequency 'n' is moving towards a station at a constant speed V. The train goes past a stationary observr on the station . The frequecy 'n' of the sound as heard by the observe is plotted as function of time 't' . Identify the correct curve .
View SolutionA train in approaching a station with a uniform velocity of 72kmph and the frequency of the whistle of that train is 480Hz . The apparent increase in the frequency of that whistle heard by a stationary observer on the platform is (Velocity of sound in air is 340m//s )
View SolutionA railway engine whistiling at a constant frequency moves with a constant speed. It goes past a stationary observer beside the railyway track. Which of the following graphs best represent the variation of frequnecy of the sound (n) heard by the observer with the time (t) ?
View Solutionनियत आवृत्ति की सीटी बजाती हुई पक रेलगाड़ी अचर वेग से स्टेशन की ओर जा रही है। रेलगाड़ी स्टेशन पर एक स्थिर प्रेक्षक के पास से गुजरती है। प्रेक्षक द्वारा सुनी गई ध्वनि की आवृत्ति n' का समय t के फलन के रूप में ग्राफ बनाया गया अपेक्षित वक्र को पहचानिए।
View Solutionनियत आवृत्ति पर सीटी बजाती हुई रेलगाड़ी नियत चाल v से स्टेशन की ओर जा रही है। रेलगाड़ी स्टेशन पर स्थायी प्रेक्षक के पास गुजरकर निकल जाती है। यदि प्रेक्षक के द्वारा सुनी गई ध्वनि की आवृत्ति n को समय t के फलन के रूप में आरेखित किया जाता है, तो सम्भावित वक्र को पहचानिए।
View SolutionA train whistling at constant frequency is moving towards a station at a constant speed V. The train goes past a stationary observer on the station. The frequency n′ of the sound as heard by the observer is plotted as a function of time t, figure. Identify the expected curve.
View SolutionA train whistling at constant frequency is moving towards a station at a constant speed V. The train goes past a stationary observer on the station. The frequency n′ of the sound as heard by the observer is plotted as a function of time t, figure. Identify the expected curve.
View SolutionIf the temperature is increased in semi-conductors such that the resistance incessantly falls, it is termed as.
View Solution
