The graph below shows V-p curve for three processes. Choose the correct statement(s) :

Work done is maximum in process 1 .
Temperature must increase in process 2 & 3 .
Heat must be supplied in process 1.
If final volume of gas in process 1,2 and 3 are same then temperature must be same.
The correct Answer is:A, C
Area P−V curve and volume axis represent work.
Internal energy in 1 decreases (expansion at constant pressure)
In process 2 and 3 internal energy may decreased depending on the process .
Since final pressure of 1,2 & 3 are different, final temperature must also be different.
Topper's Solved these Questions
- GEOMETRICAL OPTICSBOOK - ALLEN CHAPTER - GEOMETRICAL OPTICSEXERCISE - EXERCISE -01
65 Videos
- GEOMETRICAL OPTICSBOOK - ALLEN CHAPTER - GEOMETRICAL OPTICSEXERCISE - EXERCISE -02
82 Videos
- GEOMETRICAL OPTICSBOOK - ALLEN CHAPTER - GEOMETRICAL OPTICSEXERCISE - subjective
14 Videos
- CURRENT ELECTRICITYBOOK - ALLEN CHAPTER - CURRENT ELECTRICITYEXERCISE - EX.II
66 Videos
- GRAVITATIONBOOK - ALLEN CHAPTER - GRAVITATIONEXERCISE - EXERCISE 4
9 Videos
Similar Questions
Knowledge Check
The curve C is for the gas X at 273 K.Choose the correct statement (s).
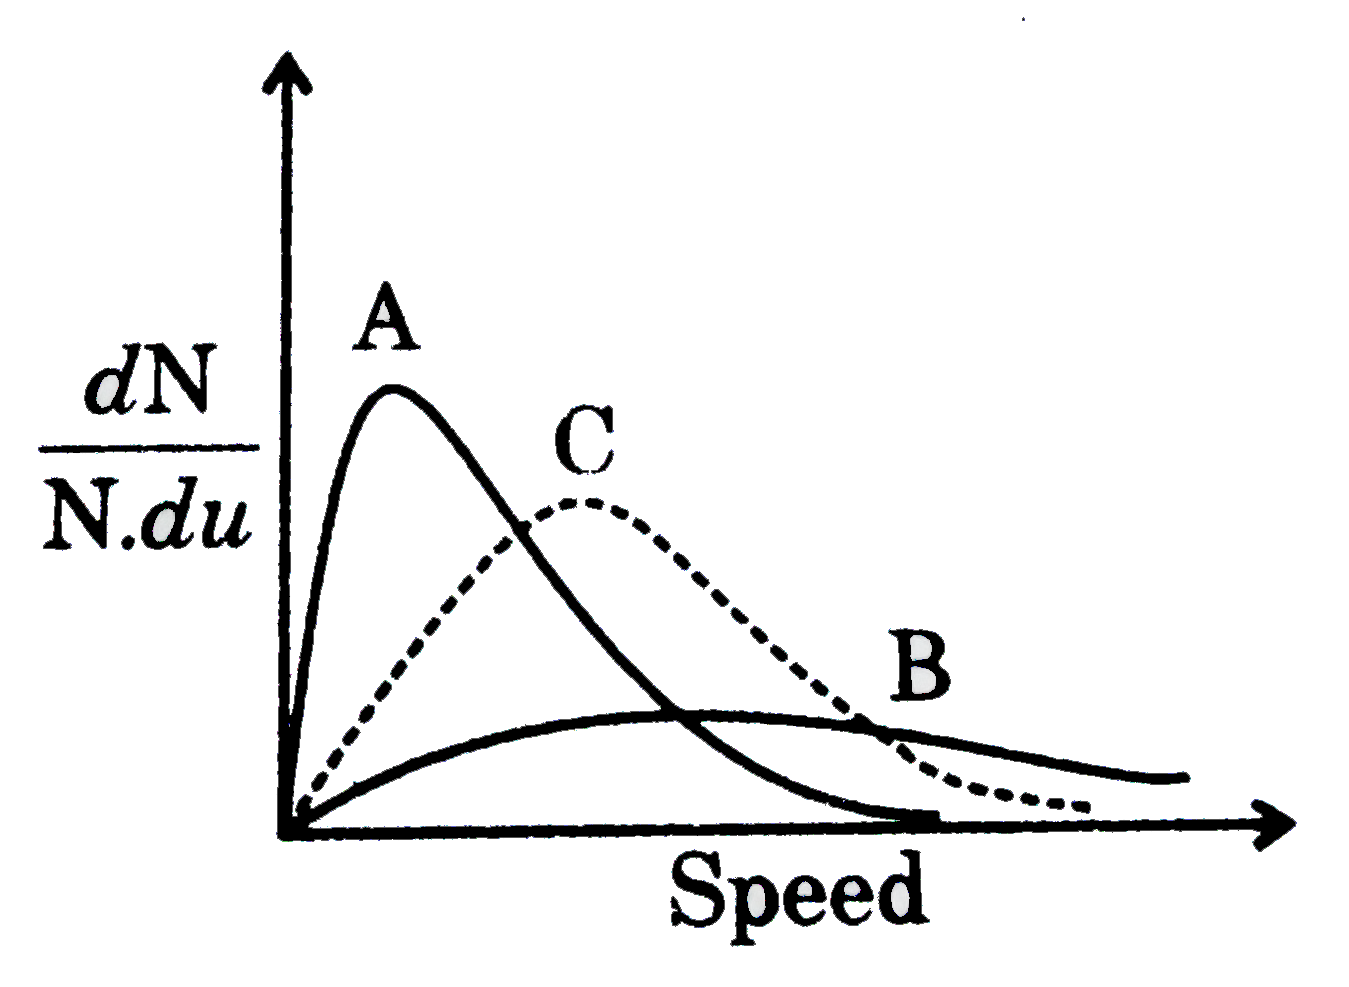 ACurve A may be of a heavier gas but at same temperatureBCurve B may be of the same gas but at 373 KCCurve A may be of the same gas but at 373 KDCurve B may be of the lighter gas but at same temperature.
With respect to the compounds I−V, choose the correct statement(s).
 AThe acidity of compound I is due to delocalization in the conjugate base.BThe conjugate base of compound IV is aromaticCCompound II becomes more acidic, when it has a −NO2 substitutent.DThe acidity of compounds follows the order I>IV>V>II>III.
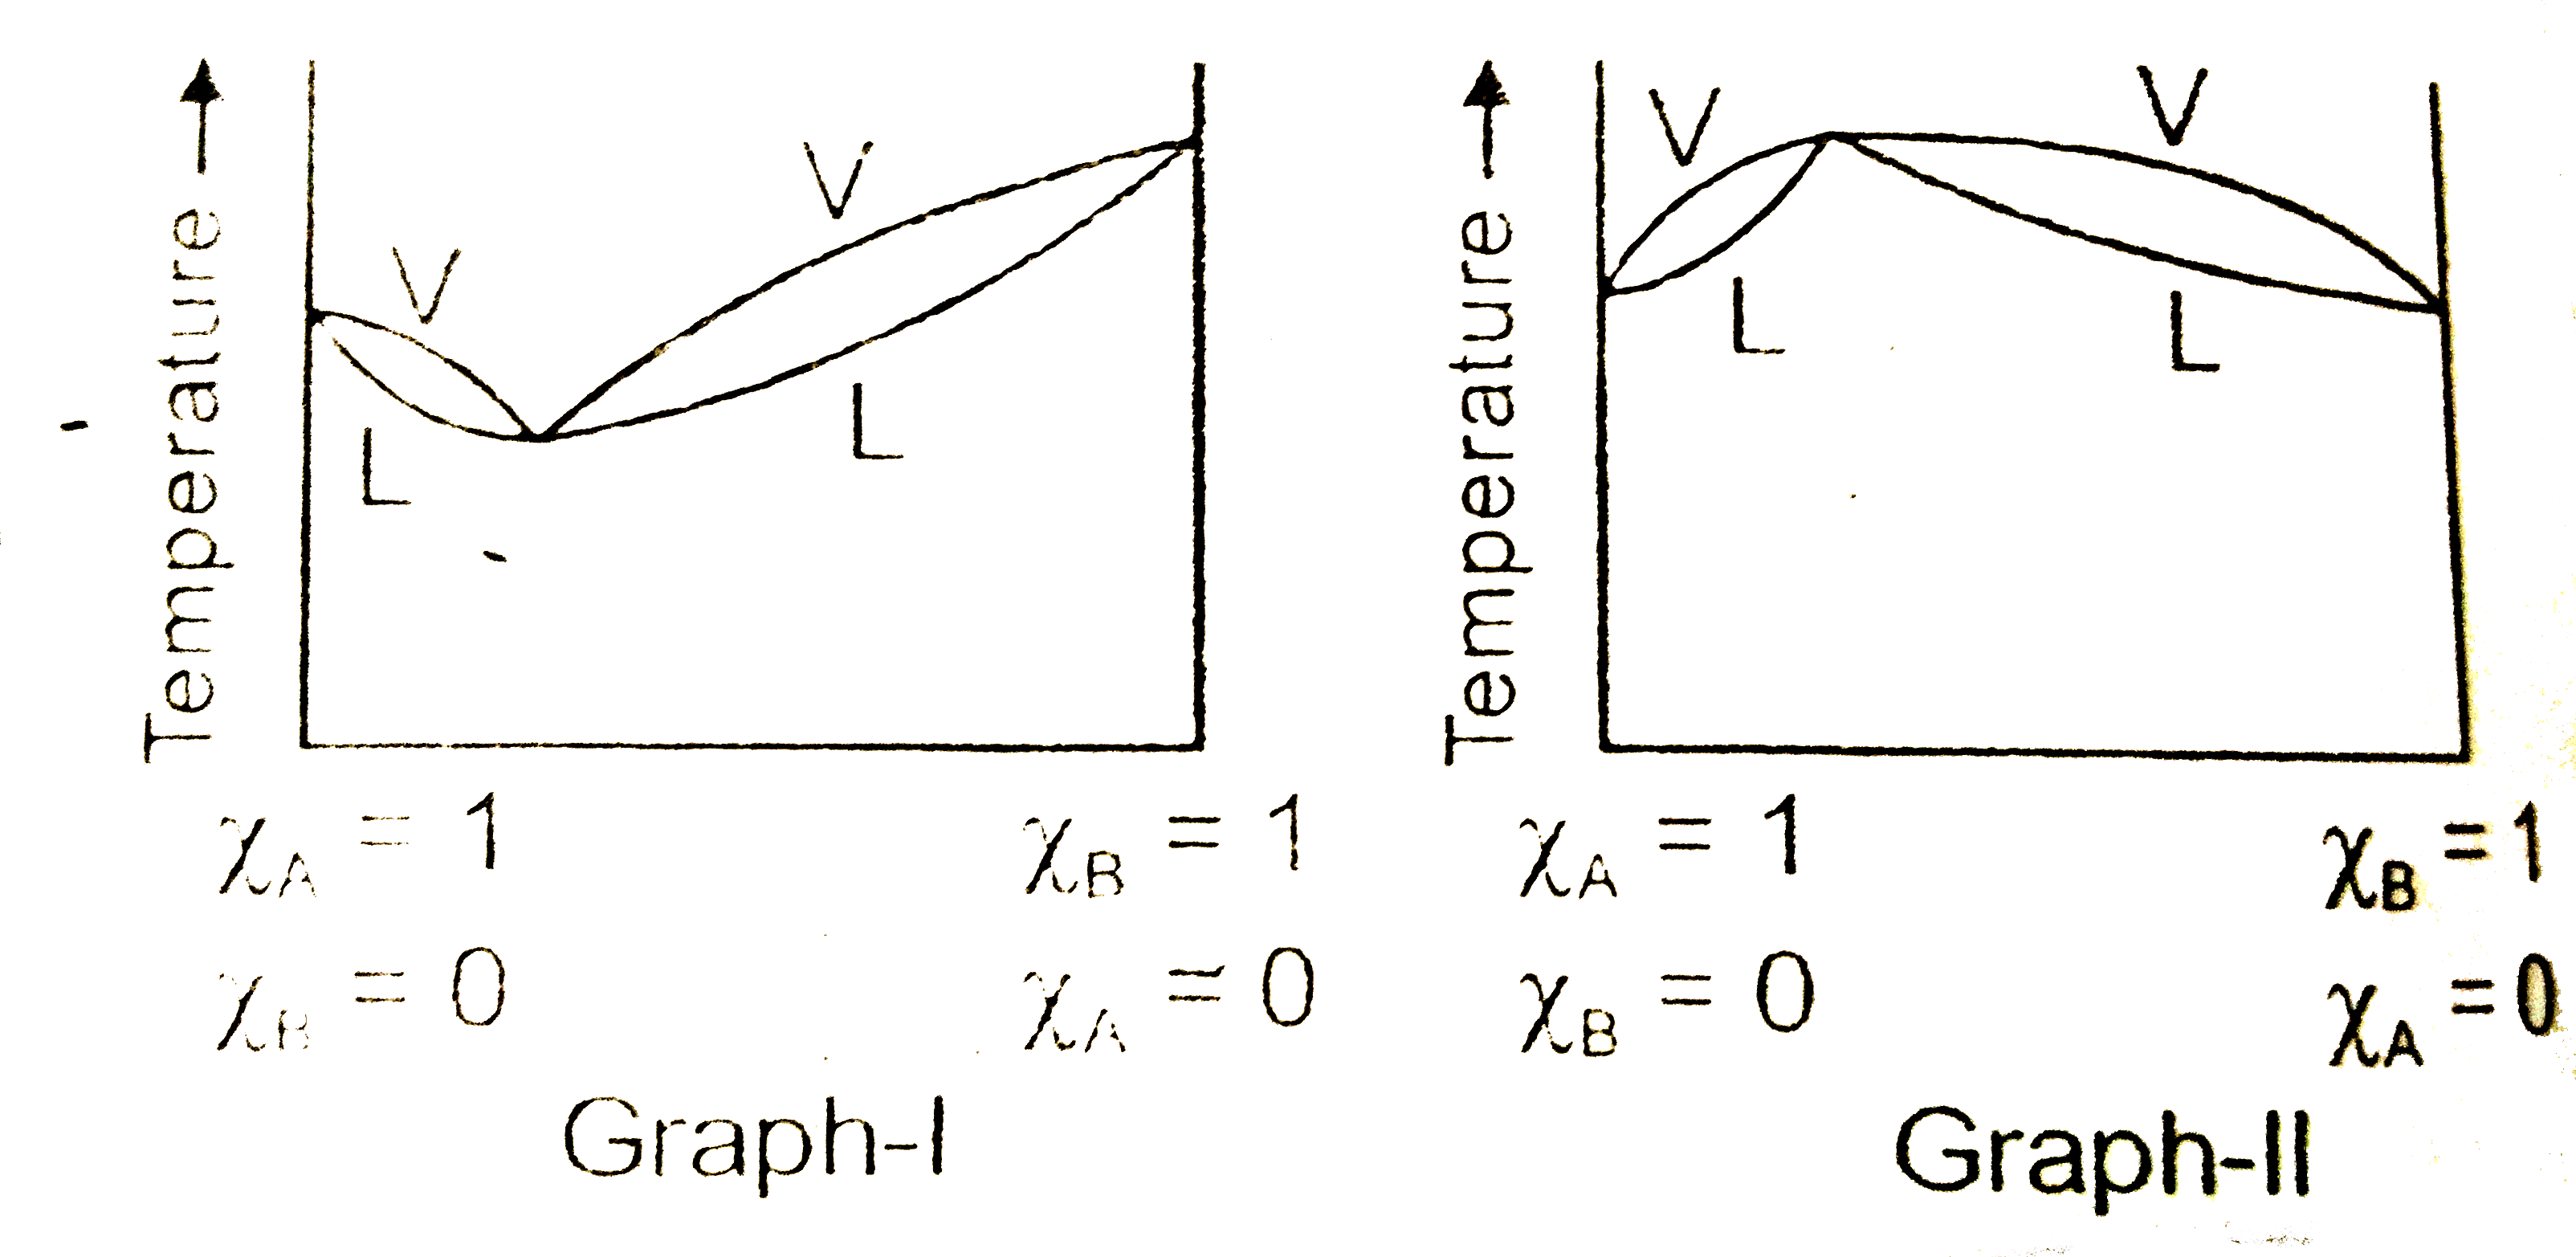
Consider the following graphs
 Choose the correct statementsAAccording to both graphs mole fraction of A > mole fraction of B in condensateBGraph I belogs to minimum boiling azotropeCGraph II belongs to maximum boiling azetropeDGraph II belogs to mininum boiling azeotrope while graph I bellngs to minimum boiling azeotrope.
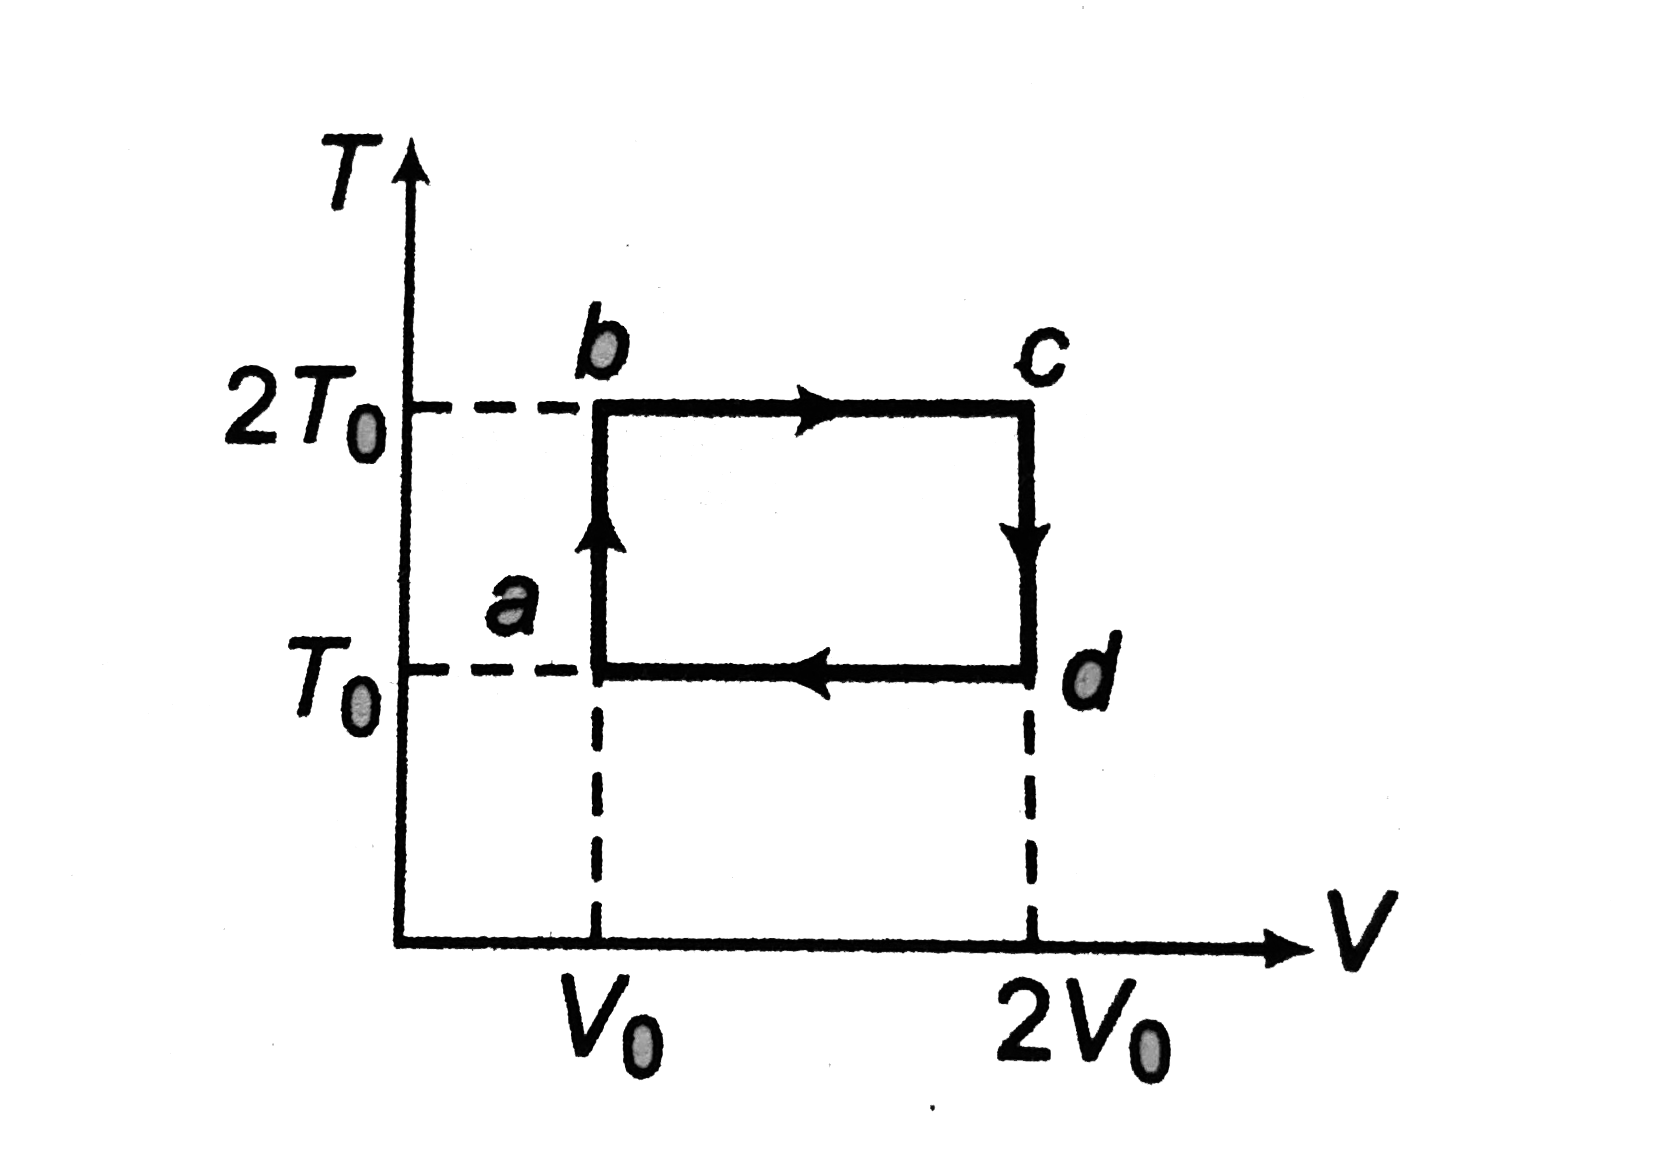
T-V diagram of two moles of a monoatomic gas is as shown in figure.
For the process abcda choose the correct options given below
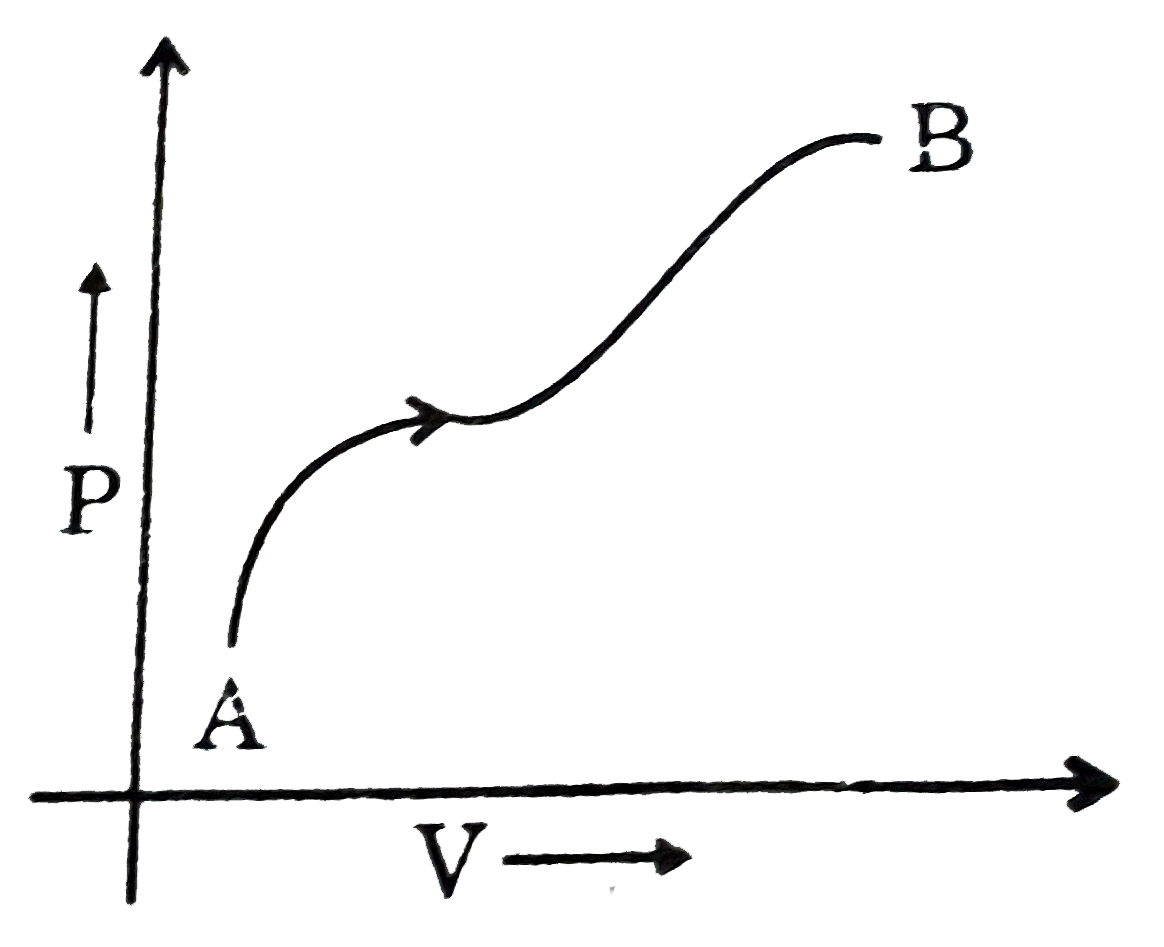
View SolutionThe graph given below shows the P-V plot for a process on an ideal gas. Select the correct statement.
View SolutionThe shows a radiant energy spectrum graph for a black body at at temperature T
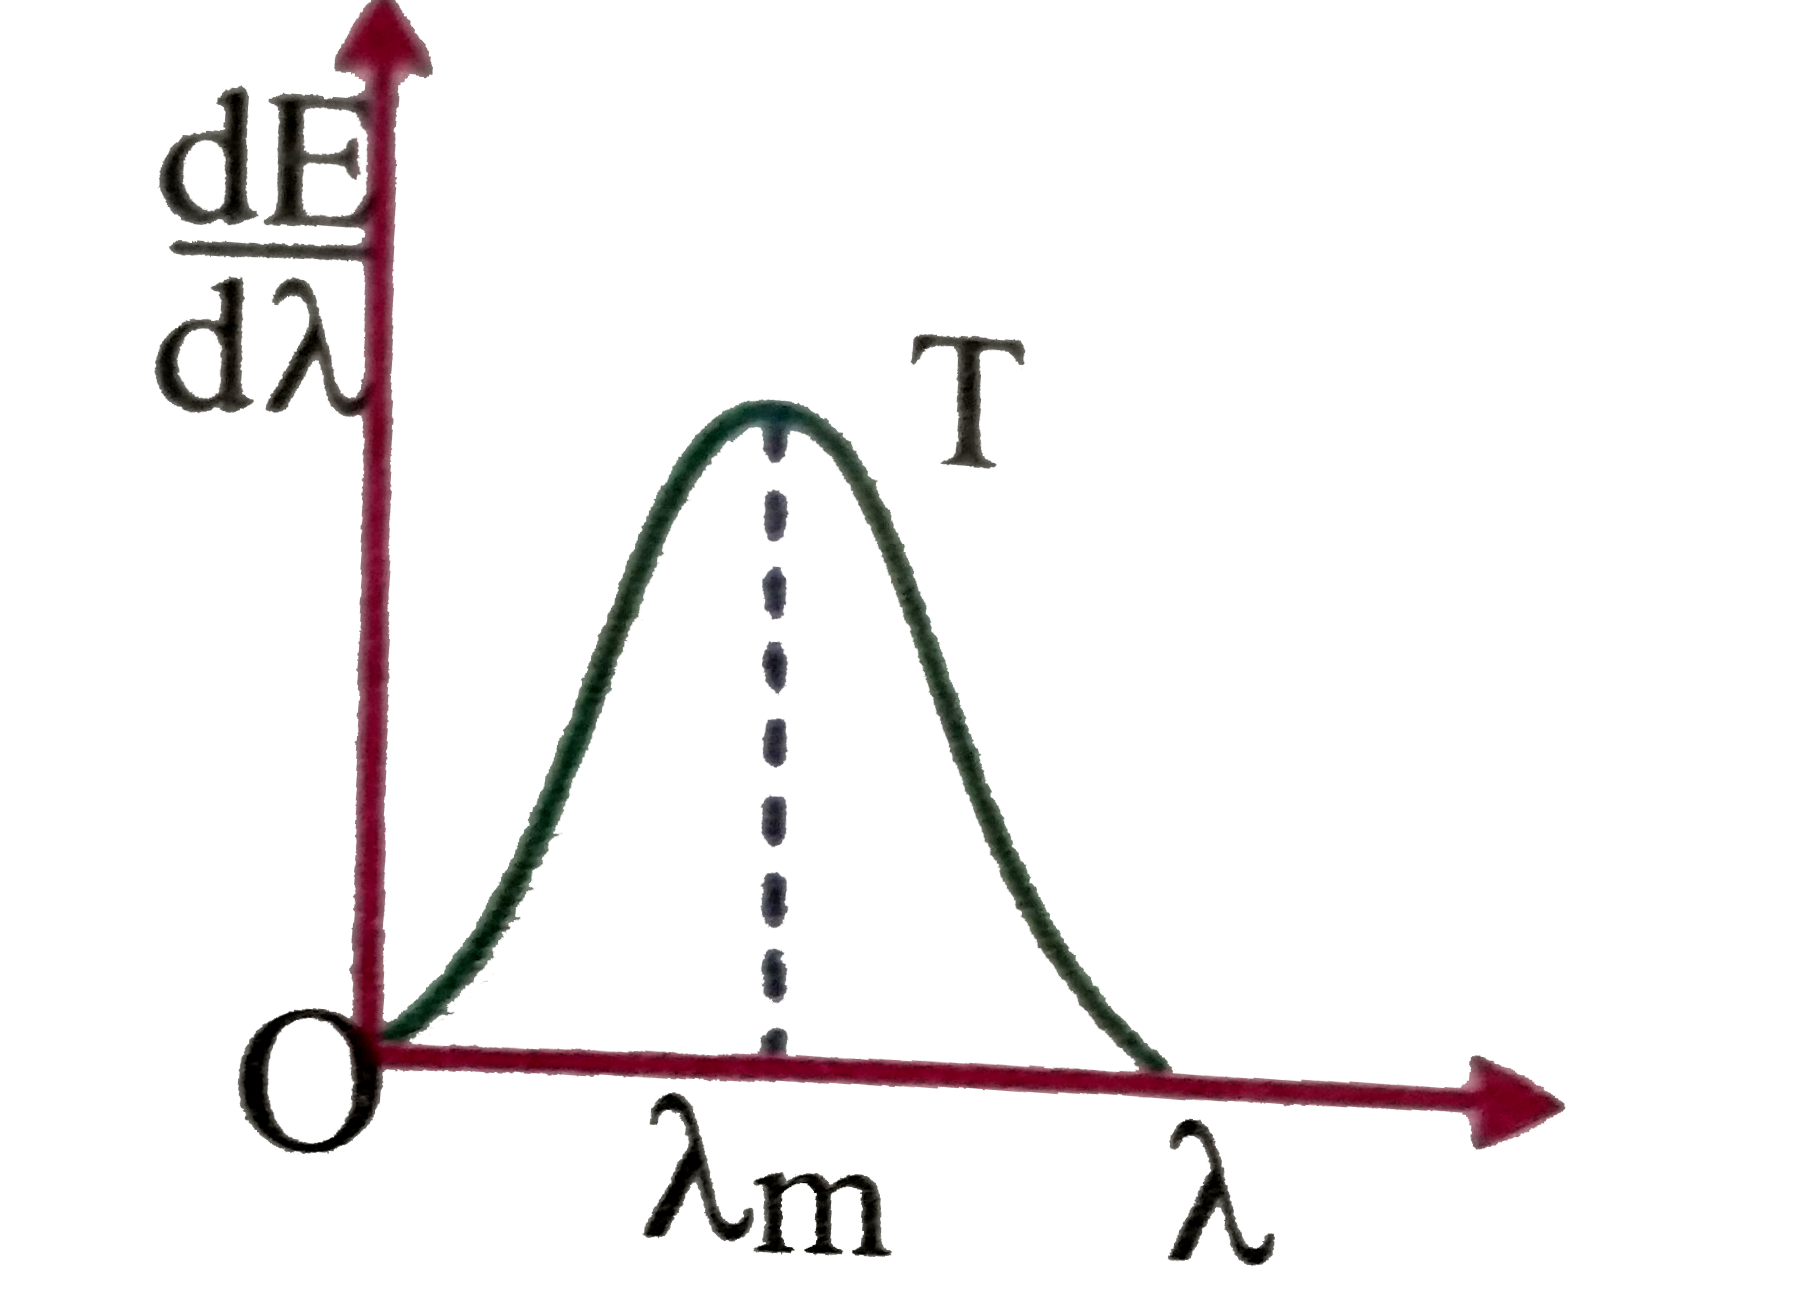
Choose the correct statements (s) .
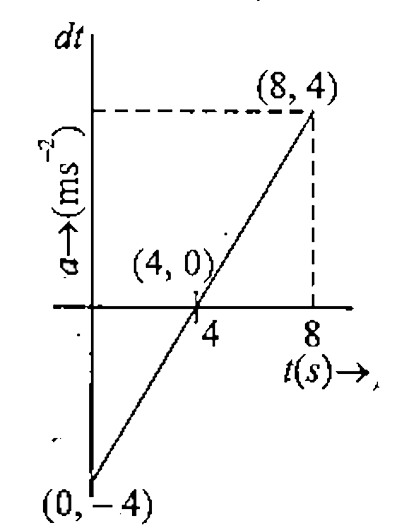
View SolutionIf a particle is moving along a straight line and following is the graph showing acceleration varying with time then choose correct statement(s). At t=0,x=0 and v0=7ms−1
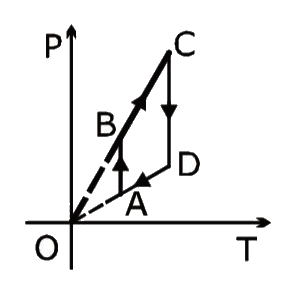
View SolutionA P-T graph is shown for a cyclic process. Select correct statement regarding this
View Solution

