The graph given below shows the P-V plot for a process on an ideal gas. Select the correct statement.
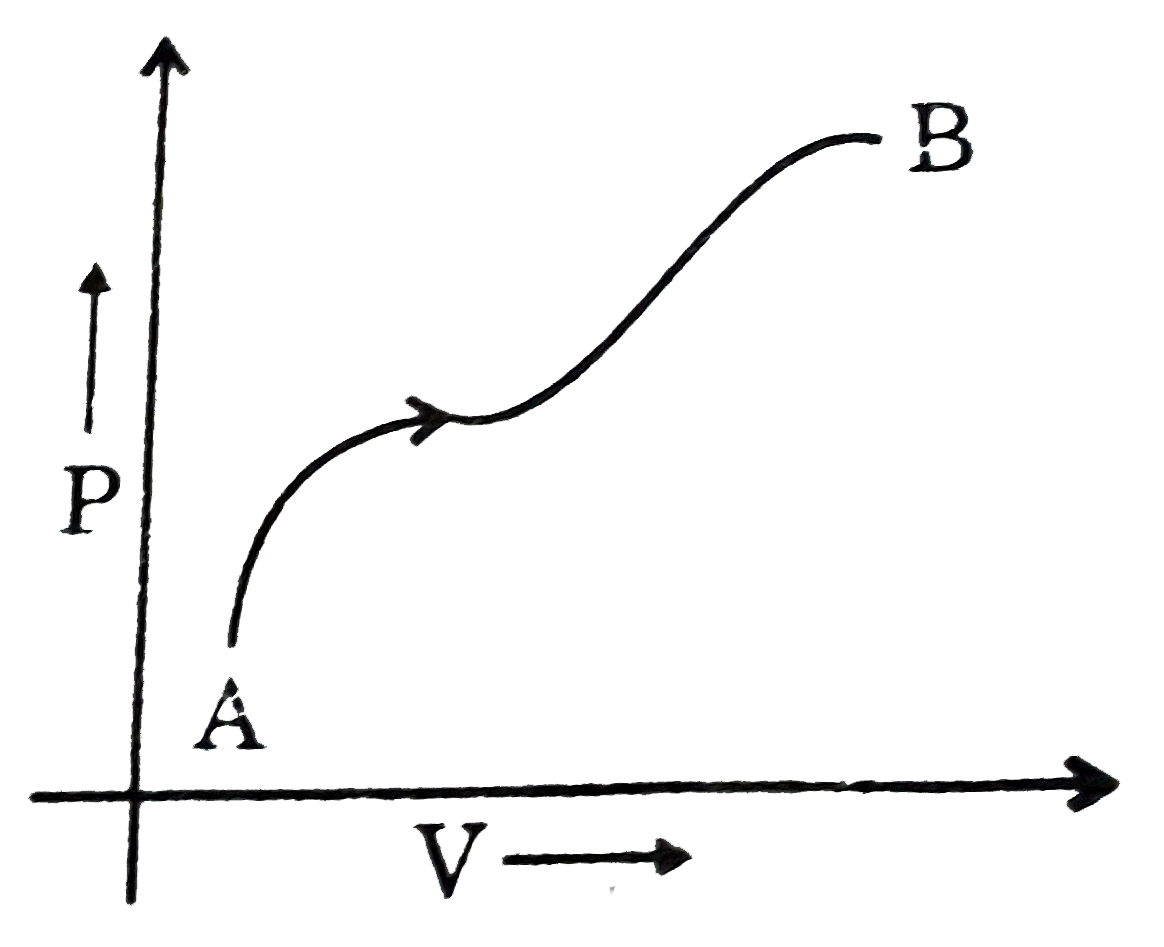
Enthalpy content of the gas is constantly increasing and the process is carried out slowly
Enthalpy content of the gas first increases then decreases and the process is quasistaticly
Enthalpy content of the gas is constant and the process taken infinite amount of time for completion
Enthalpy content first decreases then increases and the process is reversible
The correct Answer is:A
Step by step video, text & image solution for The graph given below shows the P-V plot for a process on an ideal gas. Select the correct statement. by Chemistry experts to help you in doubts & scoring excellent marks in Class 12 exams.
Topper's Solved these Questions
- BOOK - GRB PUBLICATIONCHAPTER - GRAPHICAL INTERPRETATIONEXERCISE - B. Gaseous State1videos
GRAPHICAL INTERPRETATION
- BOOK - GRB PUBLICATIONCHAPTER - GRAPHICAL INTERPRETATIONEXERCISE - Gaseous State39videos
GRAPHICAL INTERPRETATION
- BOOK - GRB PUBLICATIONCHAPTER - GRAPHICAL INTERPRETATIONEXERCISE - Subjective Type23videos
GRAPHICAL INTERPRETATION
- BOOK - GRB PUBLICATIONCHAPTER - F-BLOCK ELEMENTSEXERCISE - Subjective type7videos
F-BLOCK ELEMENTS
- BOOK - GRB PUBLICATIONCHAPTER - HYDROCARBON (ALIPHATIC)EXERCISE - Previous years jee questions28videos
HYDROCARBON (ALIPHATIC)
Similar Questions
Knowledge Check
- Question 1 - Select One
The P-T graph, as given below, was observed for a process on an ideal gas. Which of the statement is true ?
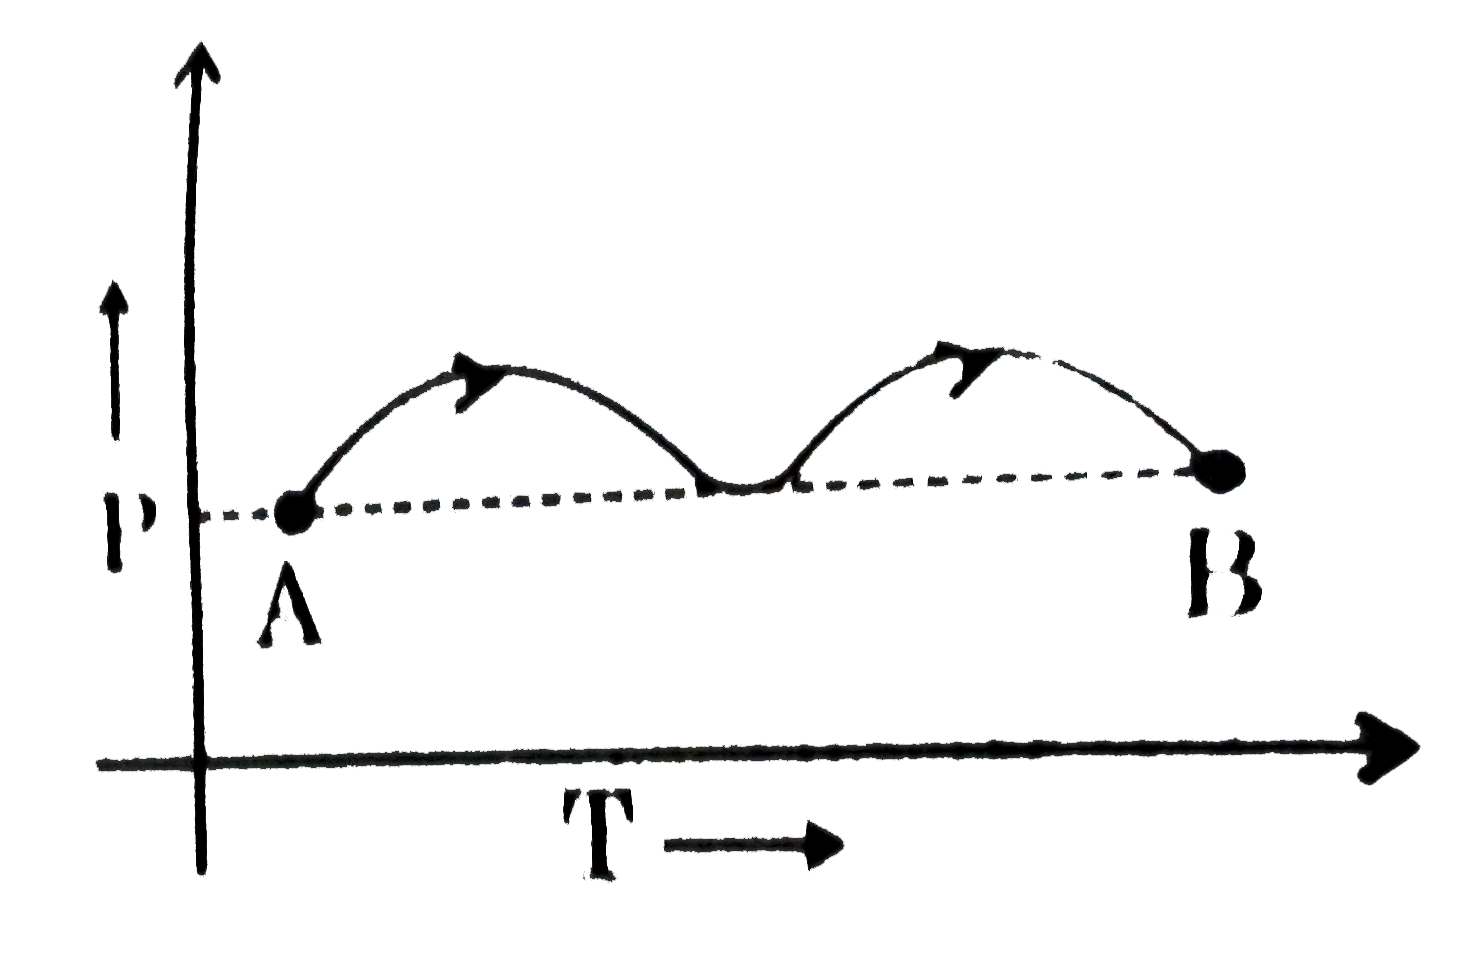 Aw=+ve,ΔH=(+)veBw=(−)ve,ΔH=(−)veCw=(−)ve,ΔH=(+)veDw=(+)ve,ΔH=(−)ve
 - Question 2 - Select One
The P-T graph, as given below, was observed for a process on an ideal gas. Which of the statement is true ?
 Aw=+ve,ΔH=+veBw=−ve,ΔH=−veCw=−ve,ΔH=+veDw=+ve,ΔH=−ve
 - Question 3 - Select One or More
The graph below shows V-p curve for three processes. Choose the correct statement(s) :
 AWork done is maximum in process 1BTemperature must increase in process 2 and 3CHeat must be supplied in process 1DIf final volume of gas in process 1,2 and 3 are same. Then temperature must be same.
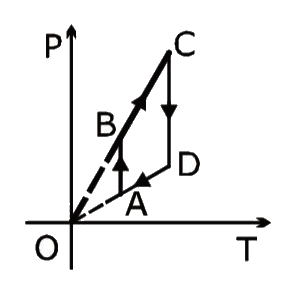
A P-T graph is shown for a cyclic process. Select correct statement regarding this
 View Solution
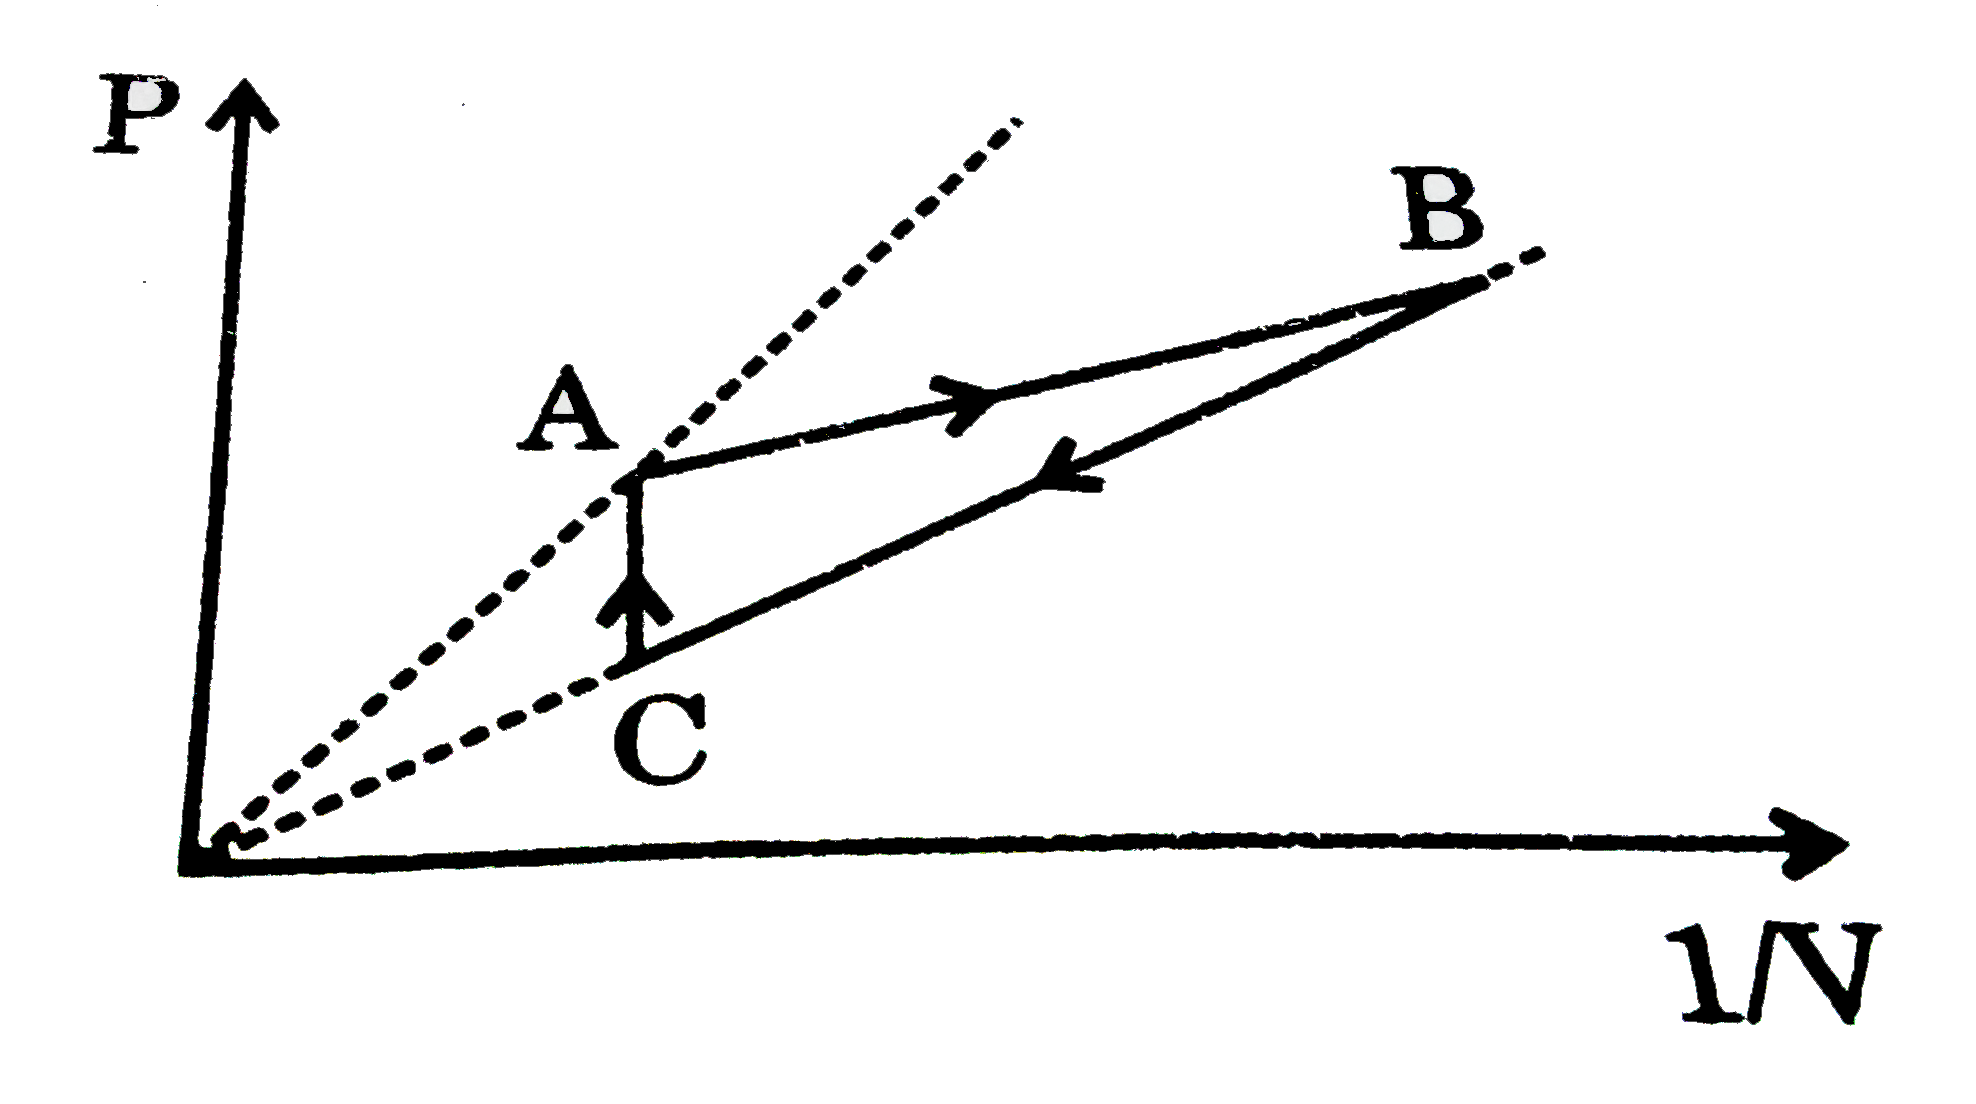
For the following process involving fixed moles of an ideal gas, select the correct statement (s). (d is density of gas)
 View Solution
On the P−T graph of an ideal gas, choose the correct option(s):
View SolutionA graph is plotted for gas 'C' , by putting its weight (in gm) on X-axis and the Volume (L) of gas at NTP on Y-axis. Select the correct statement :
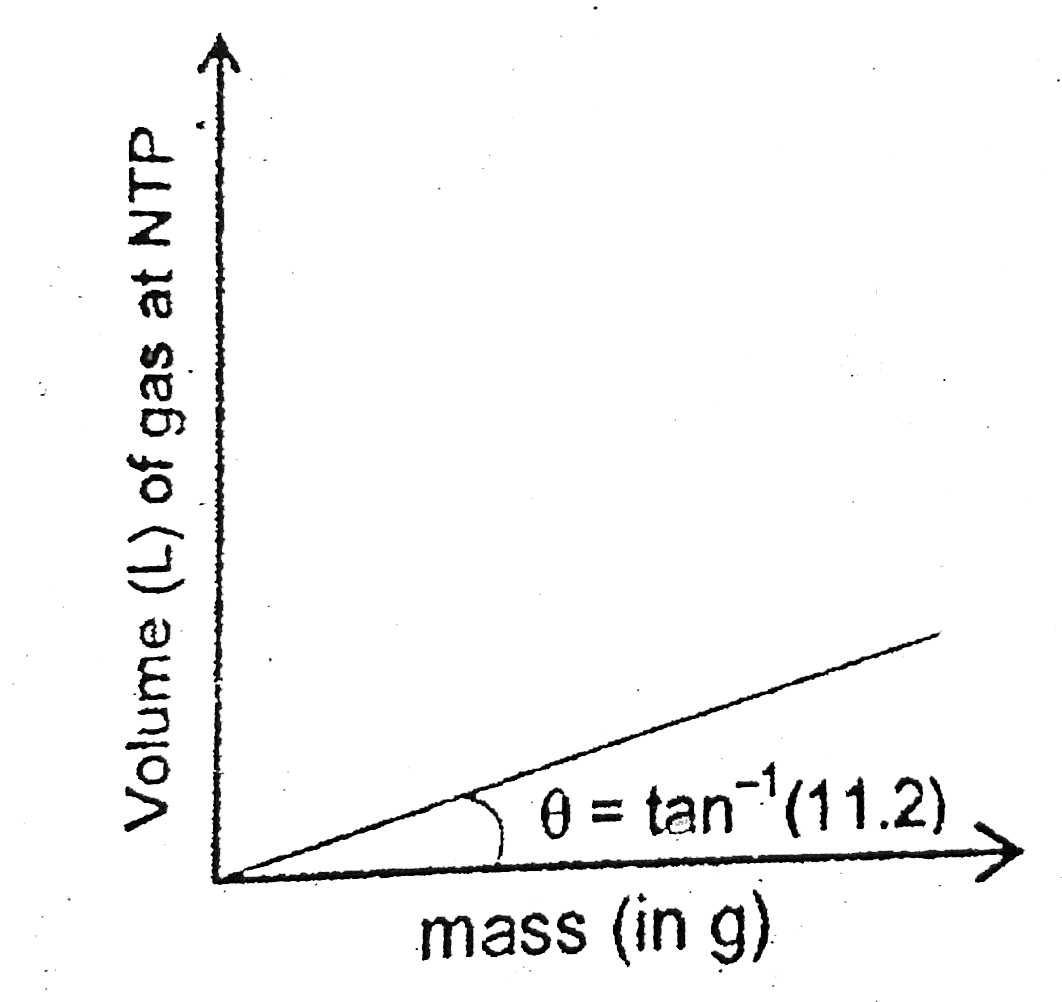 View Solution
Which of the following plots are correct for an ideal gas ?
View Solution

