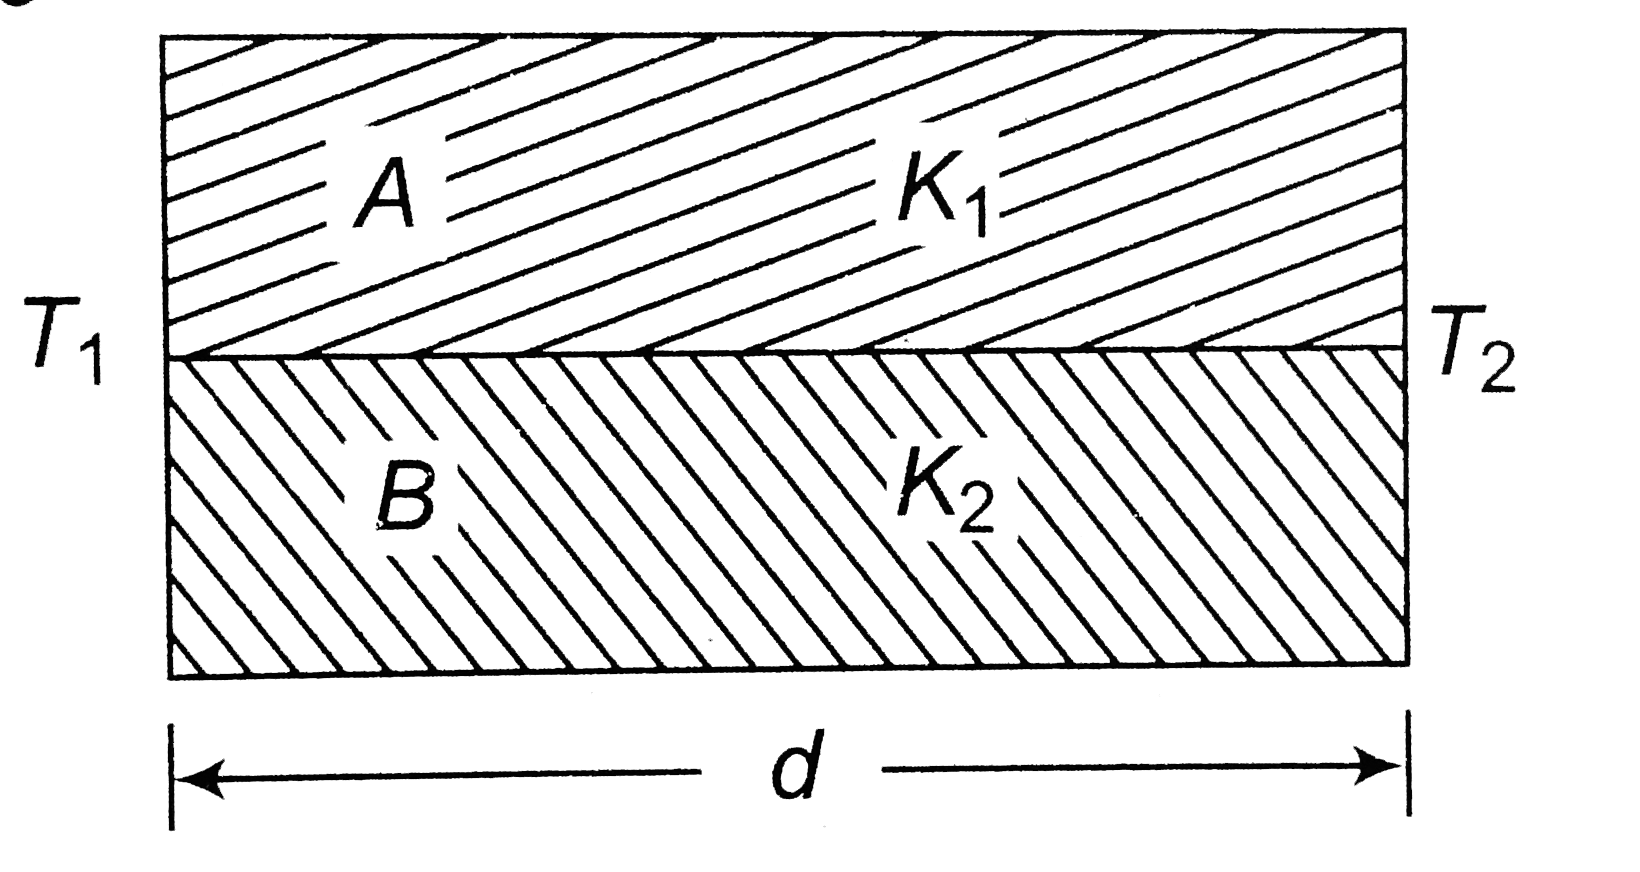
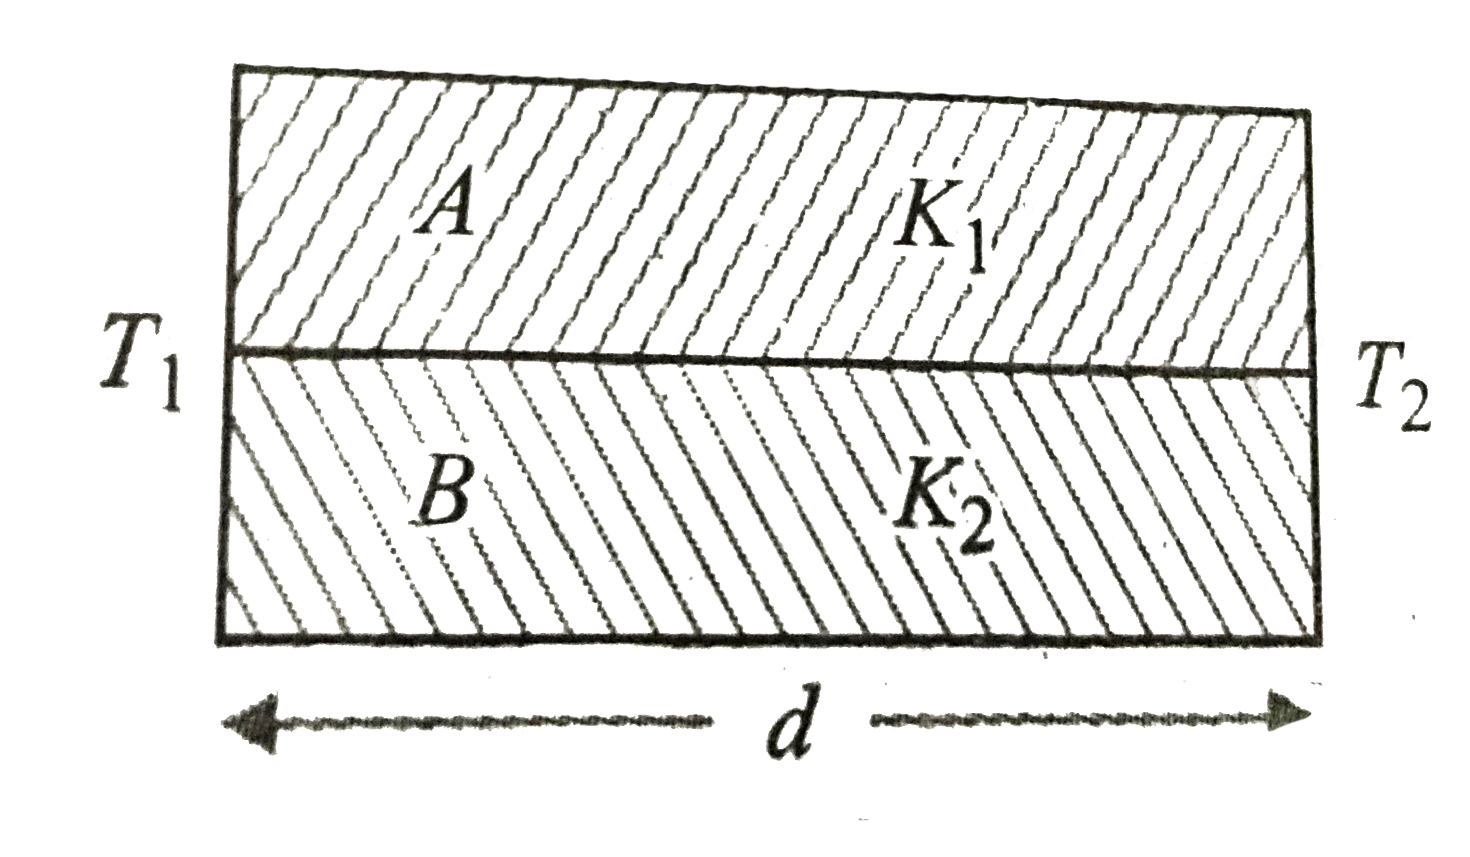
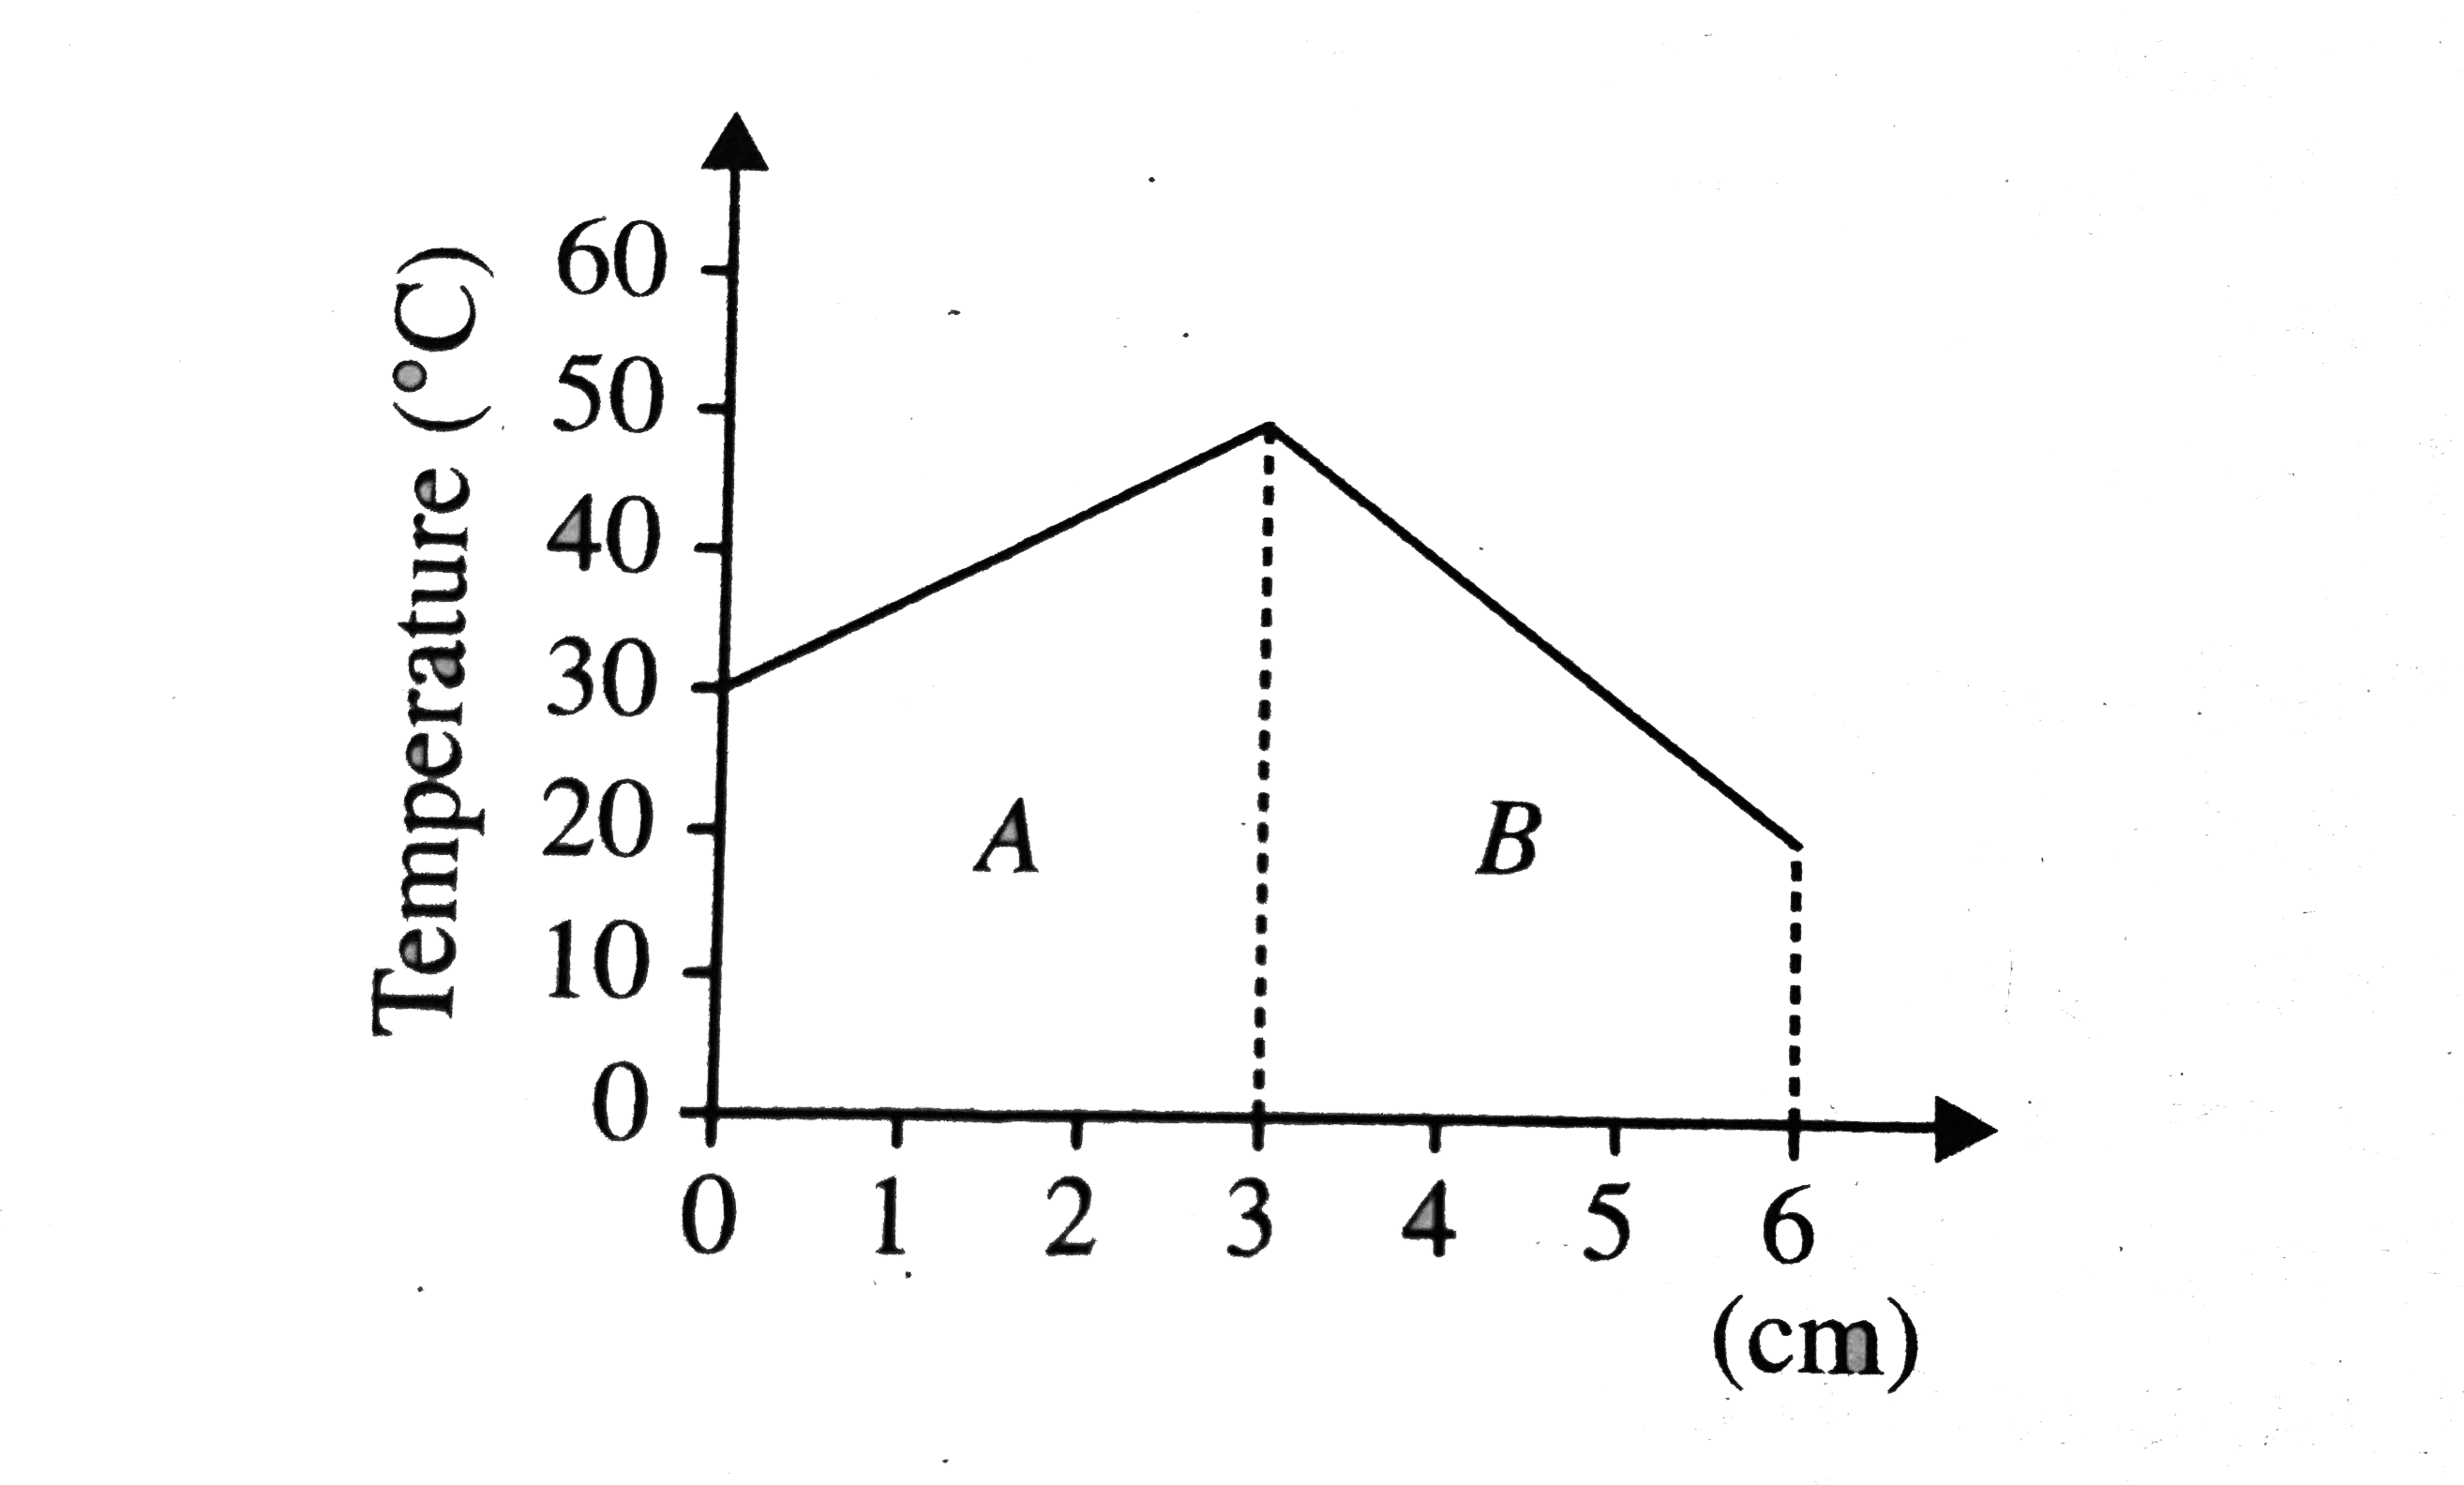
Two different rods A and B are kept as shown in figure . The variation of temperature of different cross sections with distance is plotted in a graph shown in figure . The ration of thermal conductivities of A andB is -
_E01_027_Q01.png) Solution in Gujrati
Solution in Gujrati
2
0.5
1
2/3
The correct Answer is:B
∵(ΔQΔt)A=(ΔQΔt)B
∴KAA(100−70)30=KBA(70−35)70
⇒KA=KB2⇒KAKB=12
Topper's Solved these Questions
- GEOMETRICAL OPTICSBOOK - ALLEN CHAPTER - GEOMETRICAL OPTICSEXERCISE - EXERCISE -02
82 Videos
- GEOMETRICAL OPTICSBOOK - ALLEN CHAPTER - GEOMETRICAL OPTICSEXERCISE - EXERCISE -03
11 Videos
- GEOMETRICAL OPTICSBOOK - ALLEN CHAPTER - GEOMETRICAL OPTICSEXERCISE - SOME WORKED OUT EXAMPLES
84 Videos
- CURRENT ELECTRICITYBOOK - ALLEN CHAPTER - CURRENT ELECTRICITYEXERCISE - EX.II
66 Videos
- GRAVITATIONBOOK - ALLEN CHAPTER - GRAVITATIONEXERCISE - EXERCISE 4
9 Videos
Similar Questions
A triangular plate has two cavities , one square and one rectangular as shown in figure . The plate is heated.
_E01_066_Q01.png)
View SolutionThree liquids A,B and C having same specific heat and mass m , 2m and 3 m have temperature 20∘C,40∘C and 60∘C respectively. Temperature of the mixture when:
Column-IColumn-II(A)A and B are mixed(p)33∘C(B)A and C are mixed(q)52∘C(C)B and C are mixed(r)50∘C(D)A,B and C all three are mixed(s)46∘C(t)None
View SolutionIn an 20 m deep lake, the bottom is at a constant temperature of 4∘C. The air temperature is constant at −10∘C. The thermal conductivity of ice in 4 times that water. Neglecting the expansion of water on freezing, the maximum thickness of ice will be
View SolutionIn the Bohr's model of hy drogen atom, the electron moves around the nucleus in a circular orbit of radius 5×10⁻¹¹m. Its time period is 1.5×10⁻¹⁶s. The current associated with the electron motion is:-
View SolutionAssertion : The difference in the value of acceleration due to gravity at pole and equator is proportional to square of angular velocity of earth.
Reason : the value of acceleration due to gravity is minimum at the equator and maximum at the pole.
View SolutionThe temperature across two different slabs A and B are shown I the steady state (as shown Fig) The ratio of thermal conductivities of A and B is
View SolutionTwo rods A and B of different materials are welded together as shown in figure. Their thermal conductivities are K1 and K2. The thermal conductivity of the composite rod will be

View SolutionTwo rods A and B of different materials are welded together as shown in figure. Their thermal conductivities are K1 and K2. The thermal conductivity of the composite rod will be

View SolutionAn irregular rod of same uniform material as shown in figure is conducting heat at a steady rate. The temperature gradient at various sections versus area of cross section graph will be
_S01_094_Q01.png)
View SolutionThe variation of lengths of two moles rods A and B with change in temperature is shown in figure . The ratio of αaαB is :-
_E01_013_Q01.png)
View SolutionA pipe of constant cross - section is bent in a horizontal plane as shown in the figure . Points A and B are located on two different streamlines . Then
View SolutionTwo rods A and B of different materials are welded together as shown in figure. Their thermal conductivities are K1 and K2. The thermal conductivity of the composite rod will be

View Solution
The temperature across two different slabs A and B are shown I the steady state (as shown Fig) The ratio of thermal conductivities of A and B is
View SolutionTwo different rods A and B are kept as shown in the figure. The variation of temperature of different cross-sections is plotted Find the ratio" of thermal conductivities of B to A.
'(##CEN_KSR_PHY_JEE_C13_E01_031_Q08##)'
View Solution
The temperature across two different slabs A and B are shown I the steady state (as shown Fig) The ratio of thermal conductivities of A and B is
View SolutionTwo rods A and B of different materials are welded together as shown in figure. Their thermal conductivities are K1 and K2. The thermal conductivity of the composite rod will be

View Solution
