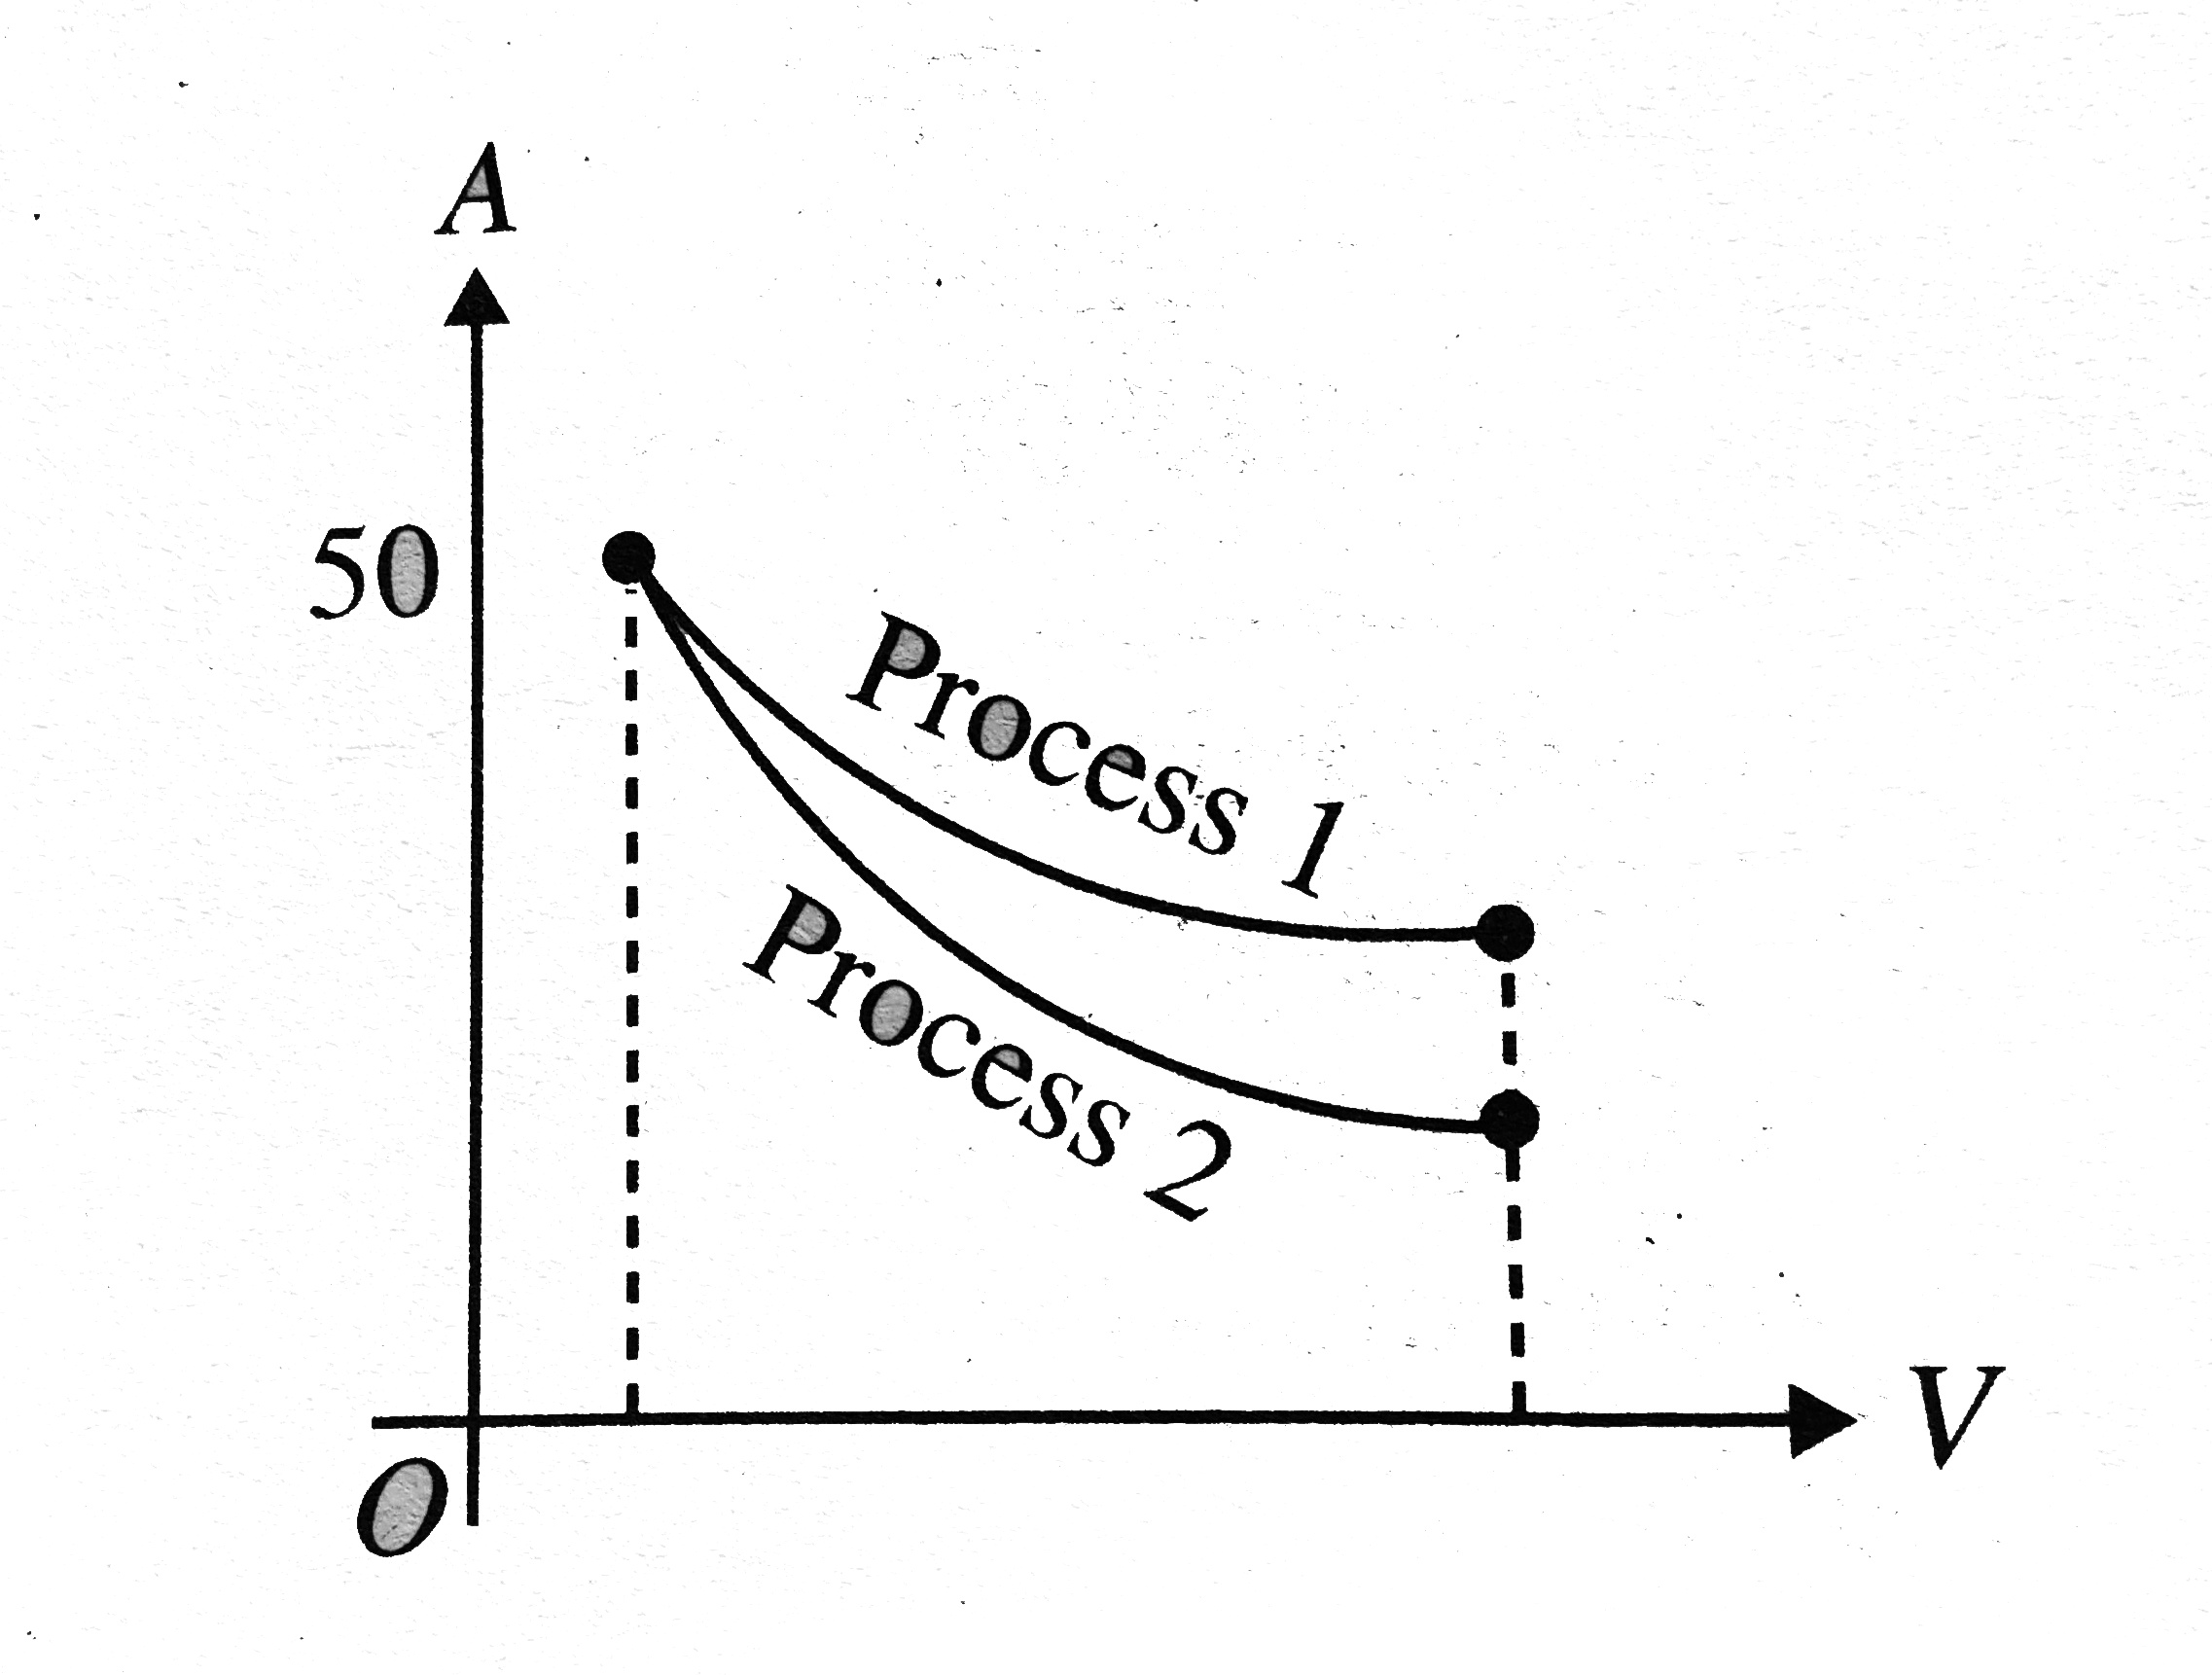
The indicator diagram for two processes 1 and 2 carrying on an ideal gas is shown in Fig. If m1 and m2 be the slopes (dP/dV) for process 1 and process 2, respectively, then
 Solution in Gujrati
m1=m2
m1>m2
m1<m2
m2CV=m1Cp
The correct Answer is:C, D
Slope of isothermal process
m1=ΔPΔV=−PV
Slope of adiabatic process
m2=ΔPΔV=−γPV=−γm1=CpCVm1
Topper's Solved these Questions
- GEOMETRICAL OPTICSBOOK - ALLEN CHAPTER - GEOMETRICAL OPTICSEXERCISE - EXERCISE -03
11 Videos
- GEOMETRICAL OPTICSBOOK - ALLEN CHAPTER - GEOMETRICAL OPTICSEXERCISE - ASSERTION-REASON
40 Videos
- GEOMETRICAL OPTICSBOOK - ALLEN CHAPTER - GEOMETRICAL OPTICSEXERCISE - EXERCISE -01
65 Videos
- CURRENT ELECTRICITYBOOK - ALLEN CHAPTER - CURRENT ELECTRICITYEXERCISE - EX.II
66 Videos
- GRAVITATIONBOOK - ALLEN CHAPTER - GRAVITATIONEXERCISE - EXERCISE 4
9 Videos
Similar Questions
Three liquids A,B and C having same specific heat and mass m , 2m and 3 m have temperature 20∘C,40∘C and 60∘C respectively. Temperature of the mixture when:
Column-IColumn-II(A)A and B are mixed(p)33∘C(B)A and C are mixed(q)52∘C(C)B and C are mixed(r)50∘C(D)A,B and C all three are mixed(s)46∘C(t)None
View SolutionStatement-1: A real gas behaves as an ideal gas at high temperature and low pressure .
Statement-2: Liquid state of an ideal gas is impossible.
View SolutionOn an X temperature scale, water freezes at −125.0∘X and boils at 375.0∘X. On a Y temperature scale, water freezes at −70.0∘Y and boils at −30.0∘Y. The value of temperature on X-scale equal to the temperature of 50.0∘Y on Y-scale is
View SolutionIn the Bohr's model of hy drogen atom, the electron moves around the nucleus in a circular orbit of radius 5×10⁻¹¹m. Its time period is 1.5×10⁻¹⁶s. The current associated with the electron motion is:-
View SolutionAssertion : The difference in the value of acceleration due to gravity at pole and equator is proportional to square of angular velocity of earth.
Reason : the value of acceleration due to gravity is minimum at the equator and maximum at the pole.
View SolutionAssertion: Isothermal and adiabatic, two processes are shown on p-V diagram. Process-1 is aidabatic and process-2 is isothermal. Reason: At a given point, slope of adiabatic process =gammaxx slope of isothermal process.
View SolutionIf m_(1),m_(2) are masses of an ideal gas, then which of the graph repersents m_(2)gtm_(1) ?.
View SolutionV-T diagram for a process of given mass of ideal gas is as shown in fig. During the process pressure of the gas
View SolutionIf in a nuclear fusion process the masses of the fusing nuclei be m_(1) and m_(2) and the mass of the resuktant nucleus be m_(3) , then
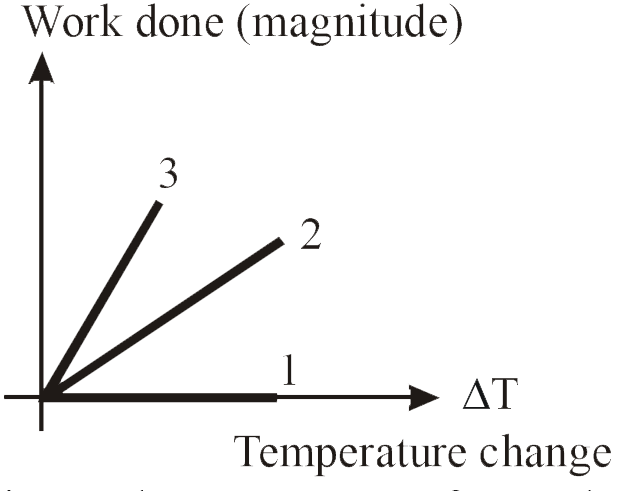
View SolutionFor an ideal gas graph is shown for three processes. Process 1, 2 and 3 are respectively

View SolutionCorrect expression for density of an ideal gas mixture of two gases 1 and 2, where m_(1) and m_(2) are masses and n_(1) and n_(2) are moles and M_(1) and M_(2) are molar masses.
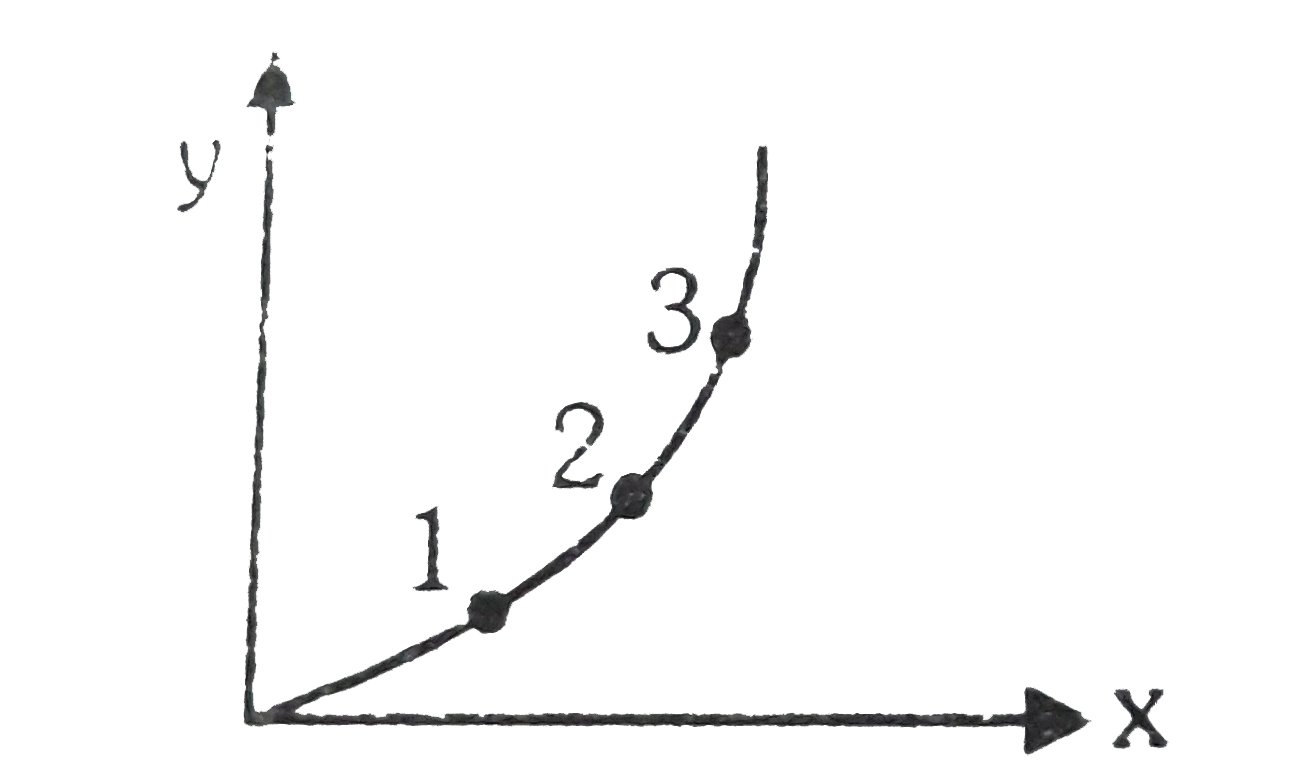
View SolutionThe slope of graph as shown in figure at points 1,2 and 3 is m1,m2 and m3 respectively then

View SolutionTwo non-vertical line with slopes m1andm2 are perpendicular if and only if m1×m2=___.
View SolutionCorrect expression for density of an ideal gas mixture of two gases 1 and 2, where m1 and m2 are masses and n1 and n2 are moles and M1 and M2 are molar masses.
View SolutionThe p -V diagram of two different masses m_(1) and m_(2) are drawn (as shown) at constant temperature (T) . State whether m_(1) gt m_(2) "or" m_(2) gt m_(2) . .
View SolutionAssertion: Isothermal and adiabatic, two processes are shown on p-V diagram. Process-1 is aidabatic and process-2 is isothermal. Reason: At a given point, slope of adiabatic process =gammaxx slope of isothermal process.
View Solution
