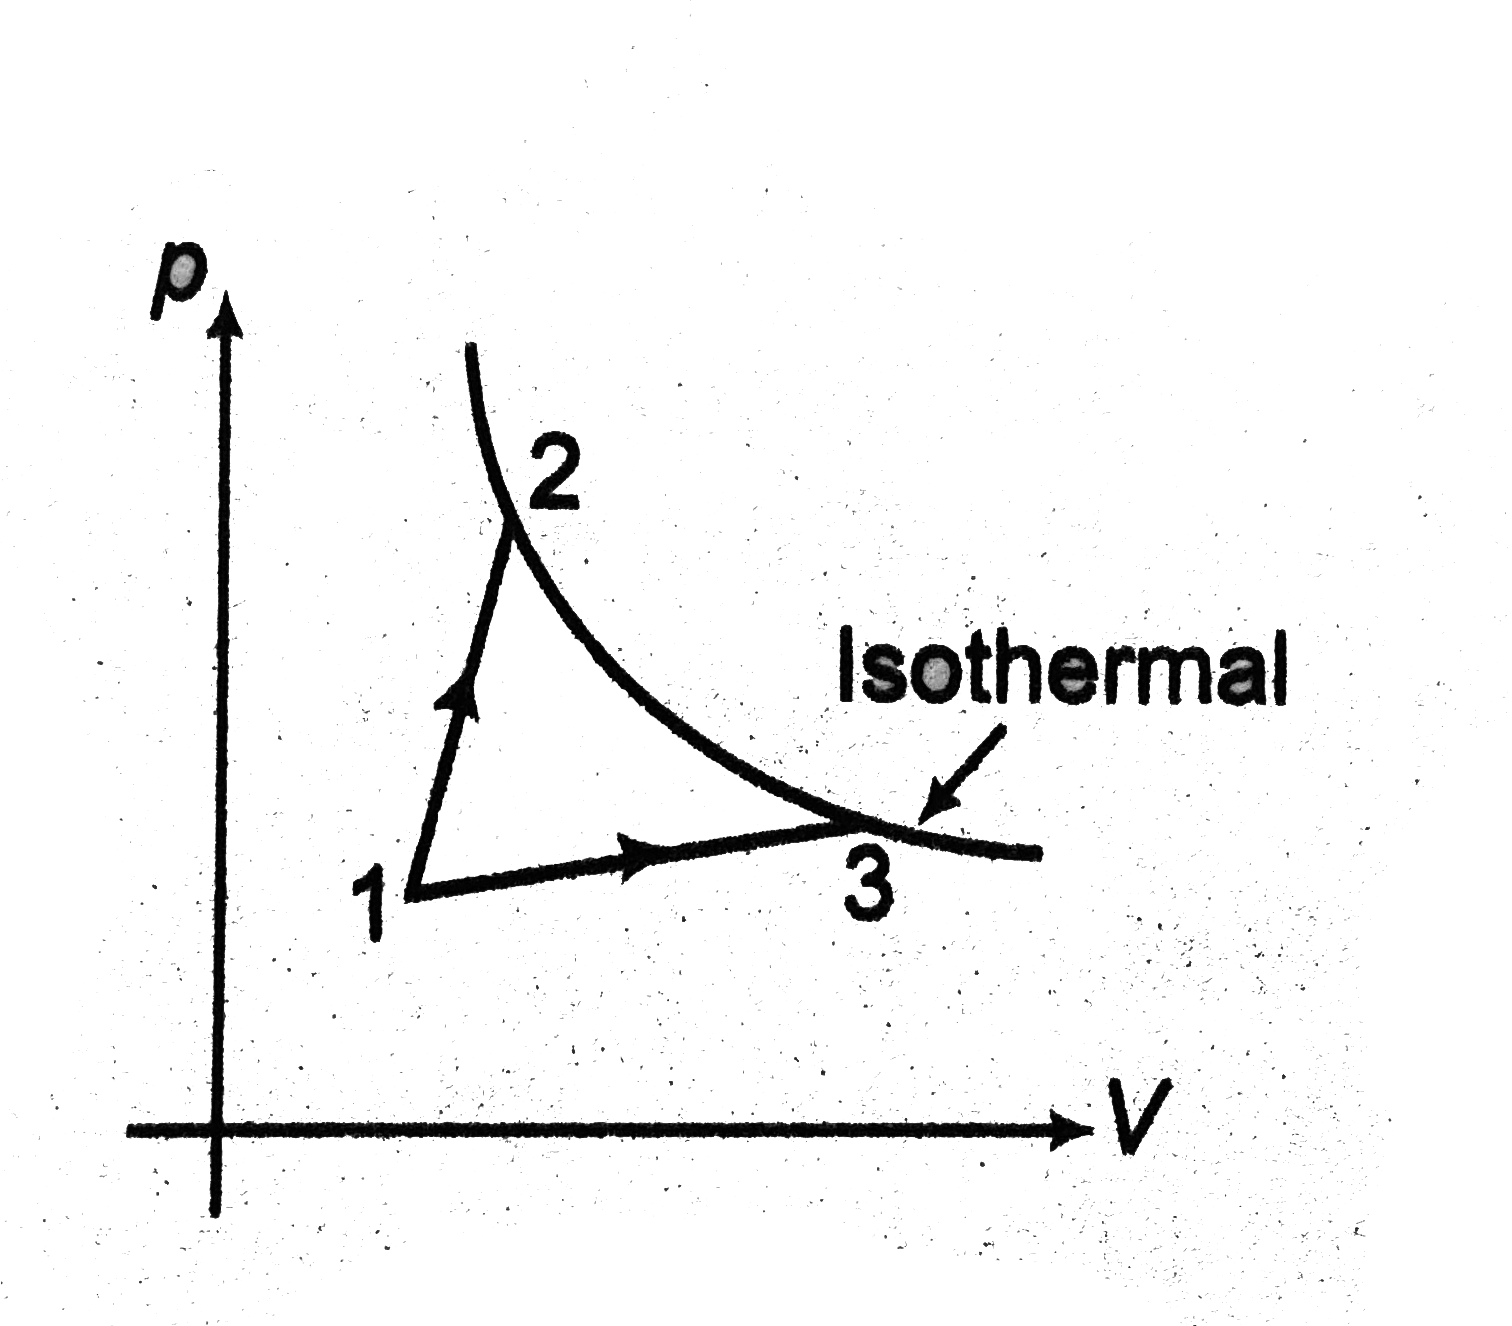
A gas takes part in two processes in which it is heated from the same initial state 1 to the same final temperature. The processes are shown on the p-V diagram by the straight lines 1-3 and 1-2. 2 and 3 are the points on the same isothermal curve. Q1 and Q2 are the heat transfer along the two processes. Then,
 Solution in Gujrati
Q1=Q2
Q1<Q2
Q1>Q2
insufficient data
The correct Answer is:B
Work done in process 1−3 is greater than that in process 1−2. While change in internal energy is same for both processes
∴Q2>Q1.
Topper's Solved these Questions
- GEOMETRICAL OPTICSBOOK - ALLEN CHAPTER - GEOMETRICAL OPTICSEXERCISE - EXERCISE -03
11 Videos
- GEOMETRICAL OPTICSBOOK - ALLEN CHAPTER - GEOMETRICAL OPTICSEXERCISE - ASSERTION-REASON
40 Videos
- GEOMETRICAL OPTICSBOOK - ALLEN CHAPTER - GEOMETRICAL OPTICSEXERCISE - EXERCISE -01
65 Videos
- CURRENT ELECTRICITYBOOK - ALLEN CHAPTER - CURRENT ELECTRICITYEXERCISE - EX.II
66 Videos
- GRAVITATIONBOOK - ALLEN CHAPTER - GRAVITATIONEXERCISE - EXERCISE 4
9 Videos
Similar Questions
Three liquids A,B and C having same specific heat and mass m , 2m and 3 m have temperature 20∘C,40∘C and 60∘C respectively. Temperature of the mixture when:
Column-IColumn-II(A)A and B are mixed(p)33∘C(B)A and C are mixed(q)52∘C(C)B and C are mixed(r)50∘C(D)A,B and C all three are mixed(s)46∘C(t)None
View SolutionStatement-1: A real gas behaves as an ideal gas at high temperature and low pressure .
Statement-2: Liquid state of an ideal gas is impossible.
View SolutionOn an X temperature scale, water freezes at −125.0∘X and boils at 375.0∘X. On a Y temperature scale, water freezes at −70.0∘Y and boils at −30.0∘Y. The value of temperature on X-scale equal to the temperature of 50.0∘Y on Y-scale is
View SolutionIn the Bohr's model of hy drogen atom, the electron moves around the nucleus in a circular orbit of radius 5×10⁻¹¹m. Its time period is 1.5×10⁻¹⁶s. The current associated with the electron motion is:-
View SolutionAssertion : The difference in the value of acceleration due to gravity at pole and equator is proportional to square of angular velocity of earth.
Reason : the value of acceleration due to gravity is minimum at the equator and maximum at the pole.
View SolutionAssertion: Isothermal and adiabatic, two processes are shown on p-V diagram. Process-1 is aidabatic and process-2 is isothermal. Reason: At a given point, slope of adiabatic process =gammaxx slope of isothermal process.
View SolutionA gas takes part in two processes in which it is heated from the same initial state 1 to the same final temperature. The processes are shown on the p-V diagram by the straight lines 1-3 and 1-2. 2 and 3 are the points on the same isothermal curve. Q1 and Q2 are the heat transfer along the two processes. Then,

View SolutionA gas take part in two thermal processes in which it is heated from the same initial state to the same final temperature. The processes are shown on the P-V diagram by straight lines 1 rarr 3 and 1 rarr 2
View SolutionA gas take part in two thermal processes in which it is heated from the same initial state to the same final temperature. The processes are shown on the P-V diagram by straight lines 1 rarr 3 and 1 rarr 2
View SolutionTwo samples 1 and 2 are initially kept in the same state. The sample 1 is expanded through an isothermal process where as sample 2 through an adiabatic process upto the same final volume. The final temperature in process 1 and 2 are T_(1) and T_(2) respectively, then
View SolutionA cyclic process is shown on the P-T diagram. Which of the curve shown the same process on a V-T diagram?
View SolutionAn ideal gas is subjected to two different process in which it is heated to same final temperature from same initial state (A) as shown in diagram, then :
View SolutionA cyclic process 1-2-3-1 , performed on an ideal gas is depicted in the given V-T diagam show the same process on a P-V diagram and indicate the stages when the gas receives and rejects heat .

View SolutionA gas takes part in two thermal processes in which it is heated from the same initial state to the same final temperature. The P-V diagram for these two processes are indicated by straight lines 1-3 and 1-2 in figure. Find out in which process the amount of heat supplied to the gas is larger.
View SolutionConsider two processes on a system as shown in figure. The volumes in the initial states are the same in the two processes and the volumes in the final states are also the same. Let ΔW1andΔW2 be the work by the system in the processes A and B respectively.

View SolutionConsider two processes on a system as shown in figure. The volumes in the initial states are the same in the two processes and the volumes in the final states are also the same. Let ΔW1 and ΔW2 be the work by the system in the processes A and B respectively.

View Solution
