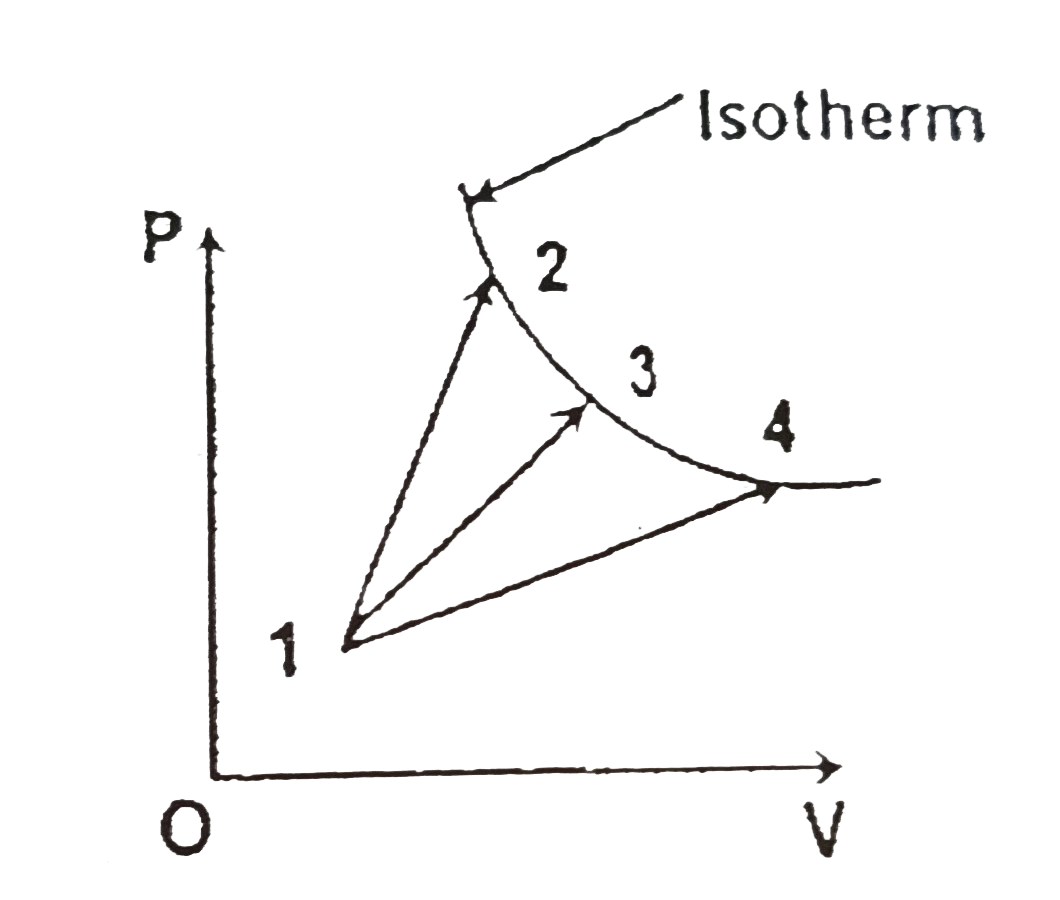
A gas takes part in two thermal processes in which it is heated from the same initial state to the same final temperature. The P-V diagram for these two processes are indicated by straight lines 1-3 and 1-2 in figure. Find out in which process the amount of heat supplied to the gas is larger.
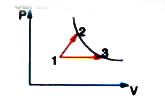
In process 1-3, heat received is larger
Topper's Solved these Questions
- THERMODYNAMICSBOOK - AAKASH SERIESCHAPTER - THERMODYNAMICSEXERCISE - QUESTIONS FOR DESCRIPTIVE ANSWERS
7 Videos
- THERMODYNAMICSBOOK - AAKASH SERIESCHAPTER - THERMODYNAMICSEXERCISE - Problem
60 Videos
- THERMODYNAMICSBOOK - AAKASH SERIESCHAPTER - THERMODYNAMICSEXERCISE - NUMERICAL EXERCISE (LEVEL-1)
19 Videos
- THERMAL PROPERTIES OF MATTERBOOK - AAKASH SERIESCHAPTER - THERMAL PROPERTIES OF MATTEREXERCISE - ADDITIONAL PRACTICE EXERCISE (LEVEL - II) PRACTICE SHEET (ADVANCED) Integer/Subjective Type Questions
2 Videos
- THERMOMETRY BOOK - AAKASH SERIESCHAPTER - THERMOMETRY EXERCISE - Numerical Exercise (LEVEL- 1)
11 Videos
Similar Questions
A gas take part in two thermal processes in which it is heated from the same initial state to the same final temperature. The processes are shown on the P−V diagram by straight lines 1→3 and 1→2
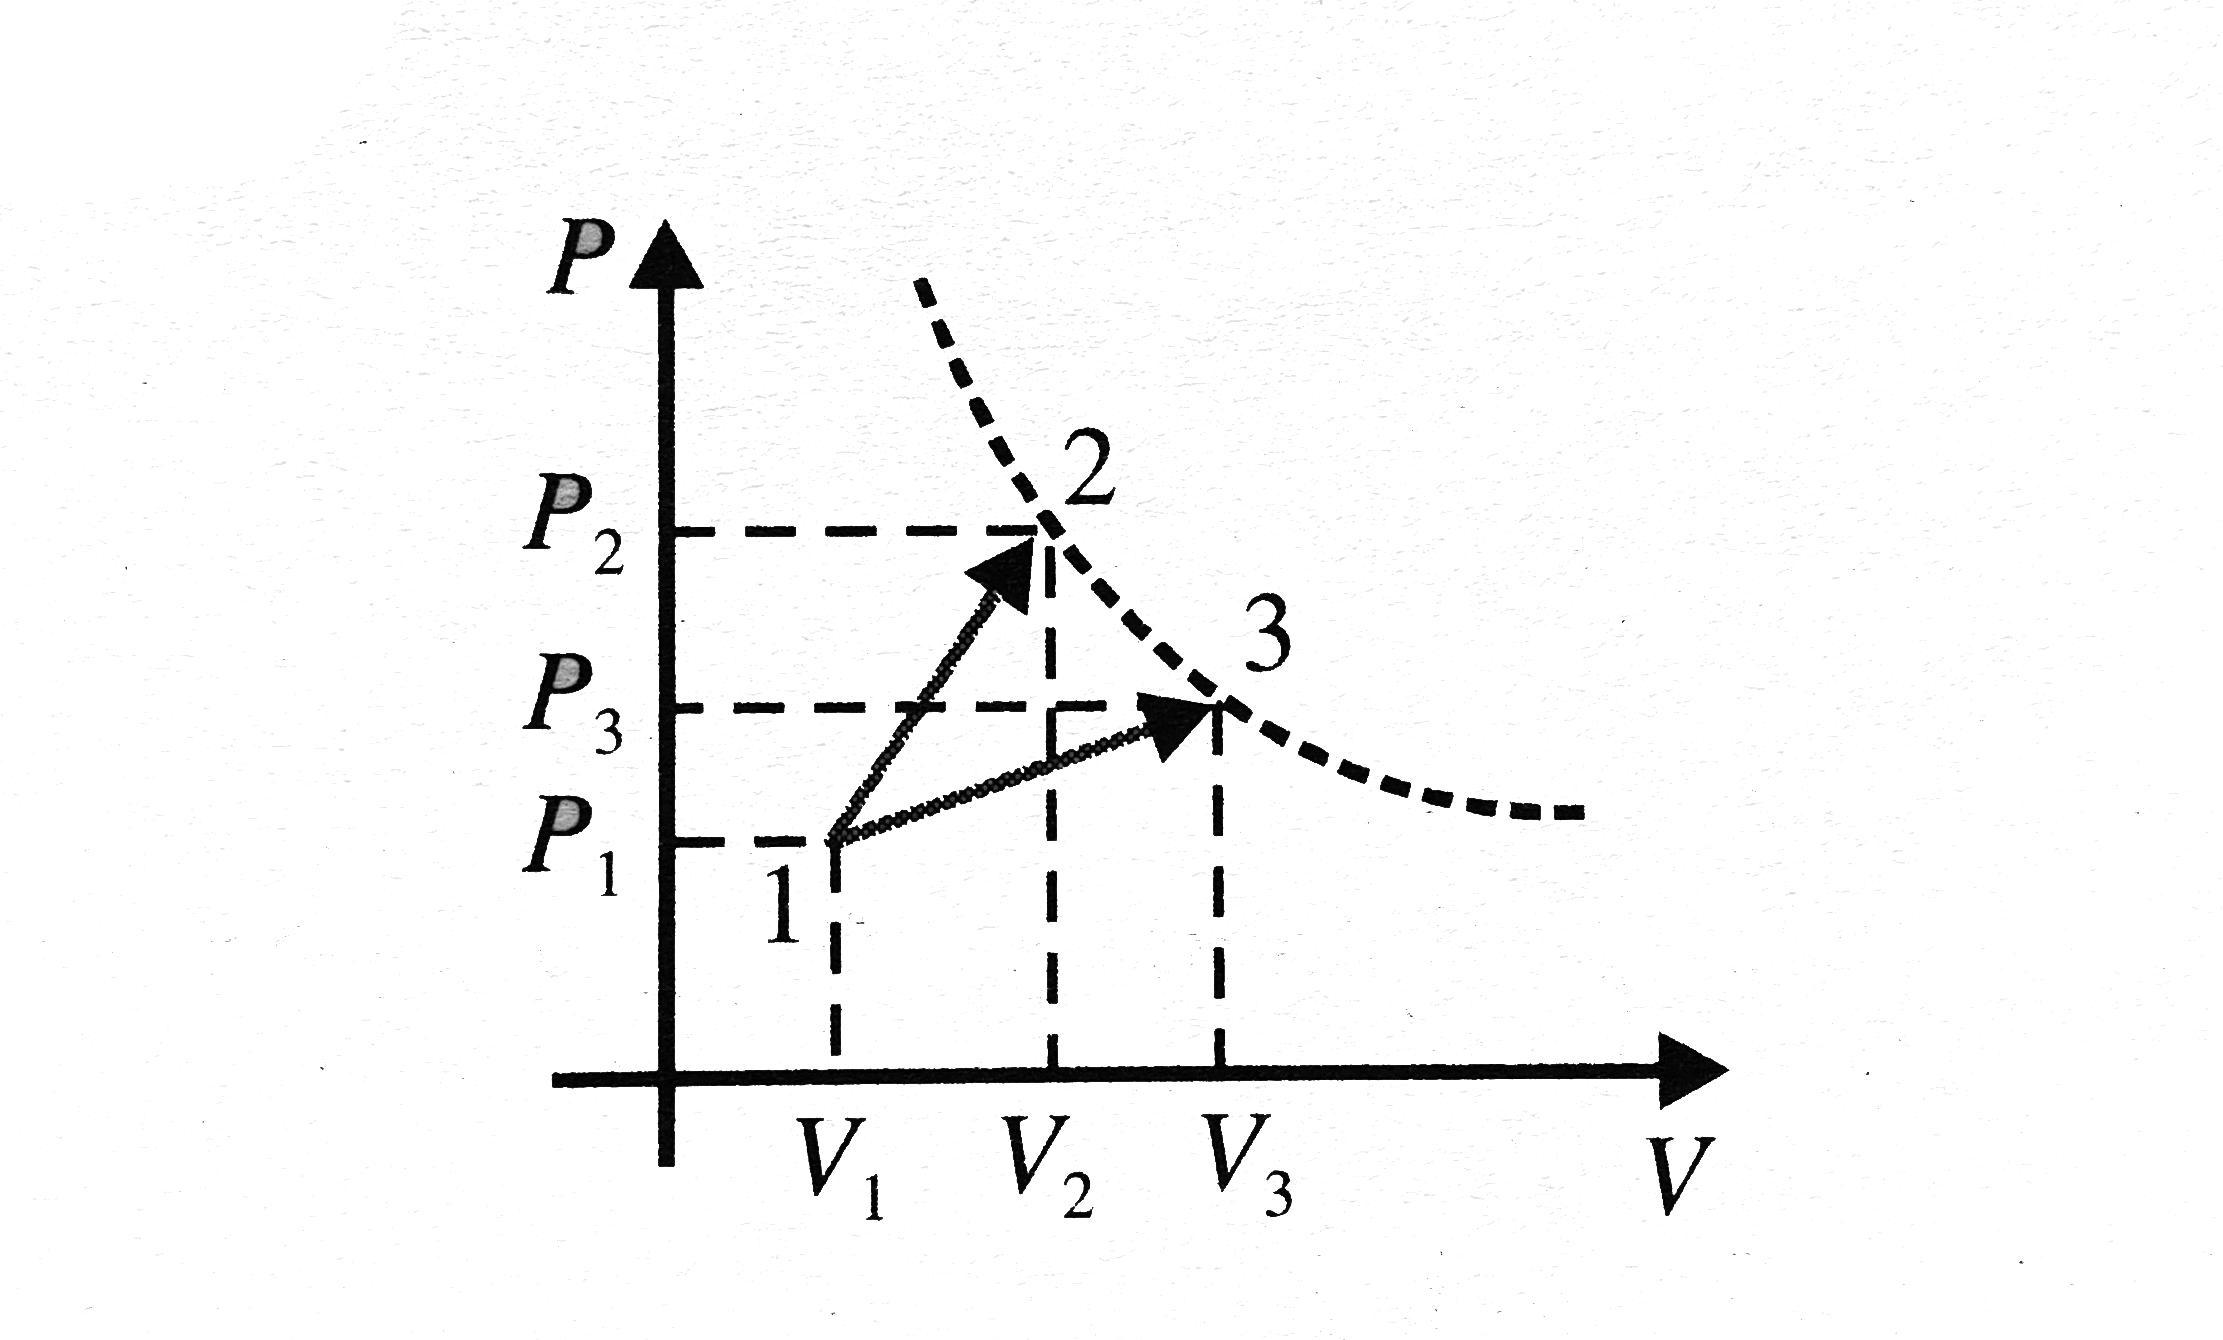
View SolutionA gas take part in two thermal processes in which it is heated from the same initial state to the same final temperature. The processes are shown on the P−V diagram by straight lines 1→3 and 1→2
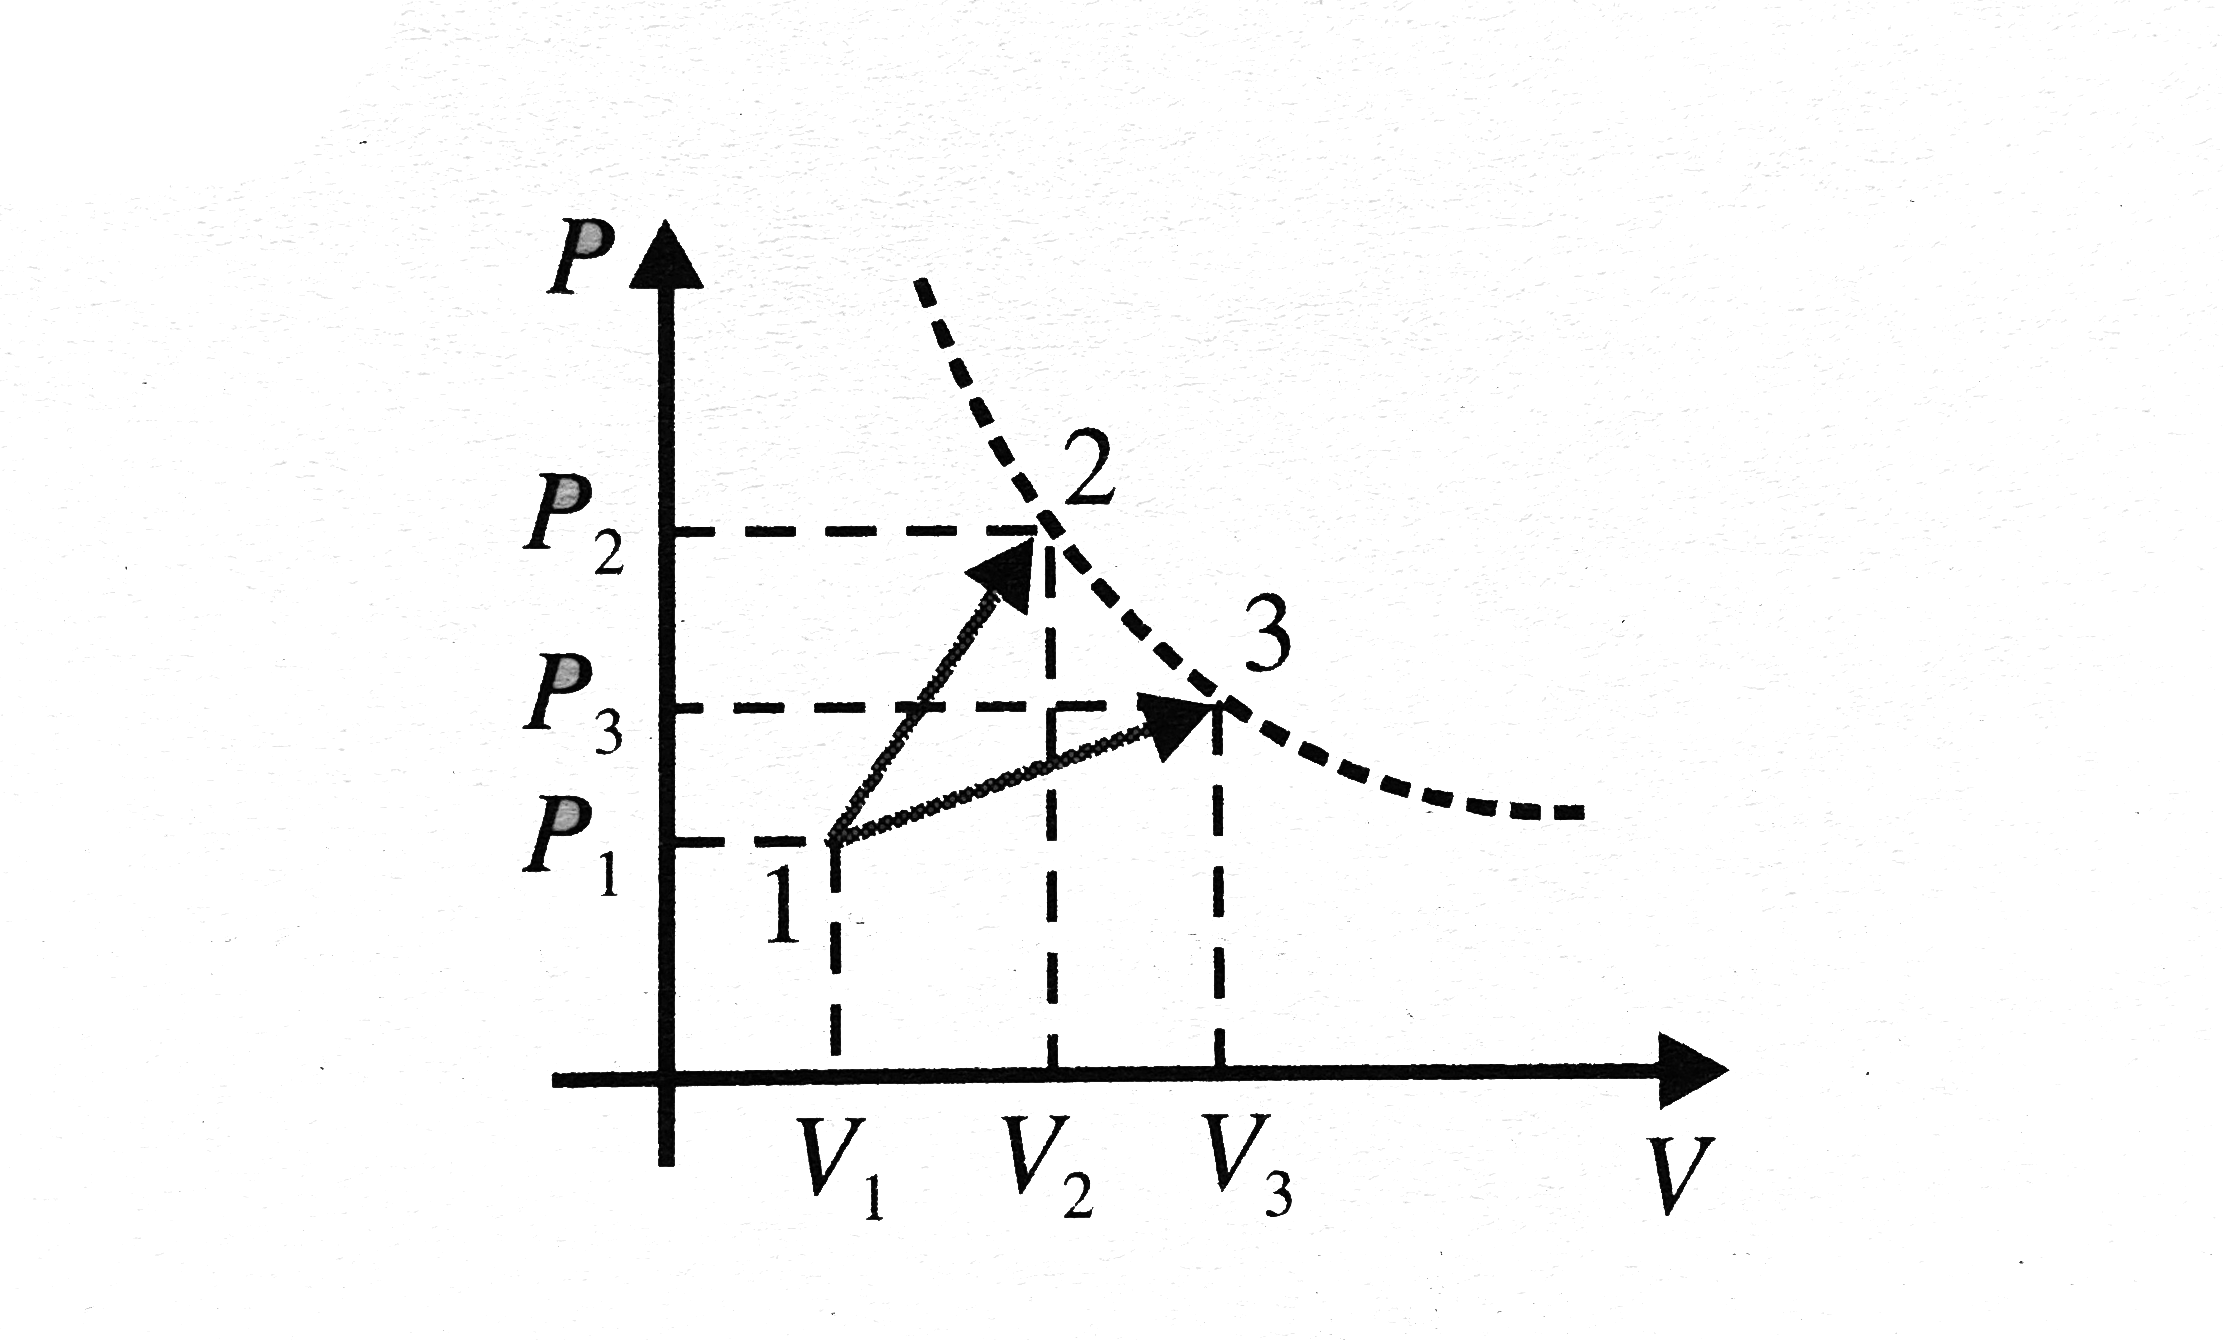
View Solution
Knowledge Check
A gas take part in two thermal processes in which it is heated from the same initial state to the same final temperature. The processes are shown on the P−V diagram by straight lines 1→3 and 1→2
 AQ13<Q12BQ13>Q12CQ13=Q12DNone of above
A gas take part in two thermal processes in which it is heated from the same initial state to the same final temperature. The processes are shown on the P−V diagram by straight lines 1→3 and 1→2
 AW13>W12BW12>W13CW13=W12DNone of above
A gas takes part in two processes in which it is heated from the same initial state 1 to the same final temperature. The processes are shown on the p-V diagram by the straight lines 1-3 and 1-2. 2 and 3 are the points on the same isothermal curve. Q1 and Q2 are the heat transfer along the two processes. Then,
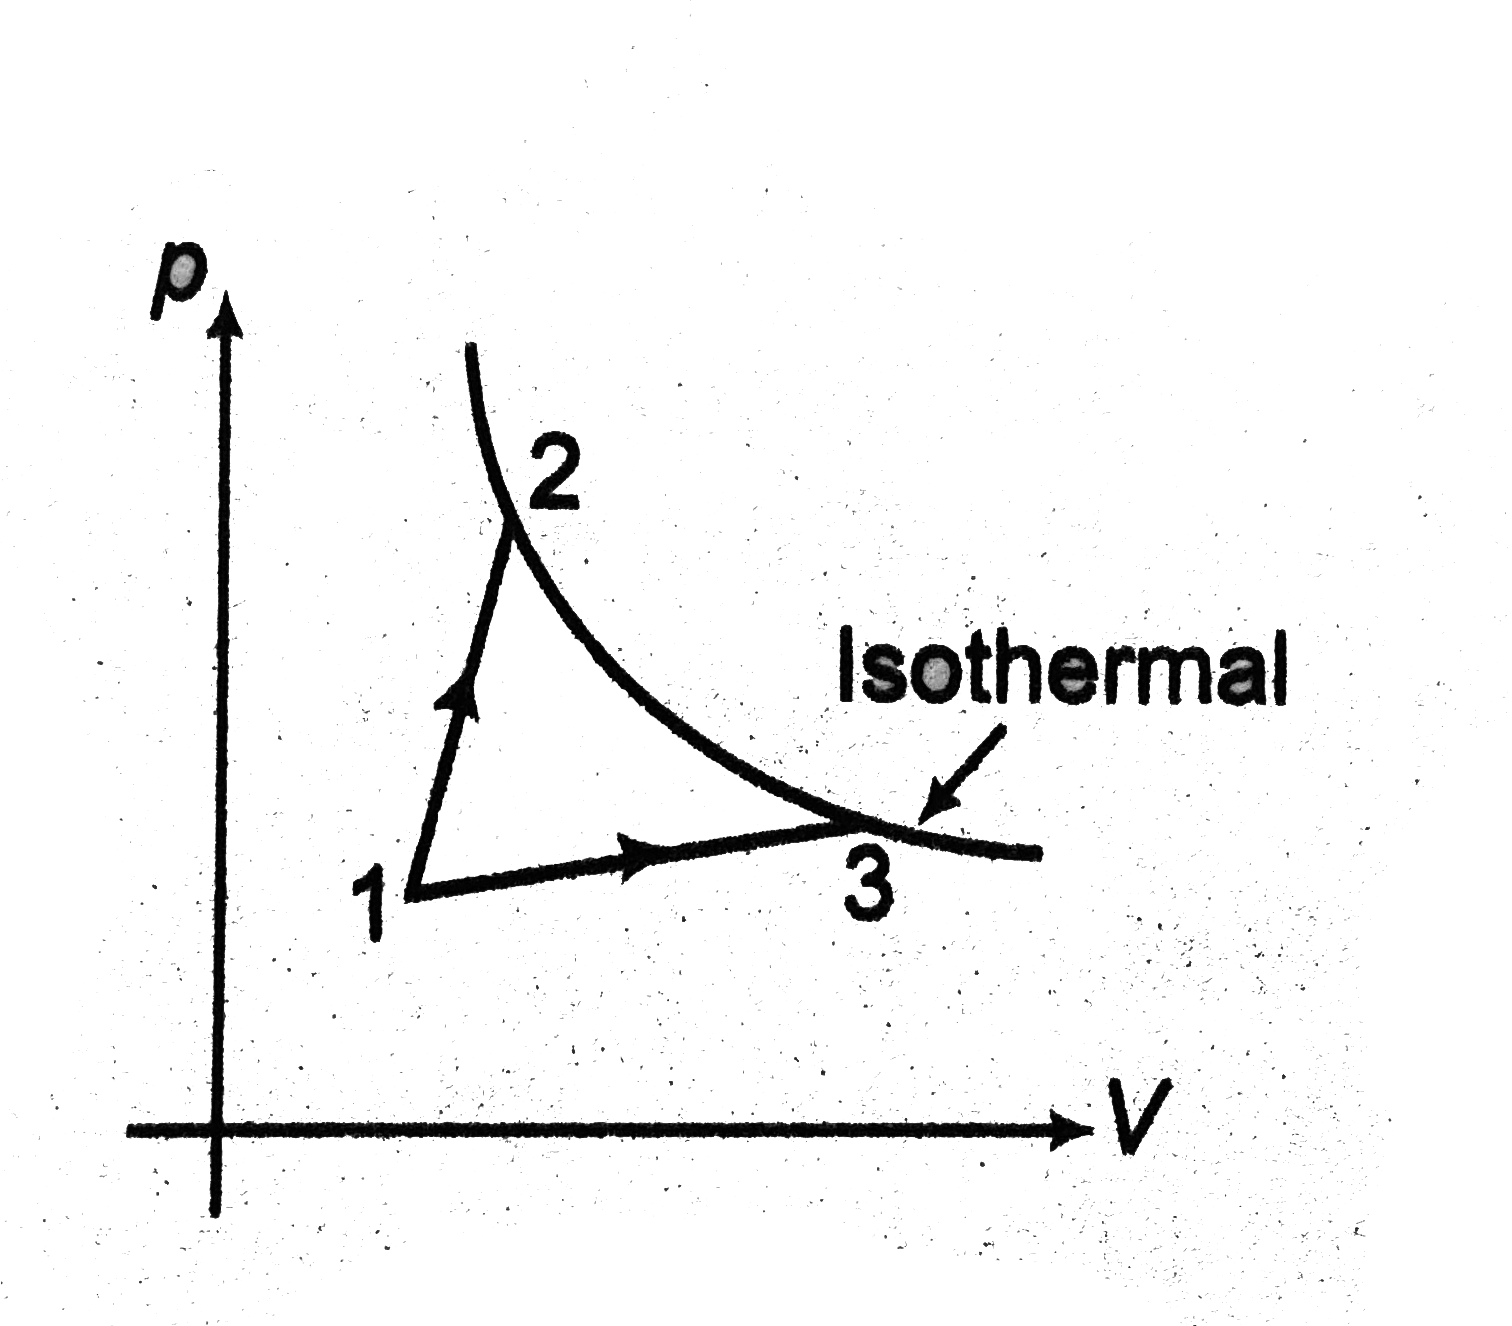 AQ1=Q2BQ1<Q2CQ1>Q2DInsufficient data
A gas took part in three thermal processes in which it is heated from the same initial state to the same final temperature. The process are shown in the P−V diagram by straight lines 1−2, 1−3 and 1−4. Q1, Q2 and Q3 are amount of heat supplied to the gas in the process 1→2, 1→3, 1→4. respectively.
View SolutionA gas takes part in two processes in which it is heated from the same initial state 1 to the same final temperature. The processes are shown on the p-V diagram by the straight lines 1-3 and 1-2. 2 and 3 are the points on the same isothermal curve. Q1 and Q2 are the heat transfer along the two processes. Then,

View SolutionP-V diagram of a diatomic gas is a straight line passing through origin. The molar heat capacity of the gas in the process will be
View SolutionP-V diagram of a diatomic gas is a straight line passing through origin. The molar heat capacity of the gas in the process will be
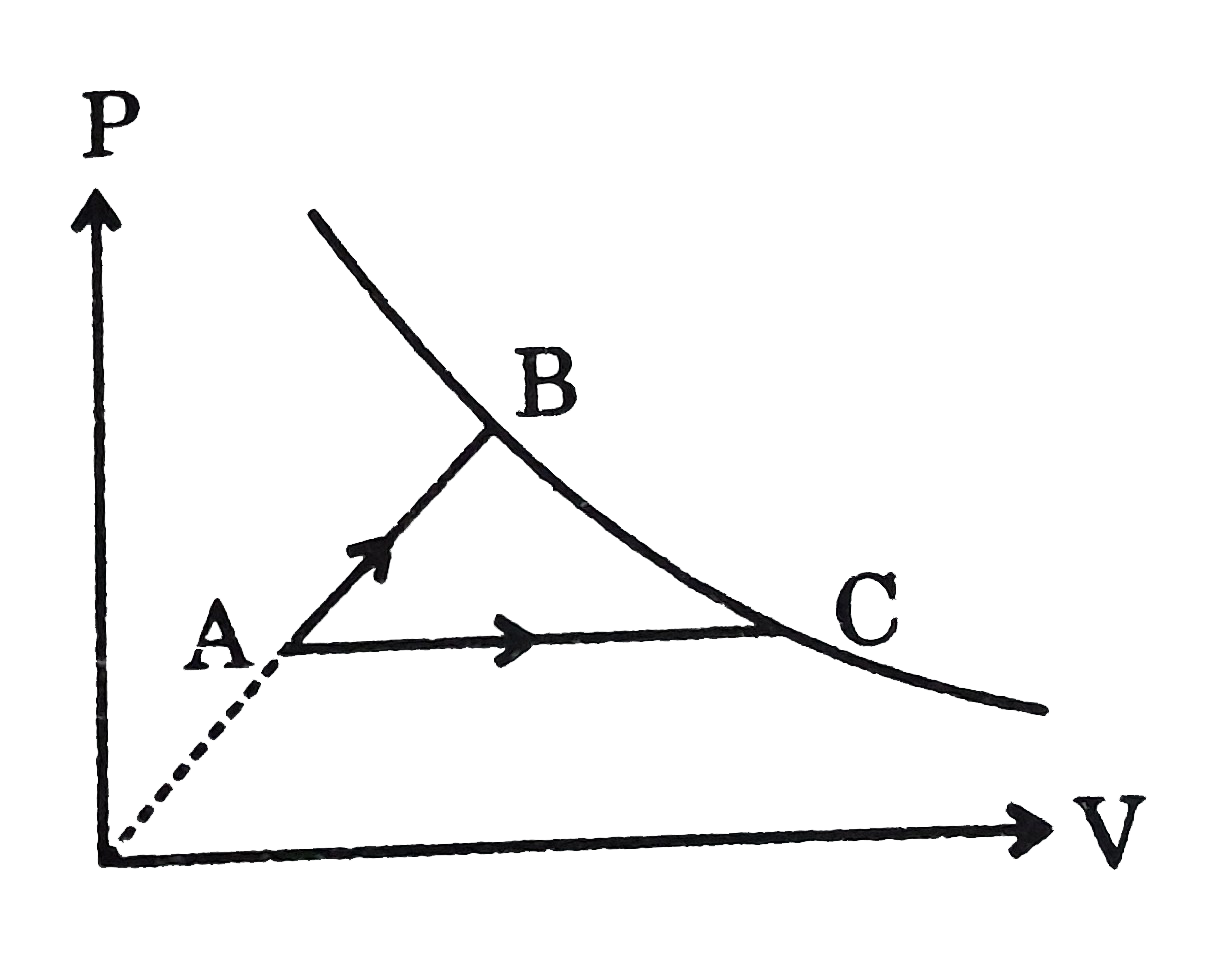
View SolutionAn ideal gas is subjected to two different process in which it is heated to same final temperature from same initial state (A) as shown in diagram, then :
View Solution
