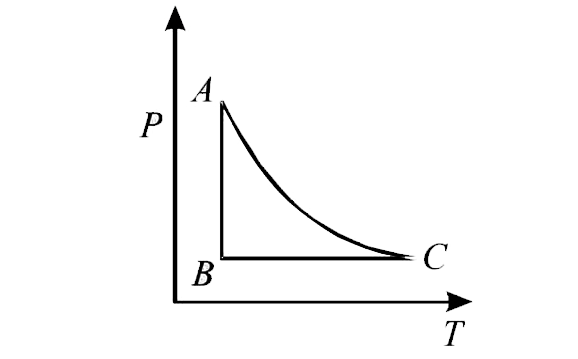
The PT diagram for an ideal gas is shown in the figure, where AC is an adiabatic process, find the corresponding PV diagram.
 Solution in Gujrati
_E01_397_O01.png)
_E01_397_O02.png)
_E01_397_O03.png)
_E01_397_O04.png)
The correct Answer is:A
Topper's Solved these Questions
- GEOMETRICAL OPTICSBOOK - ALLEN CHAPTER - GEOMETRICAL OPTICSEXERCISE - EXERCISE - 05 (B) (MCQ)
9 Videos
- GEOMETRICAL OPTICSBOOK - ALLEN CHAPTER - GEOMETRICAL OPTICSEXERCISE - EXERCISE - 05 (B) (MATCH THE COLUMN)
3 Videos
- GEOMETRICAL OPTICSBOOK - ALLEN CHAPTER - GEOMETRICAL OPTICSEXERCISE - EXERCISE - 05 (A)
73 Videos
- CURRENT ELECTRICITYBOOK - ALLEN CHAPTER - CURRENT ELECTRICITYEXERCISE - EX.II
66 Videos
- GRAVITATIONBOOK - ALLEN CHAPTER - GRAVITATIONEXERCISE - EXERCISE 4
9 Videos
Similar Questions
Let ¯v,vrms and vp respectively denote the mean speed, the root-mean - square speed, and the most probable speed of the molecules in an ideal monoatomic gas at absolute temperature T. The mass of a molecule is m:-
View SolutionFor the given process :-
_E01_426_Q01.png)
Column-IColumn-II(A)Process J→K(P)W>0(B)Process K→L(q)W<0(C)Process L→M(r)Q>0(D)Process M→J(s)Q<0
View SolutionAn aluminium sphere of 20cm diameter is heated from 0∘C to 100∘C. Its volume changes by (given that the coefficient of linear expanison for aluminium (αAl=23×10−6/0C)
View SolutionIn the Bohr's model of hy drogen atom, the electron moves around the nucleus in a circular orbit of radius 5×10⁻¹¹m. Its time period is 1.5×10⁻¹⁶s. The current associated with the electron motion is:-
View SolutionAssertion : The difference in the value of acceleration due to gravity at pole and equator is proportional to square of angular velocity of earth.
Reason : the value of acceleration due to gravity is minimum at the equator and maximum at the pole.
View SolutionThe cyclic process form a circle on a pV diagram as shown in figure. The work done by the gas is
View SolutionAn ideal gas goes through a reversible cycle a→B→c→d has the V-T diagram shown below. Process d→a and b→c are adiabatic
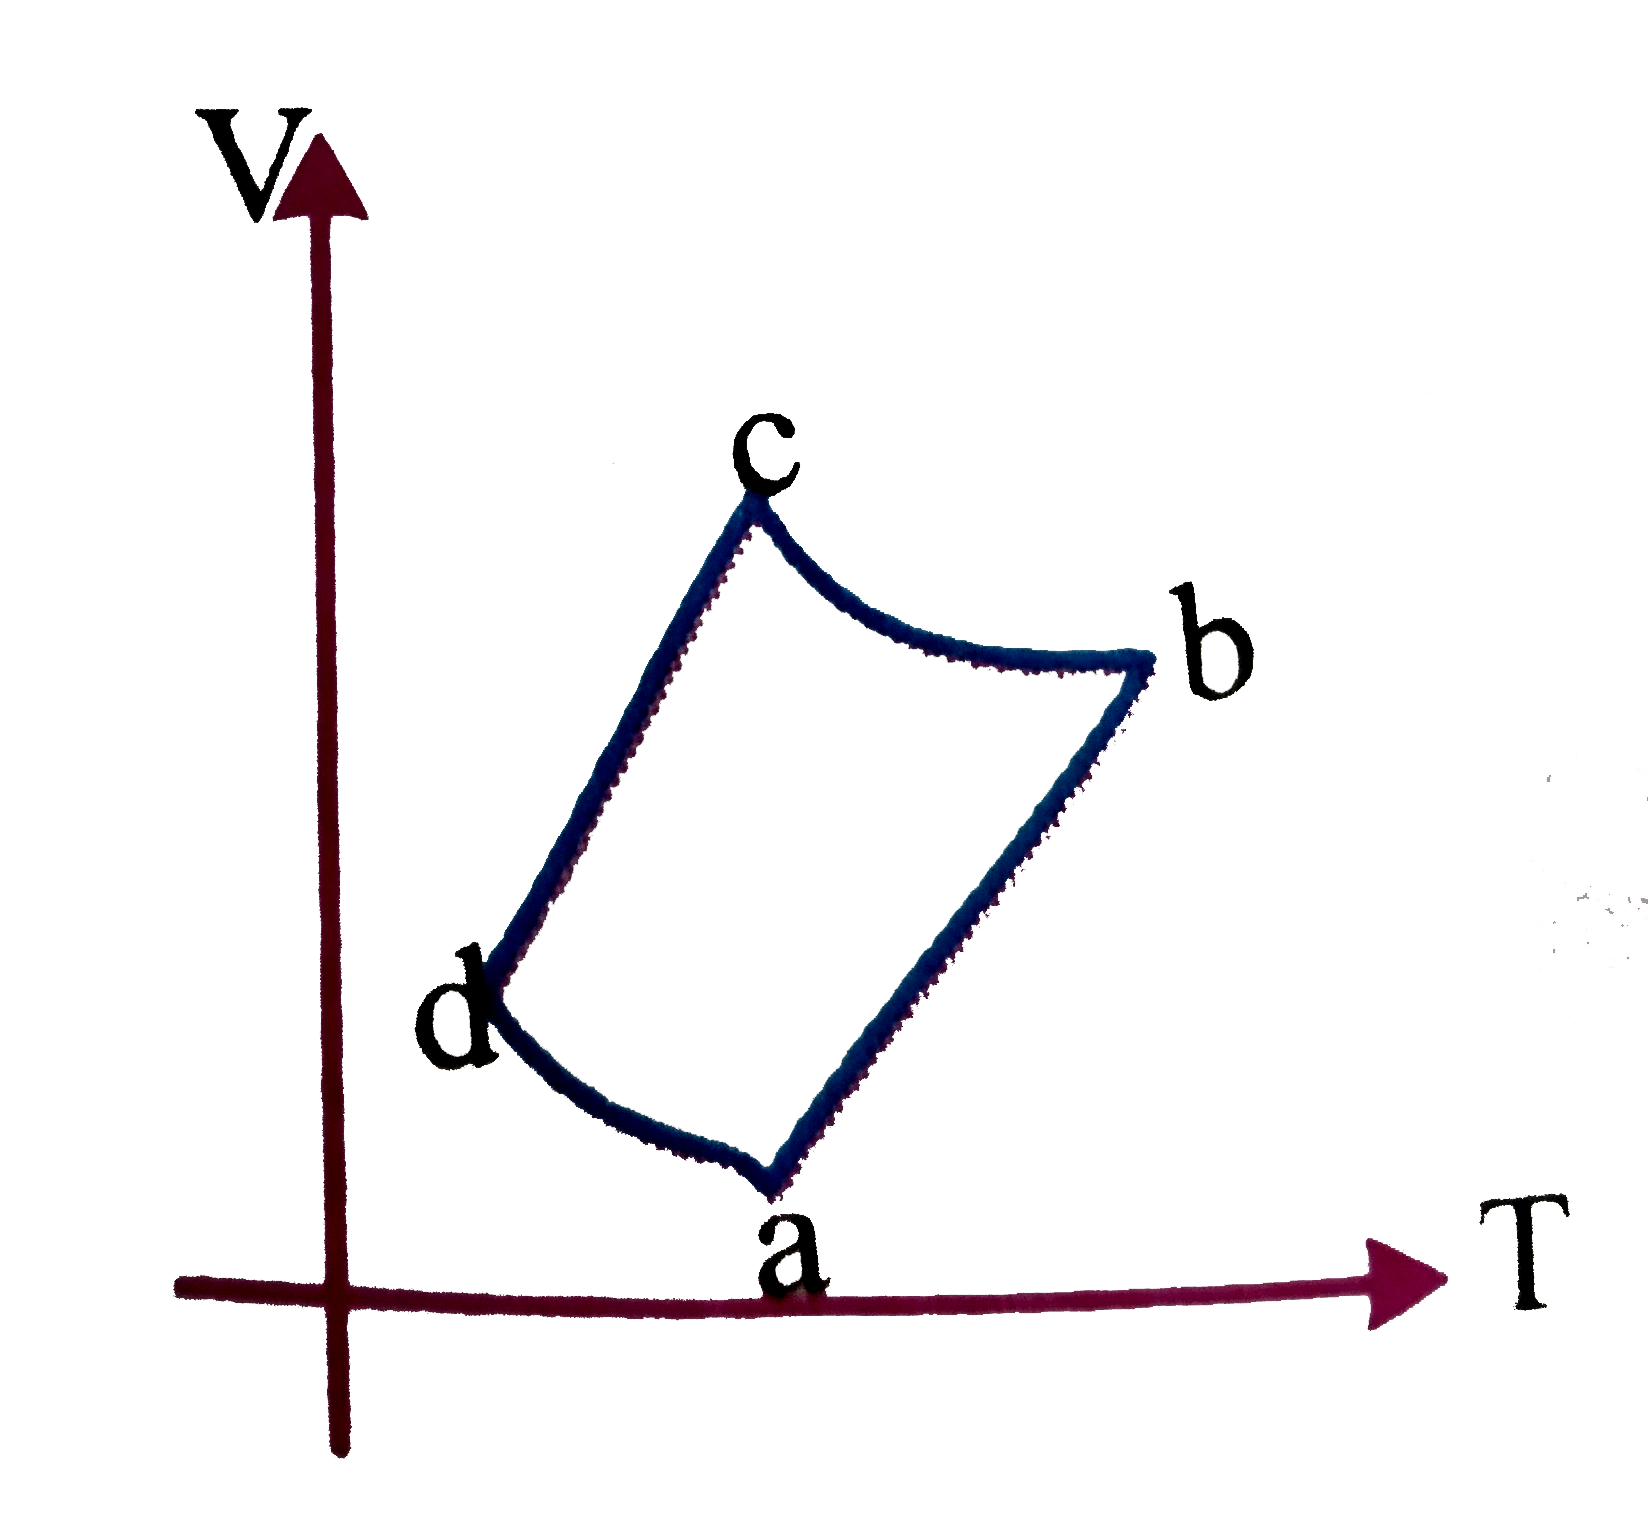
The corresponding P-V diagram for the process is(all figures are schematic and not drawn to scale)
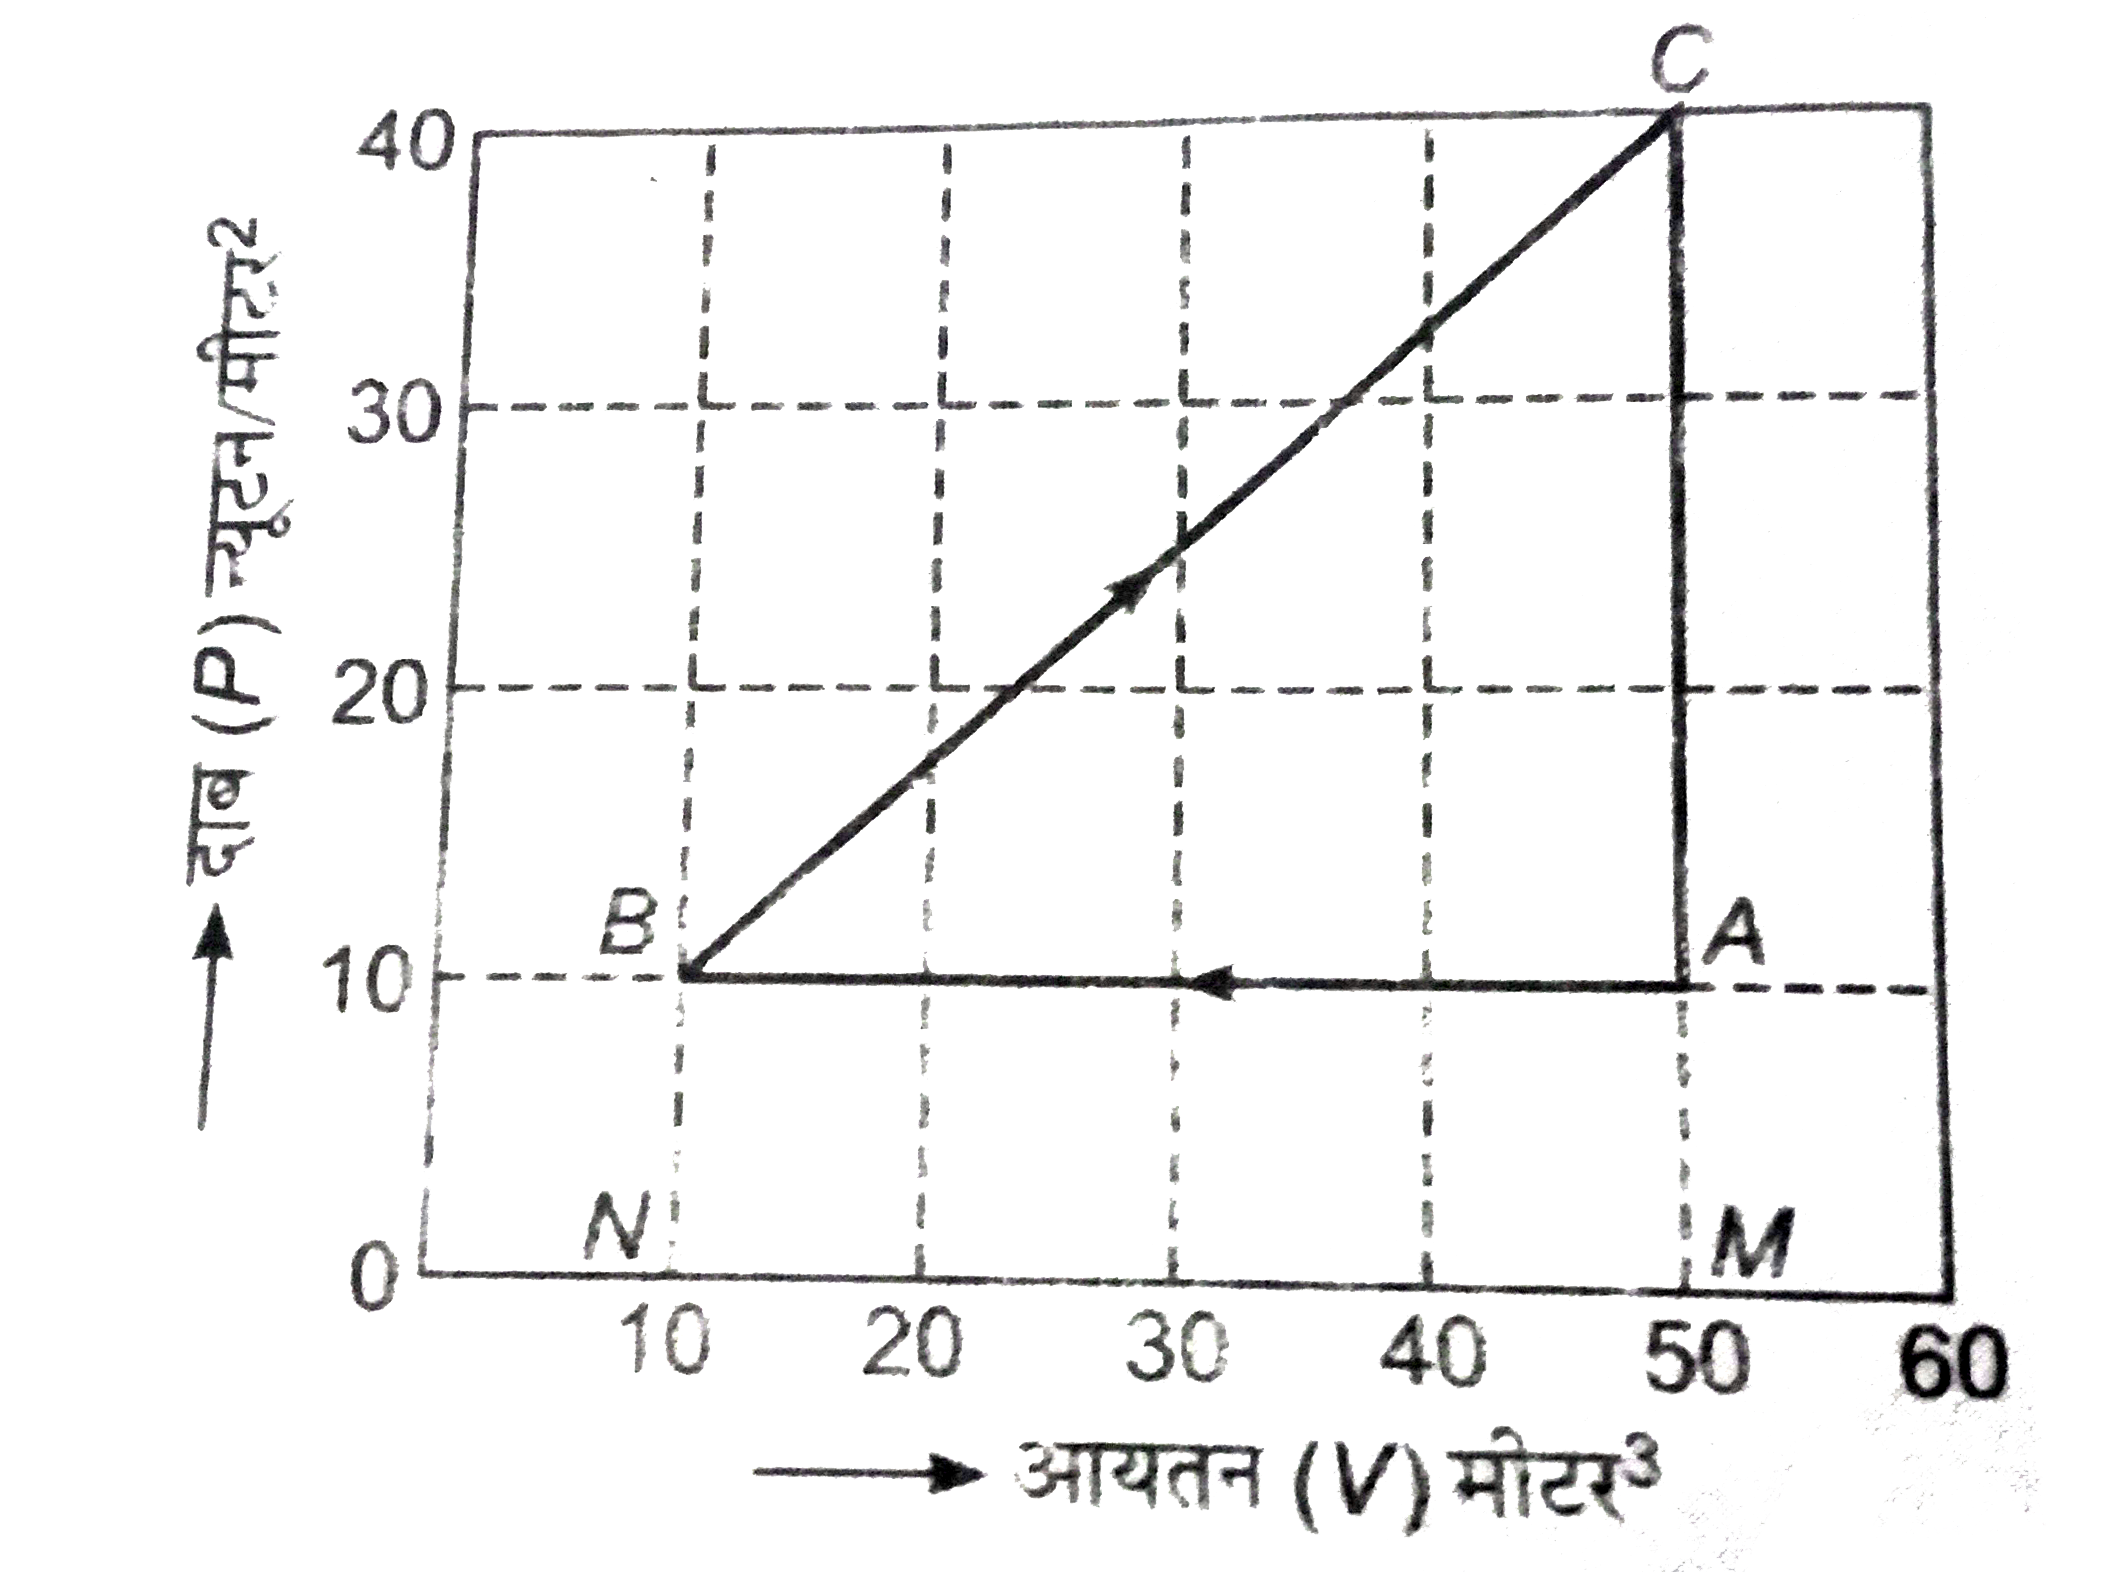
View Solutionचित्र में, किसी गैस के लिए दाब-आयतन आरेख (P-V diagram) दर्शाया गया है।
ग्राफ से ज्ञात कीजिए-
गैस को अवस्था B से C तक ले जाने में किया गया कार्य।
View SolutionAn ideal gas undergoes a cyclic process as shown in the given P-T diagram, where AC is adiabatic. The process is also represented by:
View SolutionAn ideal gas undergoes cyclic process ACBC as shown is given PV diagram The amount of work done by the gas is
View SolutionPV Diagram for ideal gas in piston cylinder assembly undergoing a thermodynamic process is shown in figure. Process is
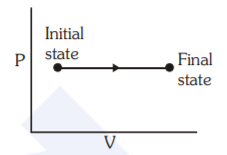
View SolutionDraw the PV diagram for Adiabatic process
View Solutionचित्र में, रद्धोम प्रक्रम में दो गैसों के लिए P-V आरेख दिखाये गये हैं। वक्र 1 व 2 क्रमशः किसके संगत है
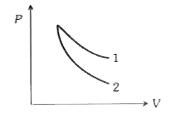
View Solutionचक्रिय प्रक्रम ABCA आरेख P-T में दर्शाया गया है। यदि इसे P-V आरेख पर प्रदर्शित किया जाये तो यह होगा

View SolutionP-V diagram of an ideal gas for a process ABC is as shown in the figure.

Change in internal energy of the gas during the process ABC
View Solutionदर्शाए गए किसी आदर्श गैस के PV आरेख पर विचार कीजिए।
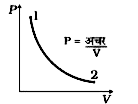 दिए गए आरेखों में से कौन-सा ग्राफ इसके संगत T-P आरेख को निरुपित करता है?
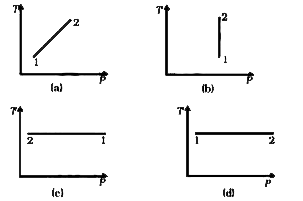
View Solution

_E01_397_S01.png)