Draw the PV diagram for Adiabatic processSolution in Tamil
Step by step video & image solution for Draw the PV diagram for Adiabatic process by Physics experts to help you in doubts & scoring excellent marks in Class 11 exams.
Updated on:21/07/2023Topper's Solved these Questions
- SAMPLE PAPER - 19 (UNSOLVED)BOOK - FULL MARKSCHAPTER - SAMPLE PAPER - 19 (UNSOLVED)EXERCISE - PART - IV
10 Videos
- SAMPLE PAPER - 19 (UNSOLVED)BOOK - FULL MARKSCHAPTER - SAMPLE PAPER - 19 (UNSOLVED)EXERCISE - PART -II
9 Videos
- SAMPLE PAPER - 18 (UNSOLVED)BOOK - FULL MARKSCHAPTER - SAMPLE PAPER - 18 (UNSOLVED)EXERCISE - PART - IV
10 Videos
- SAMPLE PAPER - 20 (SOLVED)BOOK - FULL MARKSCHAPTER - SAMPLE PAPER - 20 (SOLVED)EXERCISE - PART-IV
10 Videos
Similar Questions
Assuming that the frequency γ of a vibrating string may depend upon (i) applied force (F) (ii) length (l) (iii) mass per unit lengt (m), prove that γ∝1l√Fm using dimensional analysis.
View SolutionDefine unit of a physial quantity.
View SolutionExplain in detail the various types of errors.
View SolutionWrite the rules of ''Rounding off'' with example.
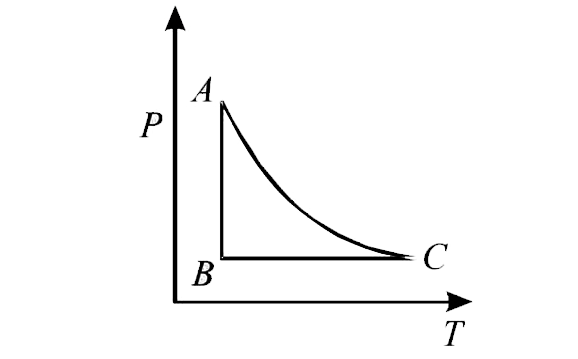
View SolutionThe PT diagram for an ideal gas is shown in the figure, where AC is an adiabatic process, find the corresponding PV diagram.

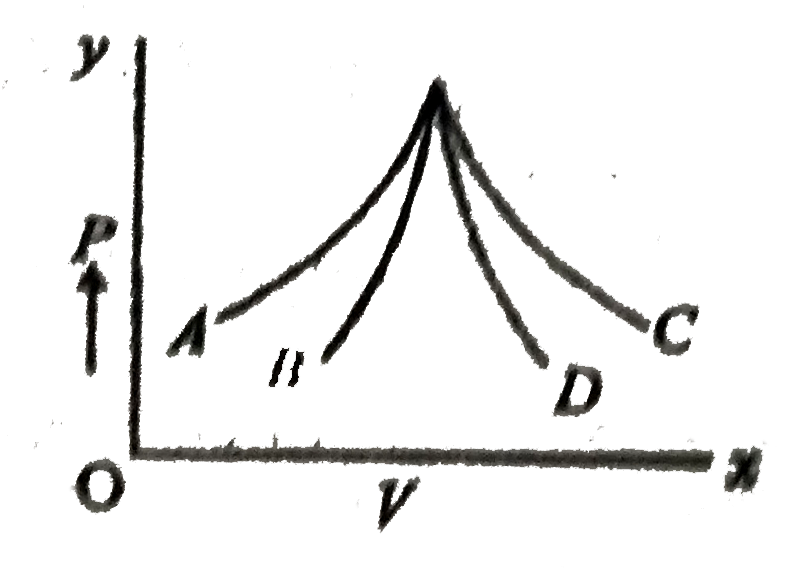
View SolutionFigure shows four PV diagrams. Which of these curves represent isothermal and adiabatic processes?

View SolutionAssertion: P v/s 1V graph is straight line for adiabatic process.
Reason: PV=constant for adiabatic process.
View SolutionProve that pV ^(gamma ) = constant in adiabatic process .
View SolutionHow is a process represented on a pV -diagram?
View SolutionDefine the following terms: (a) Isothermal process (b) adiabatic process (c) isobaric proces (d) isochoric process.
View SolutionCan PV = RT be described with an isothermal or an adiabatic process ?
View SolutionWhat is ‘isobaric change’ ? Draw the PV diagram.
View SolutionDraw the diagram when PV is potted against P?

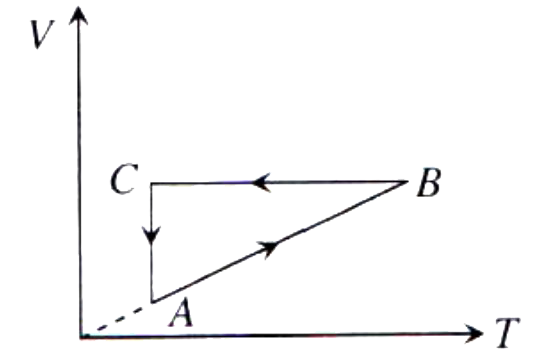
View Solutionएक चक्रीय प्रक्रम ABCA को V - T आरेख में दिखाया गया है। प्रक्रम का P-V आरेख होगा

View SolutionThe PT diagram for an ideal gas is shown in the figure, where AC is an adiabatic process, find the corresponding PV diagram.

View Solution
