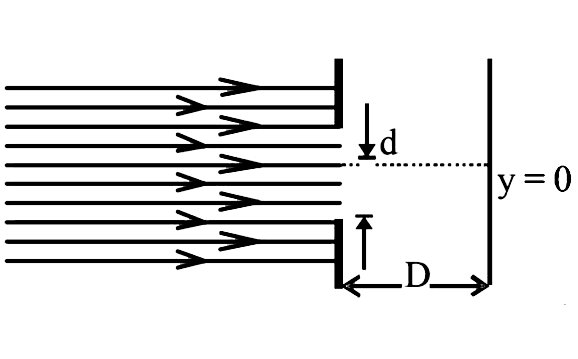
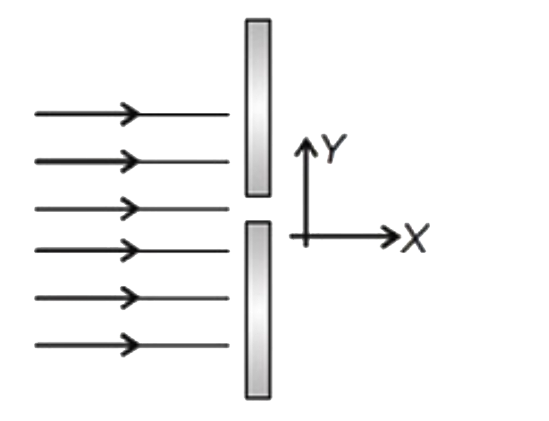
In an experiment, electrons are made to pass through a narrow slit of width d comparable to their de Broglie wavelength. They are detected on a screen at a distance D from the slit (see figure).<br>

Which of the following graphs can be expected to represent the number of electrons N detected as a function of the detector position y (y=0 corresponds to the middle of the slit ).Solution in Gujrati
_E01_230_O01.png)
_E01_230_O02.png)
_E01_230_O03.png)
_E01_230_O04.png)
The correct Answer is:D
Step by step video & image solution for In an experiment, electrons are made to pass through a narrow slit of width d comparable to their de Broglie wavelength. They are detected on a screen at a distance D from the slit (see figure). Which of the following graphs can be expected to represent the number of electrons N detected as a function of the detector position y (y=0 corresponds to the middle of the slit ). by Physics experts to help you in doubts & scoring excellent marks in Class 12 exams.
Updated on:21/07/2023Topper's Solved these Questions
- SIMPLE HARMONIC MOTIONBOOK - ALLEN CHAPTER - SIMPLE HARMONIC MOTIONEXERCISE - Exercise-05 [A]
39 Videos
- SIMPLE HARMONIC MOTIONBOOK - ALLEN CHAPTER - SIMPLE HARMONIC MOTIONEXERCISE - Exercise-05 [B]
12 Videos
- SIMPLE HARMONIC MOTIONBOOK - ALLEN CHAPTER - SIMPLE HARMONIC MOTIONEXERCISE - Exercise-04 [A]
20 Videos
- RACEBOOK - ALLEN CHAPTER - RACEEXERCISE - Basic Maths (Wave Motion & Dopplers Effect) (Stationary waves & doppler effect, beats)
25 Videos
- TEST PAPERBOOK - ALLEN CHAPTER - TEST PAPEREXERCISE - PHYSICS
4 Videos
Similar Questions
If a spring has time period T, and is cut into (n) equal parts, then the time period of each part will be.
View SolutionA particle of mass (m) is executing oscillations about the origin on the x axis. Its potential energy is V(x)=k|x|3 where k is a positive constant. If the amplitude of oscillation is a, then its time period (T) is.
View SolutionA particle simple harmonic motion completes 1200 oscillations per minute and passes through the mean position with a velocity 3.14ms−1. Determine displacement of the particle from its mean position. Also obtain the displacement equation of the particle if its displacement be zero at the instant t=0.
View SolutionThe frequency of a radar is 780 MHz. After getting reflected from an approaching aeroplane, the apparent frequency is more than the actual frequency by 2.6 kHz. The aeroplane has a speed of
View SolutionChoose the correct statement:
View SolutionTwo coherent narrow slits emitting sound of wavelength lamda in the same phase are placed parallel to each other at a small separation of 2lamda . The sound is detected by moving a detector on the screen sum at a distance D(gtgtlamda) from the slit S_1 as shown in figure. Find the distance x such that the intensity at P is equal to the intensity at O.
View SolutionWave property of electrons implies that they will show diffraction effects. Davission and Germer demonstrated this by diffracting electrons from crystals. The law governing the diffraction from a crystal is obtained by requiring that electron waves reflected from the planes of atoms in a crystal interfere constructively (see figure) In an experiment, electrons are made to pass through a narrow slit of width 'd' comparable to either de-Broglie wavelength. They are detected on a screen at a distance 'D' from the slit The following graphs that can be expected to represent the number of electrons 'N' detected as a function of the detector position 'y' ( y=0 corresponds to the middle of the slit) is
View SolutionLight of wavelength lambda is incident on a slit of width d and distance between screen and slit is D. Then width of maxima and width of slit will be equal if D is ––
View SolutionA light of wavelength λ falls on a narrow slit of width d.A diffraction fringe is formed on a screen placed at distance D from the slit. If the linear width of the central maximum equals to the width of the slit, will be the value of D?
View SolutionA parallel beam of electrons , travelling in x - direction , falls on a slit of width d (see the figure) . If after passing the slit, an electron acquires momentum Py in the y direction, then for a majority of electrons passing through the slit , (h is Planck's constant)

View Solutionचित्रनुसार एक प्रयोग में इलेक्ट्रोनो को उनकी डी ब्रोग्ली तरंगदैर्घ्य की कोटि d चौड़ाई की एक सकीर्ण स्लिट से गुजारा जाता है तथा वे इस स्लिट से D दूरी पर स्थित पर्दे पर संसूचित किये जाते हैं | पर्दे पर प्राप्त तीव्रता प्रतिरूप होगा |

View SolutionA parallel beam of electrons travelling in X-direction falls on a slit of width d (see figure). If after passing the slit, an electron acquires momentum p_y in the Y-direction, then for a majority of electrons passing through the slit (h is Planck's constant):
View SolutionIn Young's double slit experiment if d, D and λ represent the distance between the slits, the distance of the screen from the slits and wavelenfth of light used respectively, then the band width is width is inversely proportional to
View SolutionA parallel beam of electrons travelling in x-direction falls on a slit of width d (see figure). If after passing the slit, an electron acquires momentum py in the y-direction then for a majority of electrons passing through the slit (h is Planck's constant):

View SolutionIn Young's double-slit experiment, white light is used. The separation between the slits is d. The screen is at a distance D (D » d) from the slits. Some wavelengths are missing exactly in front of one slit. These wavelengths are
View SolutionIn an experiment, the electrons pass through a narrow slit of width d, which is equivalent to their de Broglie wavelength. They are communicated on the screen placed at a distance D from the slit Of these, the number of electrons identified from the graph can be expected to represent the position of the N detector as a function of y (y = 0 corresponds to the center of the slit).
View Solution
