Draw a-x graph corresponding to given v-x graph .
 Solution in Gujrati
The correct Answer is:15.40 to 15.70
Step by step video & image solution for Draw a-x graph corresponding to given v-x graph . by Maths experts to help you in doubts & scoring excellent marks in Class 12 exams.
Updated on:21/07/2023Topper's Solved these Questions
- TEST PAPERBOOK - ALLEN CHAPTER - TEST PAPEREXERCISE - CHEMISTRY SECTION-I
20 Videos
- TEST PAPERBOOK - ALLEN CHAPTER - TEST PAPEREXERCISE - CHEMISTRY SECTION-II
16 Videos
- TEST PAPERBOOK - ALLEN CHAPTER - TEST PAPEREXERCISE - PHYSICS SECTION-I
20 Videos
- SEQUENCE AND PROGRESSIONBOOK - ALLEN CHAPTER - SEQUENCE AND PROGRESSIONEXERCISE - Exercise (JA)
10 Videos
- TEST PAPERSBOOK - ALLEN CHAPTER - TEST PAPERSEXERCISE - MATHEMATICS
136 Videos
Similar Questions
Which of the following statements is/are incorrect -
View SolutionThe molar mass of a substance , each molecule of which contains 9 C atoms , 13 H-atoms and 3.32×10⁻²³ g of other component is (NA=6.022×10²³)
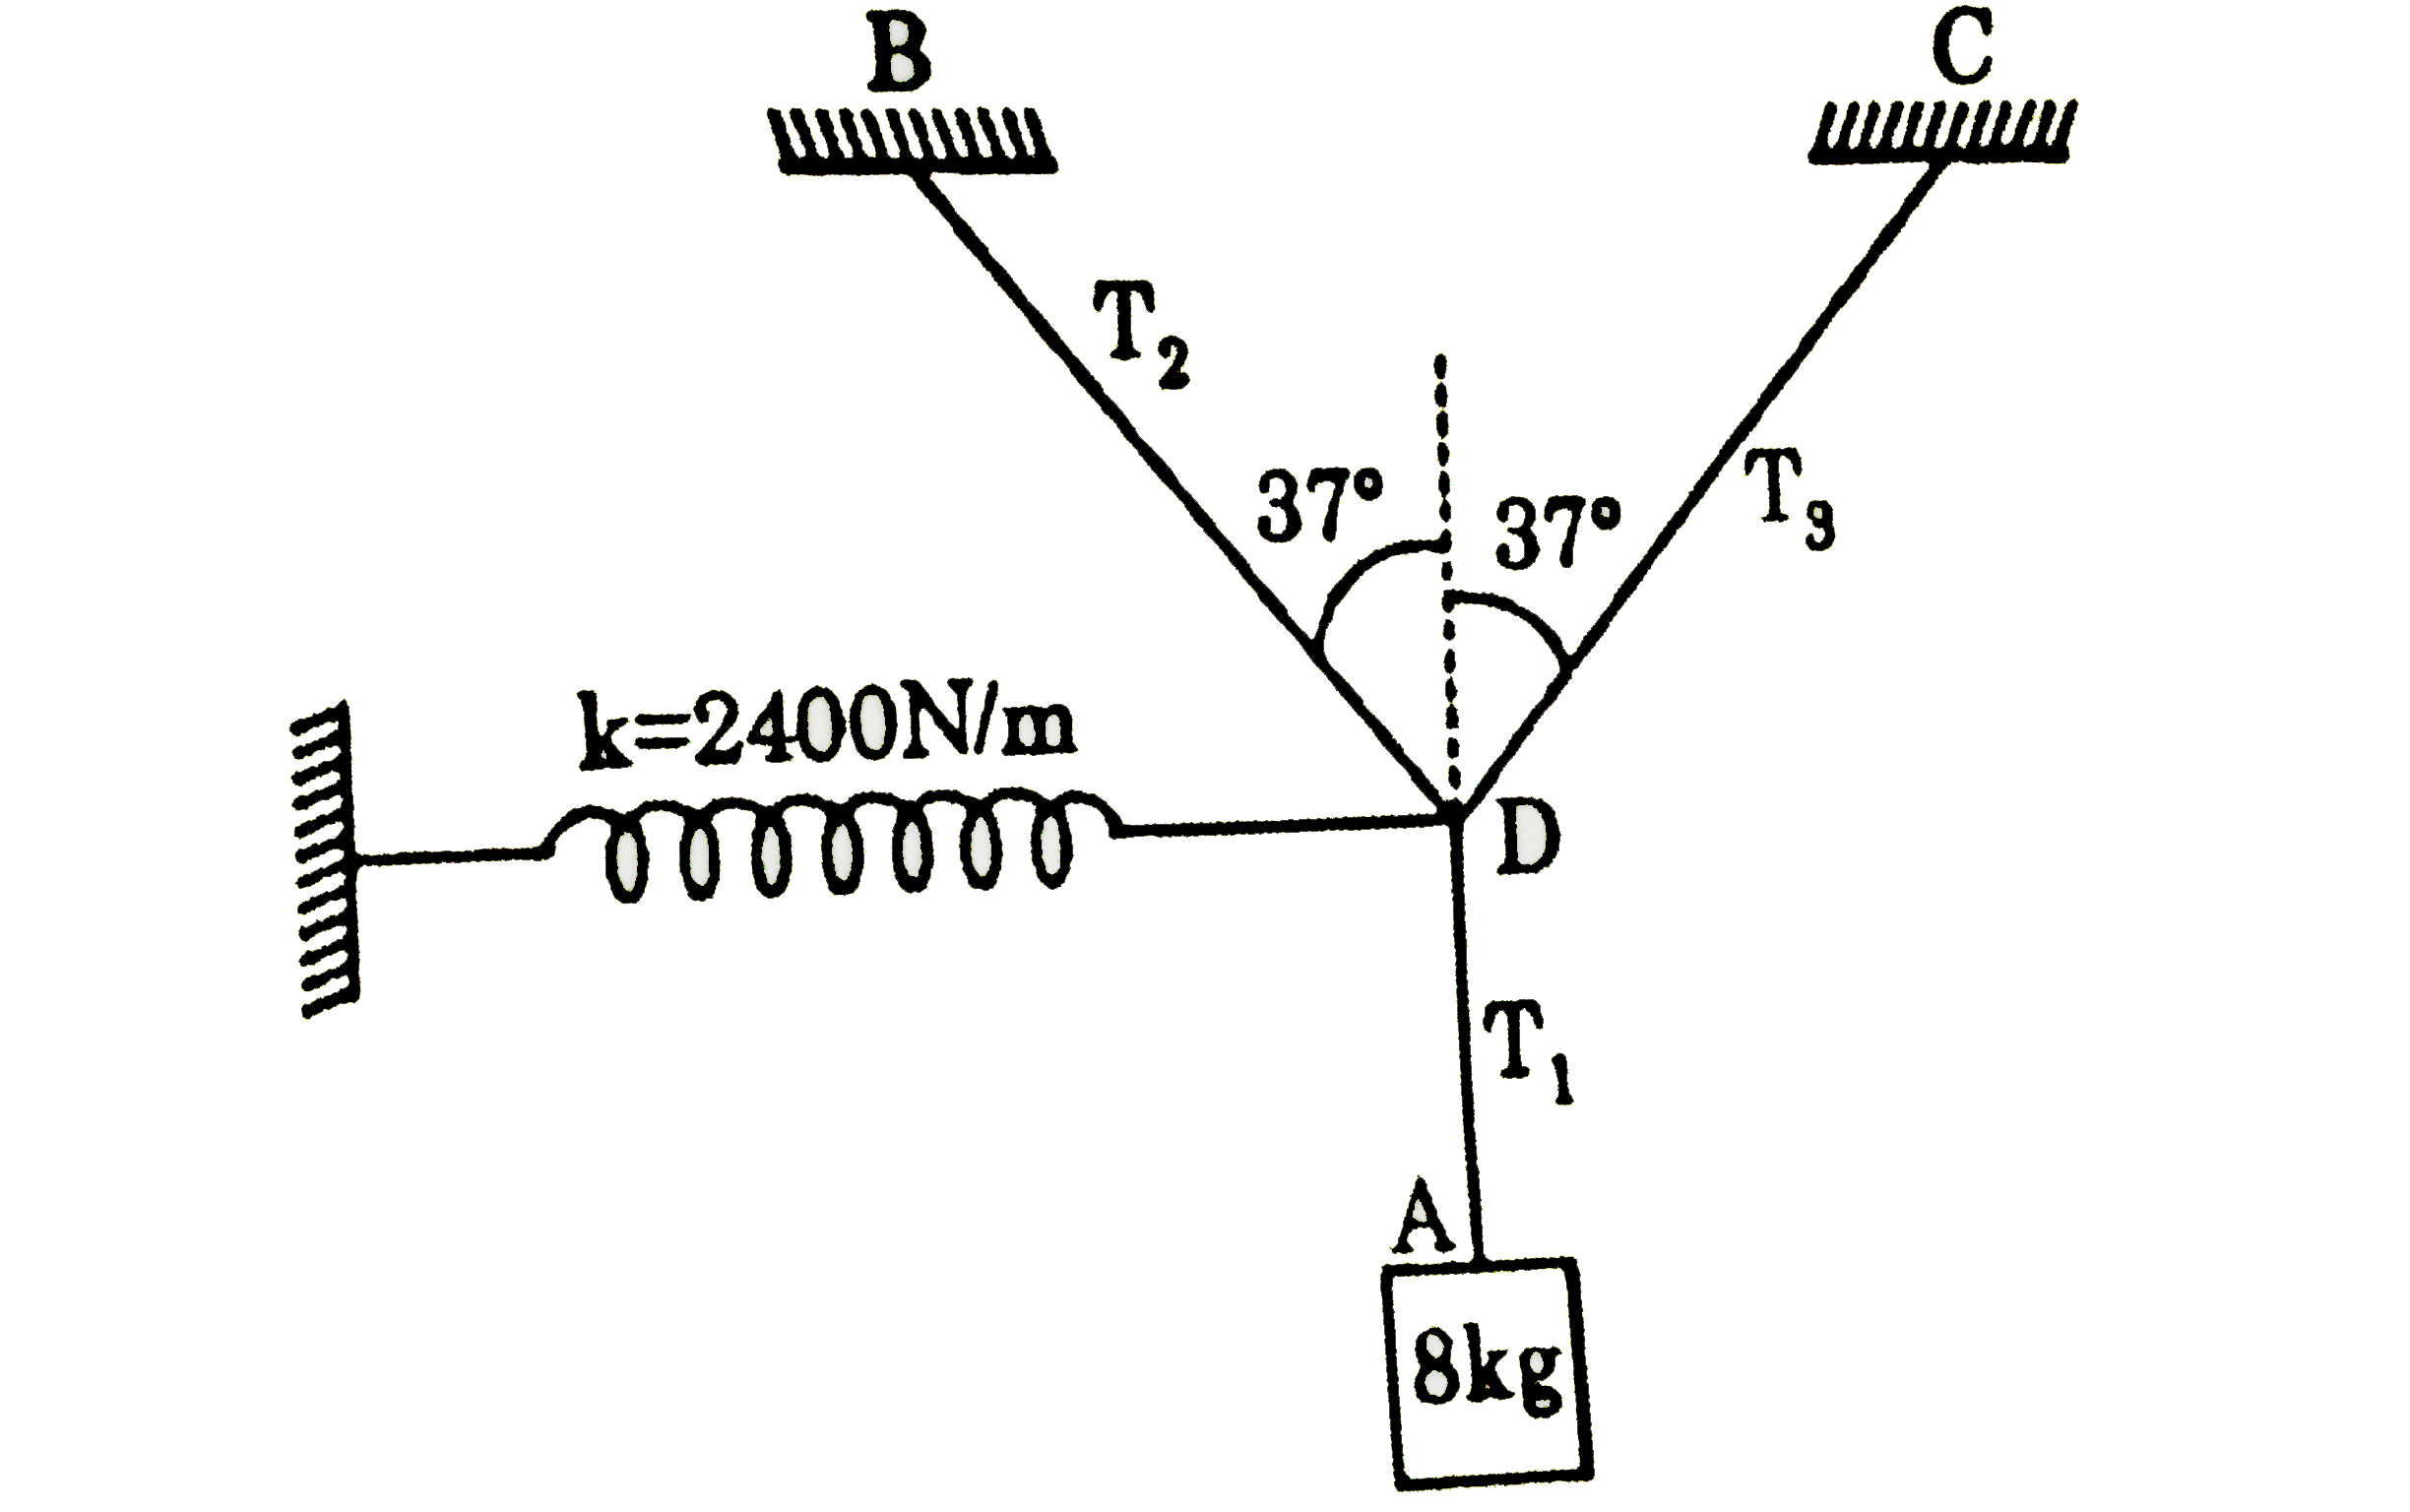
View SolutionGiven arrangement is in equilibrium and elongation in spring is 1cm. Tension in string AD is T1, in string BD is T2 and is string CD is T3.Choose correct values of T1,T2andT3:

View SolutionThe minimum value of the sum of real numbers a−5,a−4,3a−3,1,a8 and a10 with a>0 is
View SolutionIf a be sum of the odd numbered terms and b the sum of even numbered terms of the expansion (1+x)n,n ε N then (1−x2)n is equal to
View SolutionDetermine the point of symmetry of a regular hexagon.
View SolutionDtermine the images of the following figure about the given line :
View SolutionDraw the bisector of ∠AOB=58∘
ltimg src="https://d10lpgp6xz60nq.cloudfront.net/physics_images/PS_MATH_VII_C05_S01_009_Q01.png" width="80%"gt
View SolutionMatch the following Column A to Column B

View SolutionMatch the following Column A to Column B

View SolutionMatch the following Column A to Column B

View SolutionFind the area of the figure given below.

View SolutionThe area of the shaded part in the figure given below is ______.

View SolutionThe inequation represented by the graph given below is :
View SolutionThe inequation that best describes the graph given below is _________
View SolutionThe inequation that best describes the following graph is _________
View Solution
