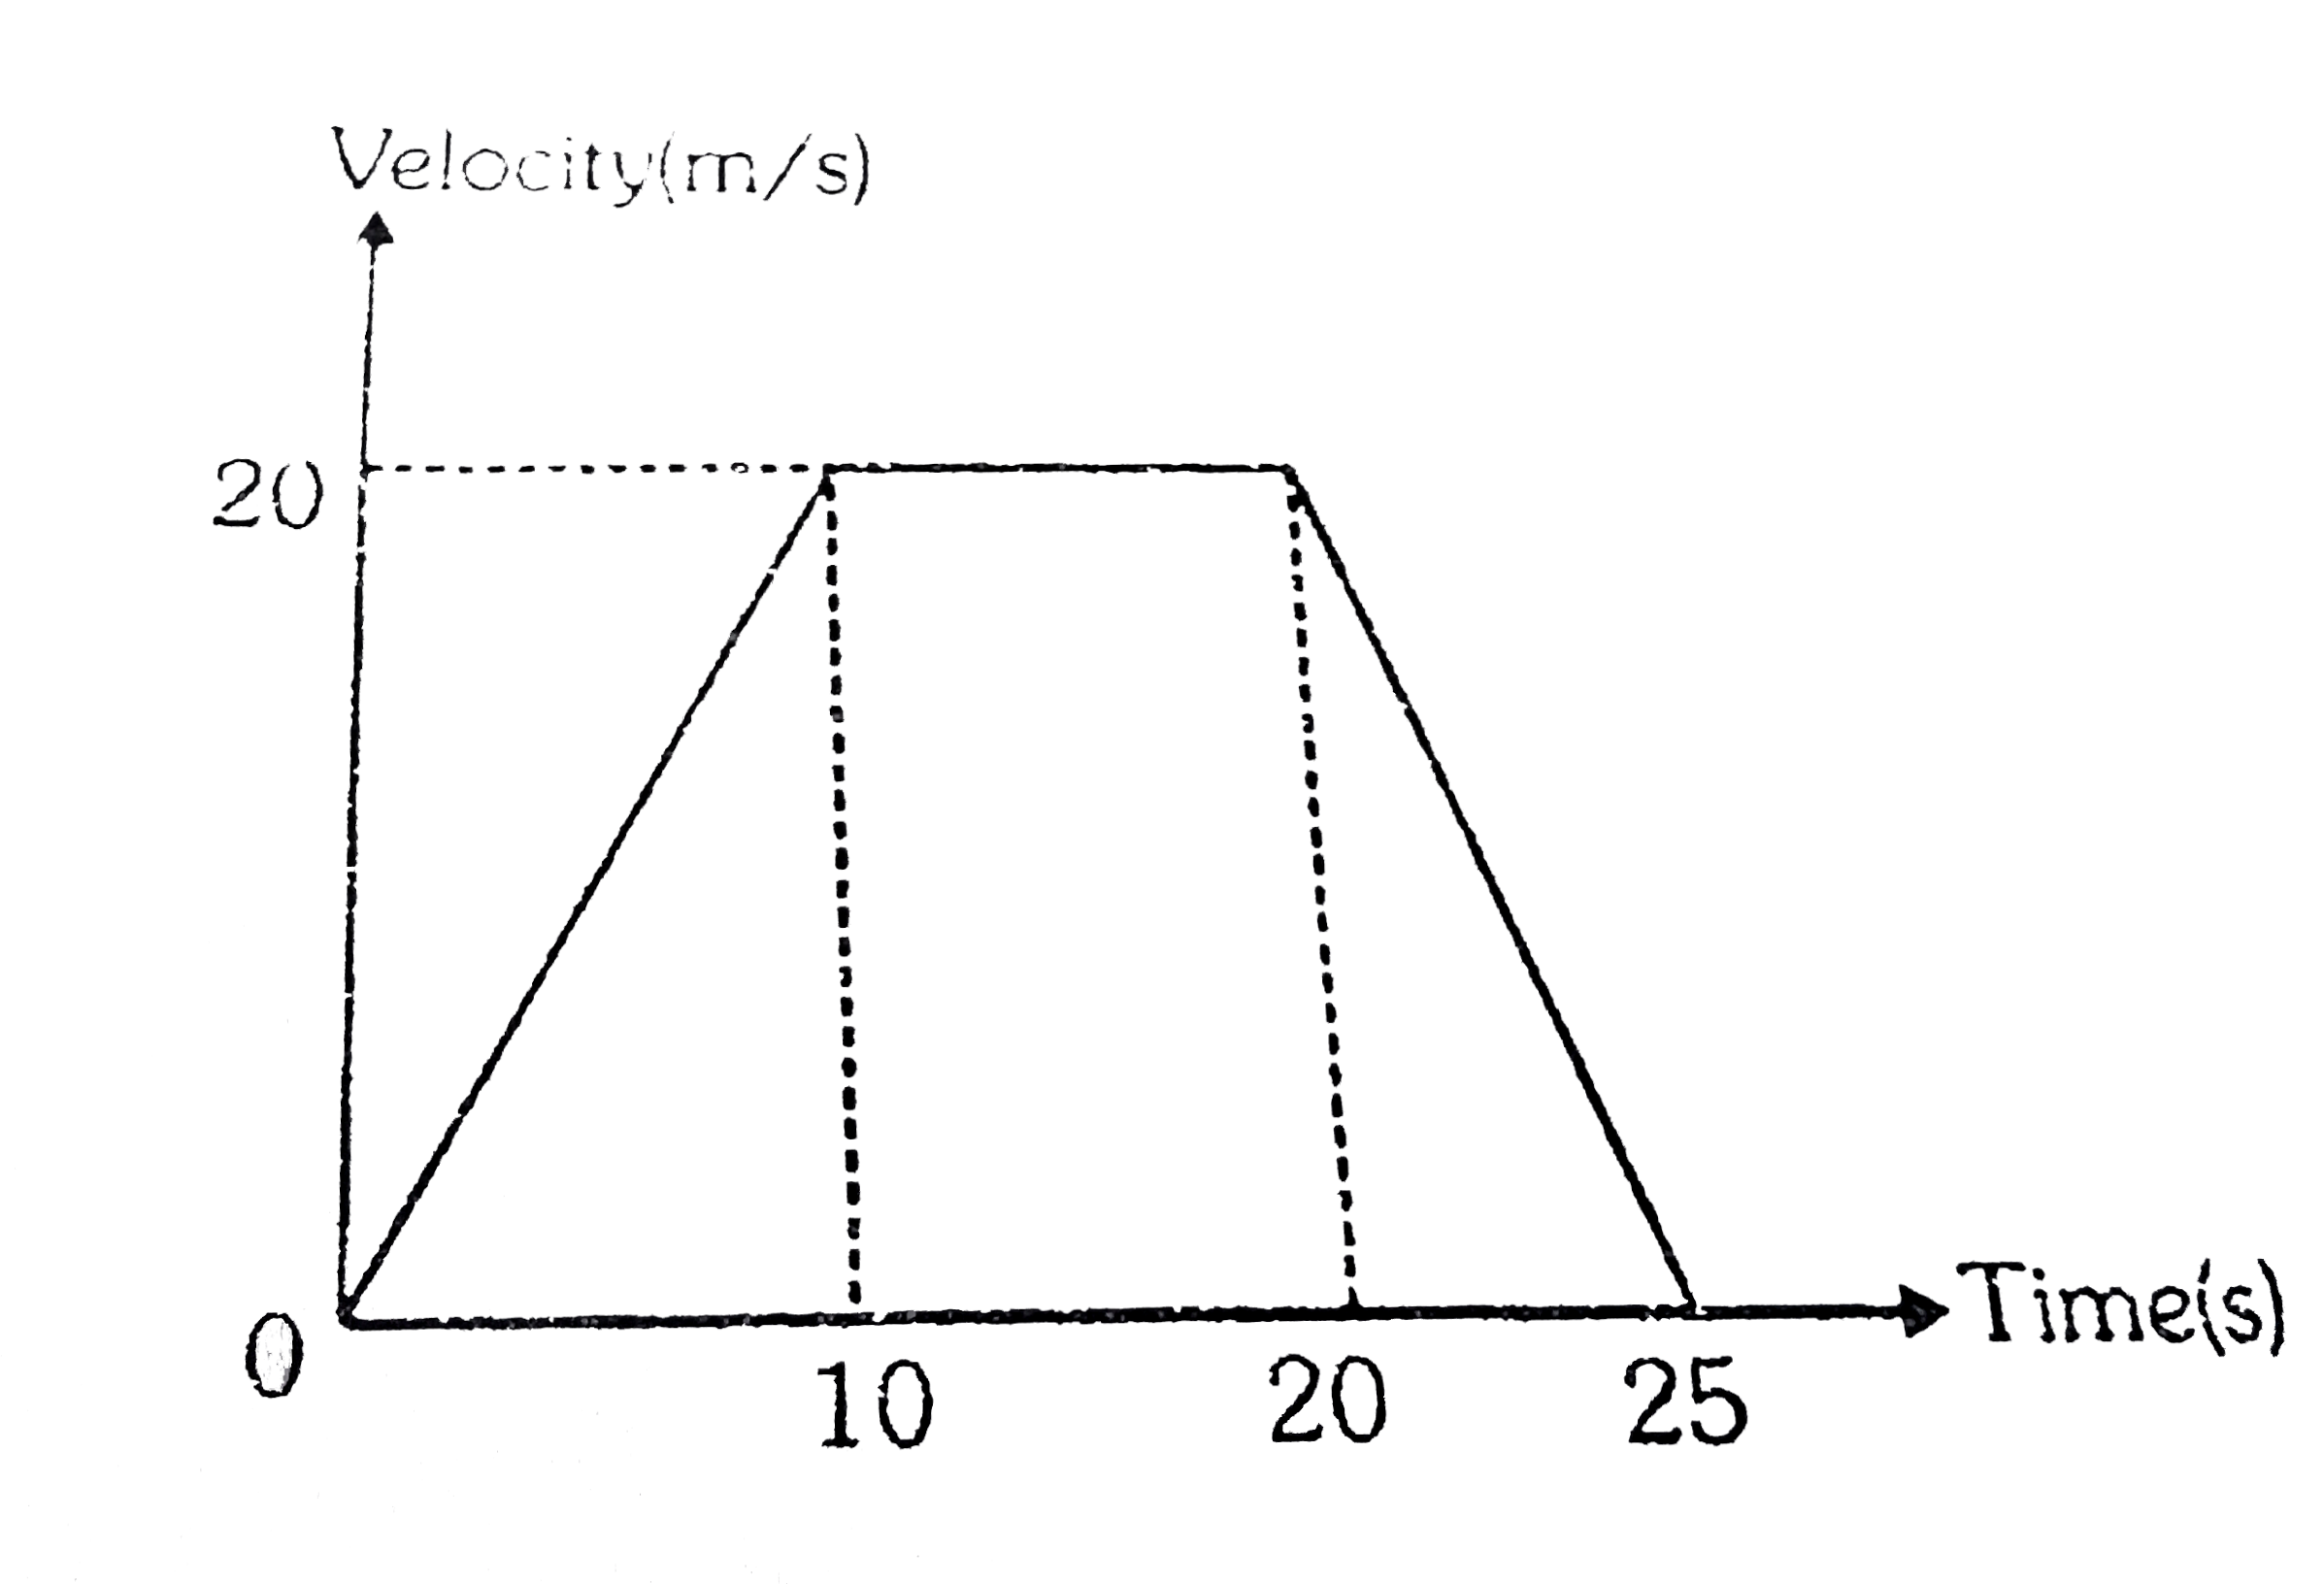
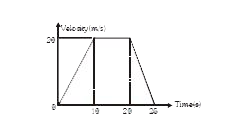
The velocity-time graph of a car moving along a straight road is shown in figure. The average velocity of the car is first 25 seconds is
 Solution in Gujrati
20m/s
14m/s
10m/s
17.5m/s
The correct Answer is:2
Average velocity = 25∫0vdt25−0=Area of v-t graph between t=0 to t=25 s25=125[(25+102)(20)]=14m/s
Topper's Solved these Questions
- BASIC MATHEMATICS USED IN PHYSICS &VECTORS BOOK - ALLEN CHAPTER - BASIC MATHEMATICS USED IN PHYSICS &VECTORS EXERCISE - BEGINNER S BOX 1
2 Videos
- BASIC MATHEMATICS USED IN PHYSICS &VECTORS BOOK - ALLEN CHAPTER - BASIC MATHEMATICS USED IN PHYSICS &VECTORS EXERCISE - BEGINNER S BOX 2
3 Videos
- CENTRE OF MASSBOOK - ALLEN CHAPTER - CENTRE OF MASSEXERCISE - EXERCISE-V B
19 Videos
Similar Questions
Find the values of :
tan(−30∘)
View SolutionDistance between two points (8,-4) and (0,a) is 10. All the values are in the same unit of length. Find the possitive value of a.
View SolutionTwo particles of masses m1 and m2 in projectile motion have velocities →v1 and →v2 , respectively , at time t=0. They collide at time t0. Their velocities become →v'1 and →v'2 at time 2t0 while still moving in air. The value of ∣∣∣(m1→v'1+m2→v'2)−(m1→v1+m2→v2)∣∣∣
View SolutionFigure shows the velocity time graph of a particle moving along straight line (v is m/s and t is in second). It average velocity in 20 seconds will be: .
View SolutionA car is moving on a straight road. The velocity of the car varies with time as shown in the figure. Initially (at t=0), the car was at x=0 , where, x is the position of the car at any time 't'. The displacement time graph will be best represented by :-
View SolutionA car is moving on a straight road. The velocity of the car varies with time as shown in the figure. Initially (at t=0), the car was at x=0, where, x is the position of the car at any time 't'.
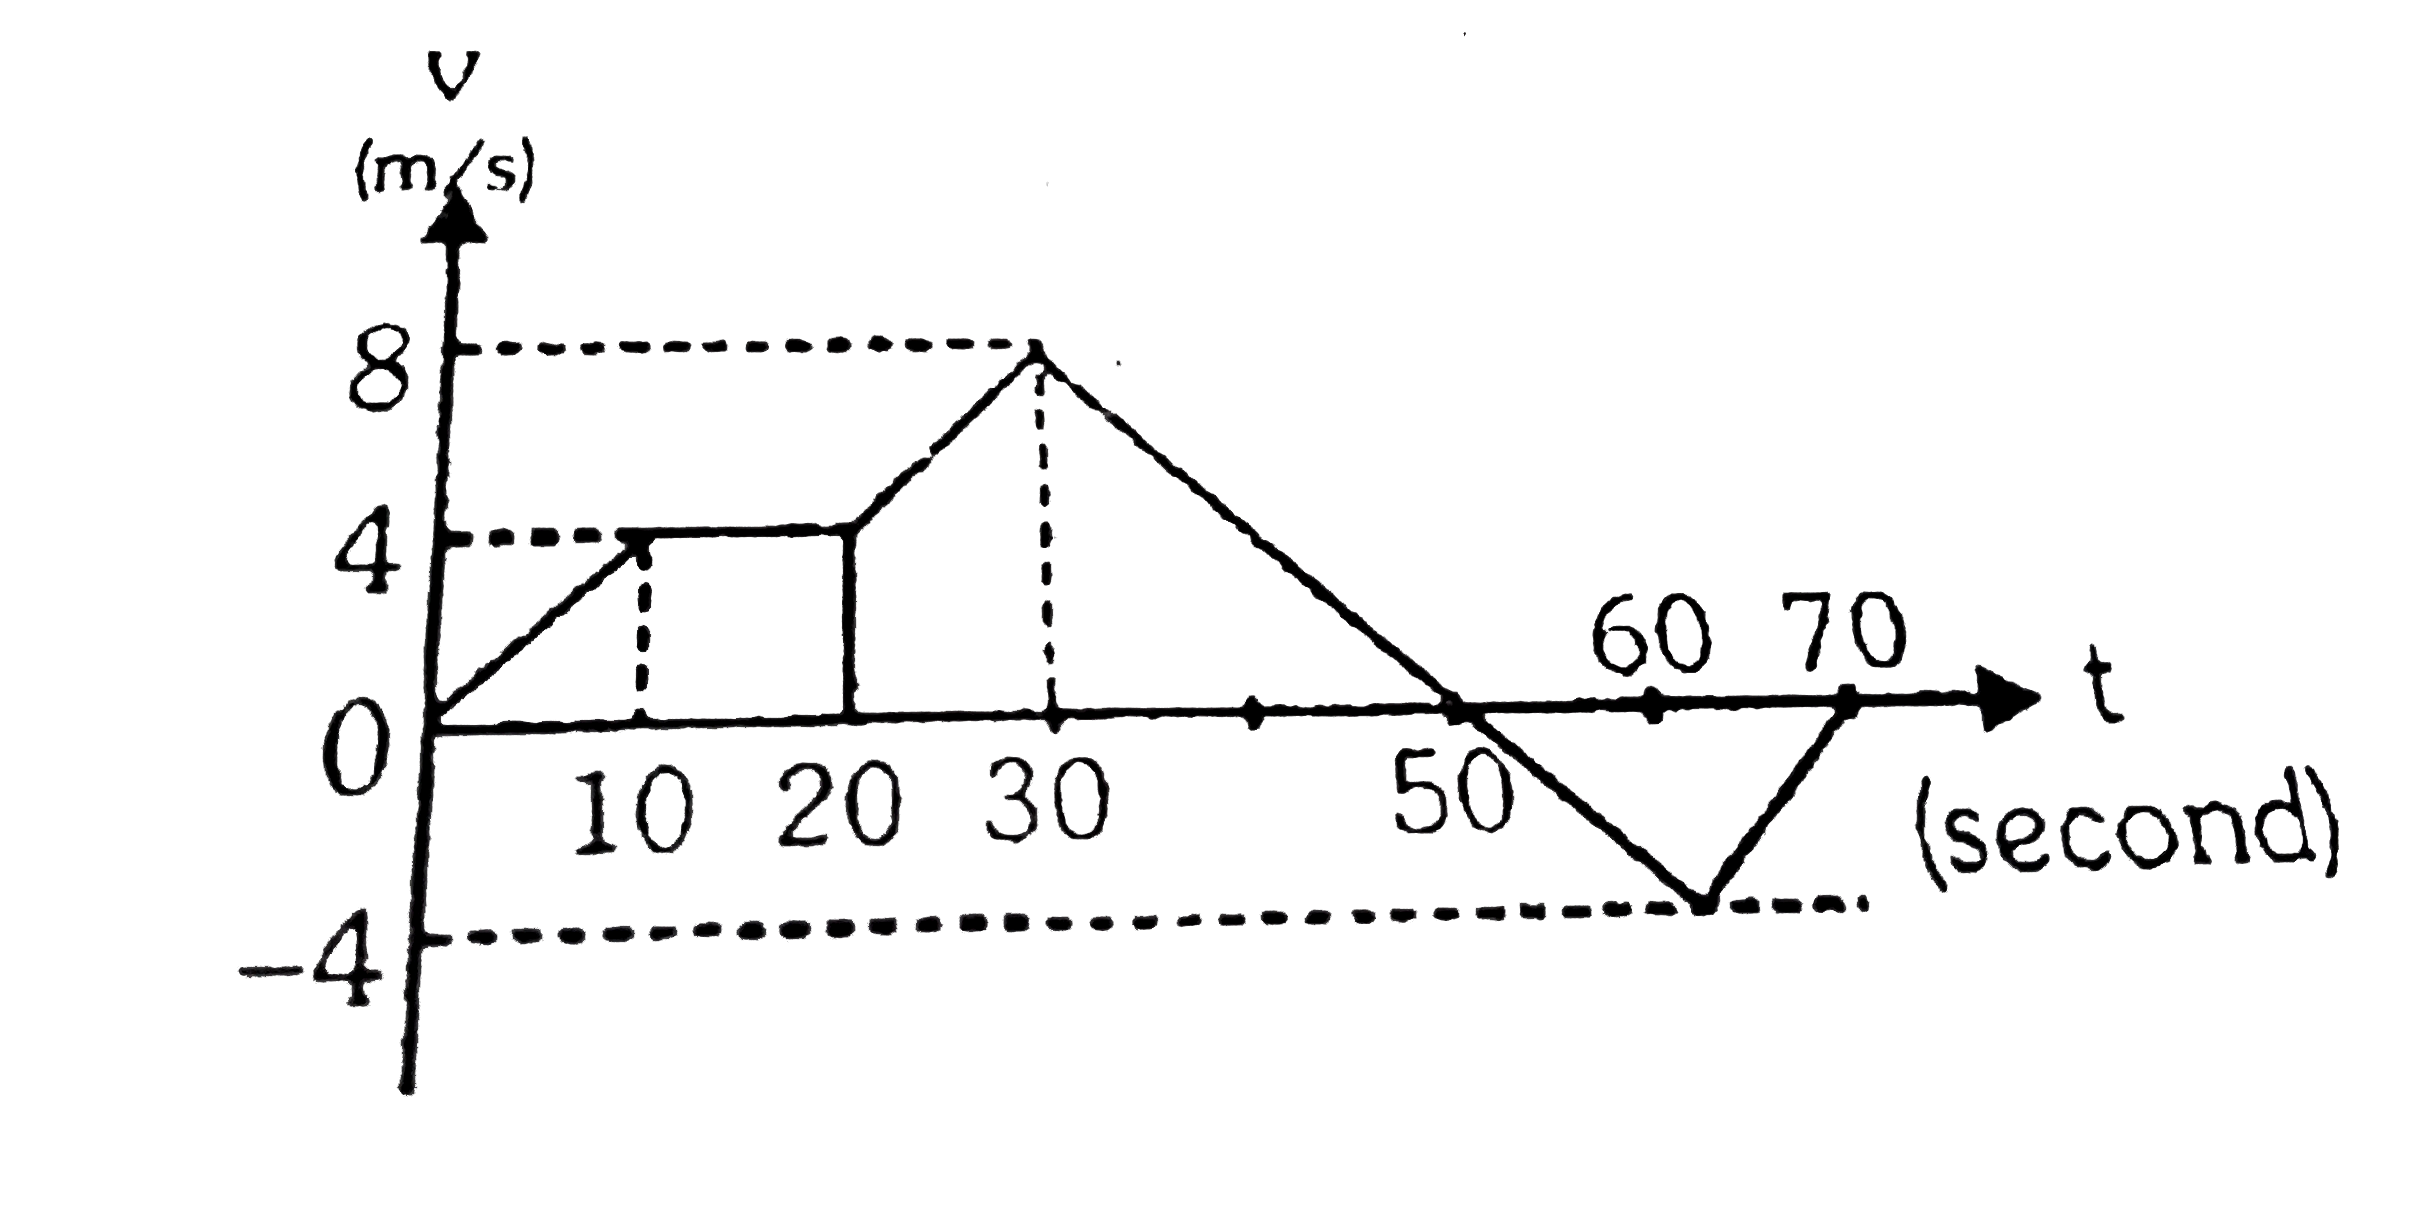
The maximum displacement from the starting position will be :-
View SolutionA car moves along a straight path with variable velocity as shown in the figure. When the car is at possiting A, its velocity is 10 m s^(-1) and when it is at position B, its velocity is 20 m s^(-1) . If the car takes 5 seconds of time to move from A to B, find the acceleration of the car.
View SolutionThe following figure represents the velocity-time graph of a moving car on a road:
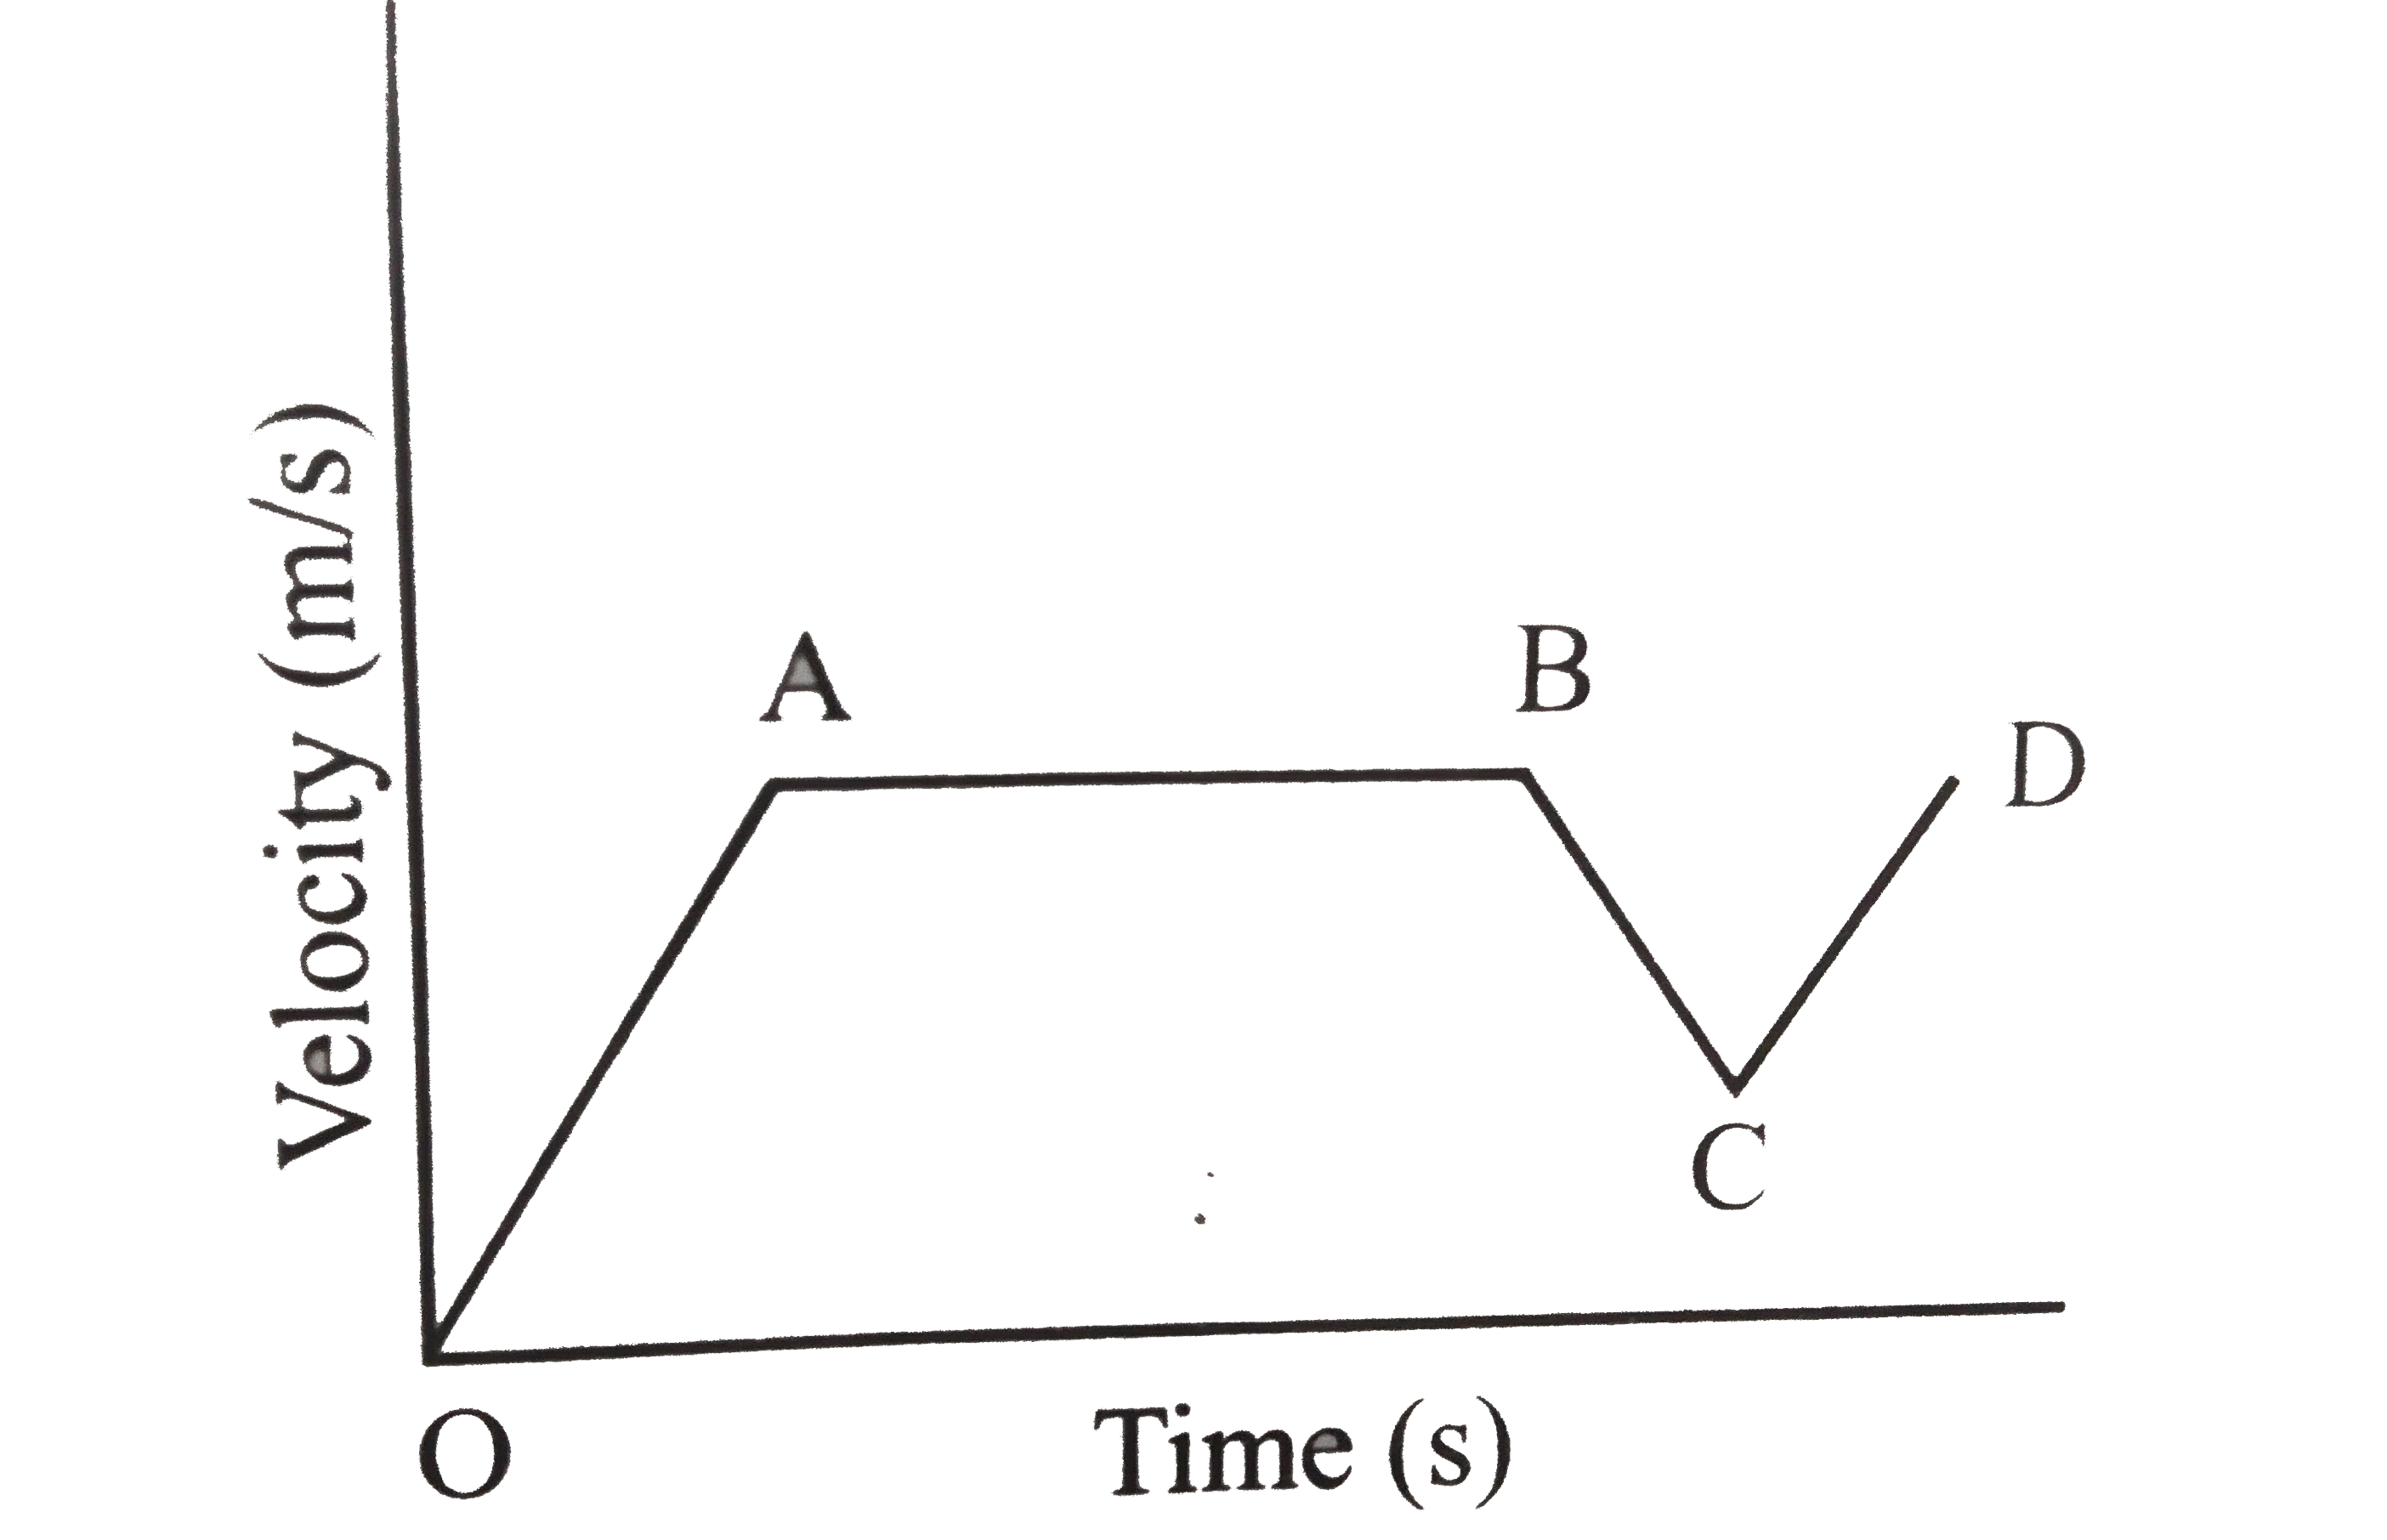
Which segment of the graph represents the retardation?
View SolutionA car completes the first half of its journey with a velocity υ1 and the rest half with a velocity υ2. Then the average velocity of the car for the whole journey is :
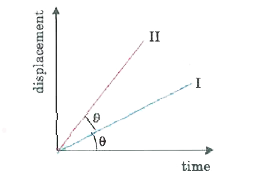
View SolutionFrom the given displacement - time graph of two cars moving on a straight road , which of the following is moving with greater velocity ?
View SolutionA car travels from rest with a constant acceleration 'a' for 't' seconds. What is the average speed of the car for its journey if the car moves along a straight road?
View SolutionA car travels from rest with a constant acceleration 'a' for 't' seconds. What is the average speed of the car for its journey if the car moves along a straight road?
View Solutionसीधी सड़क के अनुदिश एक कार का वेग समय आरेख चित्रानुसार है प्रथम 25 s में कार का औसत वेग होगा:
View SolutionA car is moving along a straight road with uniform velocity which is the correct representation
View SolutionA car moves with constant velocity along a straight level and frictionless road .draw the velocity-time graph.
View SolutionA car moves with constant velocity along a straight level and frictionless road .draw the acceleration time graph.
View Solution
