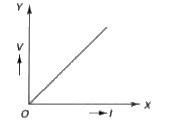
Which physical quantity represents the slope of voltage versus current graph of a metallic conductor?
Resistance
Similar Questions
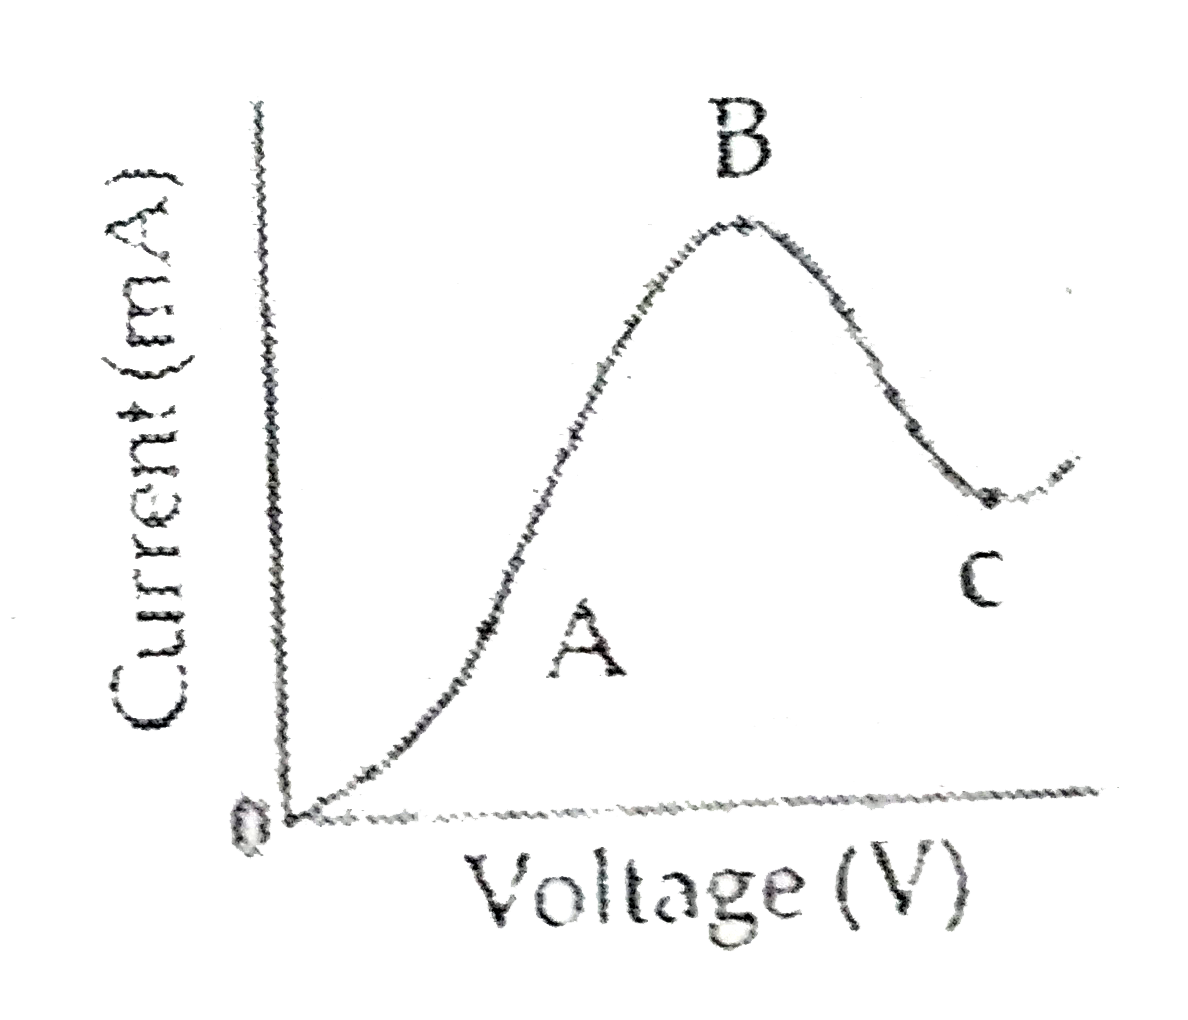
The graph shown in the figure represents a plot of current versus voltage for a given semi-conductor. Identify the region, if any, over which the semicondutor has a negative resistance.
View Solution(a) What are two physical quantities to which electric potential is analogous to ?
(b) To which process is the flow of current in a conductor analogous to ?
View Solution
Knowledge Check
The slope of voltage (V) versus current (I) is called
 AresistanceBconductanceCresistivityDconductivity
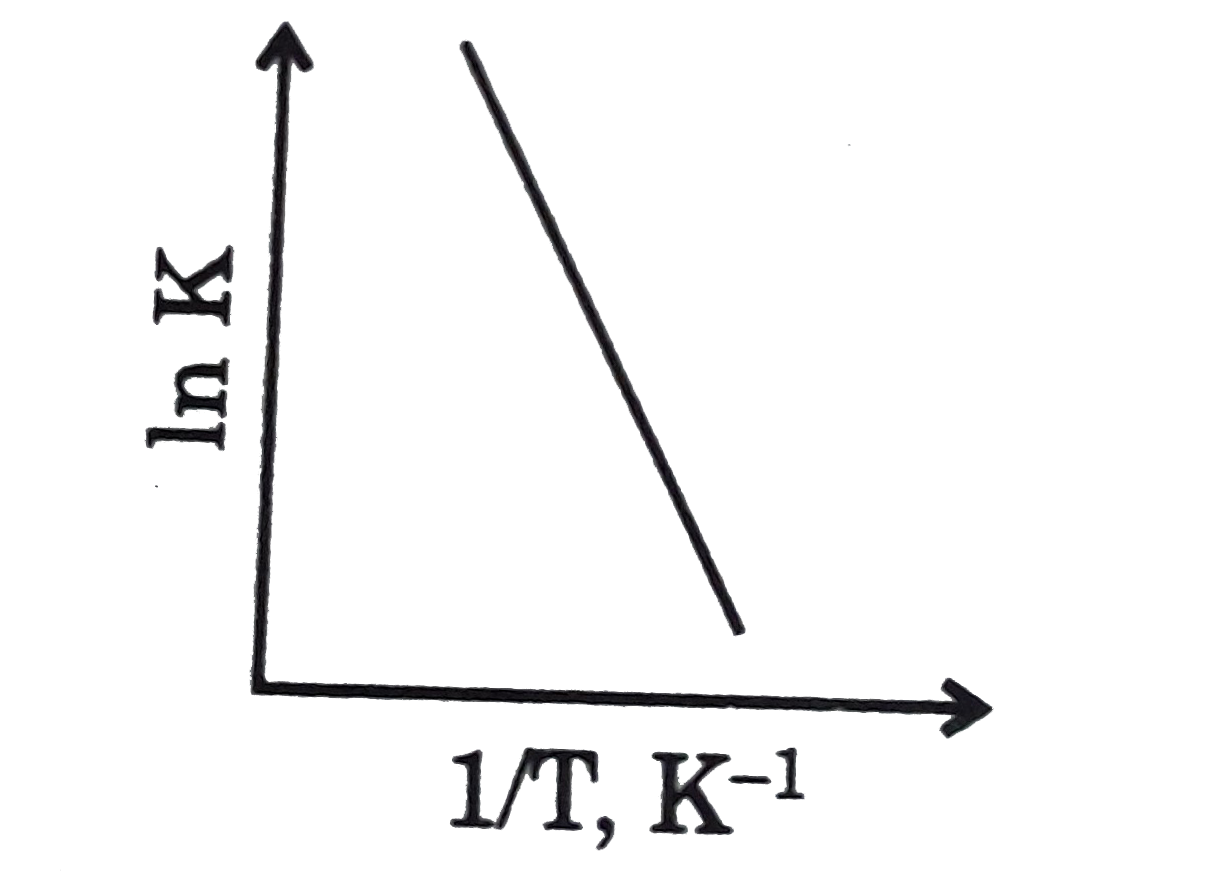
What quantity is represented by the slope of the line in this graph of the temperature dependence of the natural log of an equilibrium constant ?
 A−ΔG∘B−ΔG∘/RC−ΔH∘D−ΔH∘/R
The slope of potential energy versus position graph represents
AforceBpowerCmomentumDwork
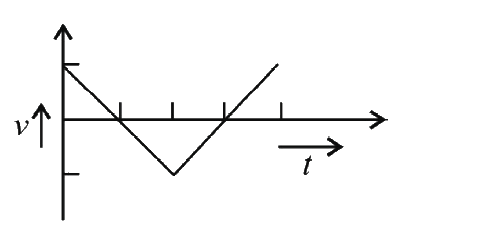
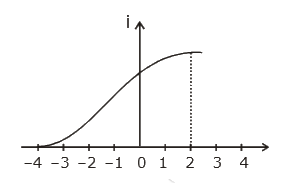
The graph in figure shows the velocity v versus time t for a body. Which of the graphs shown in figure represents the correesponding acceleration versus time graphs ?
View SolutionThe slope of the stopping potential versus frequency graph for photoelectric effect is equal to:
View SolutionWhich of the following pairs represent of the same physical quantities?
View SolutionThe graph in figure shows the velocity v versus time t for a body. Which of the graphs shown in figure represents the corresponding acceleration versus time graphs ?

View SolutionFigure represents the graph of photo current I versus applied voltage (V). The maximum kinetic energy of the emitted photoelectrons is
View Solution
