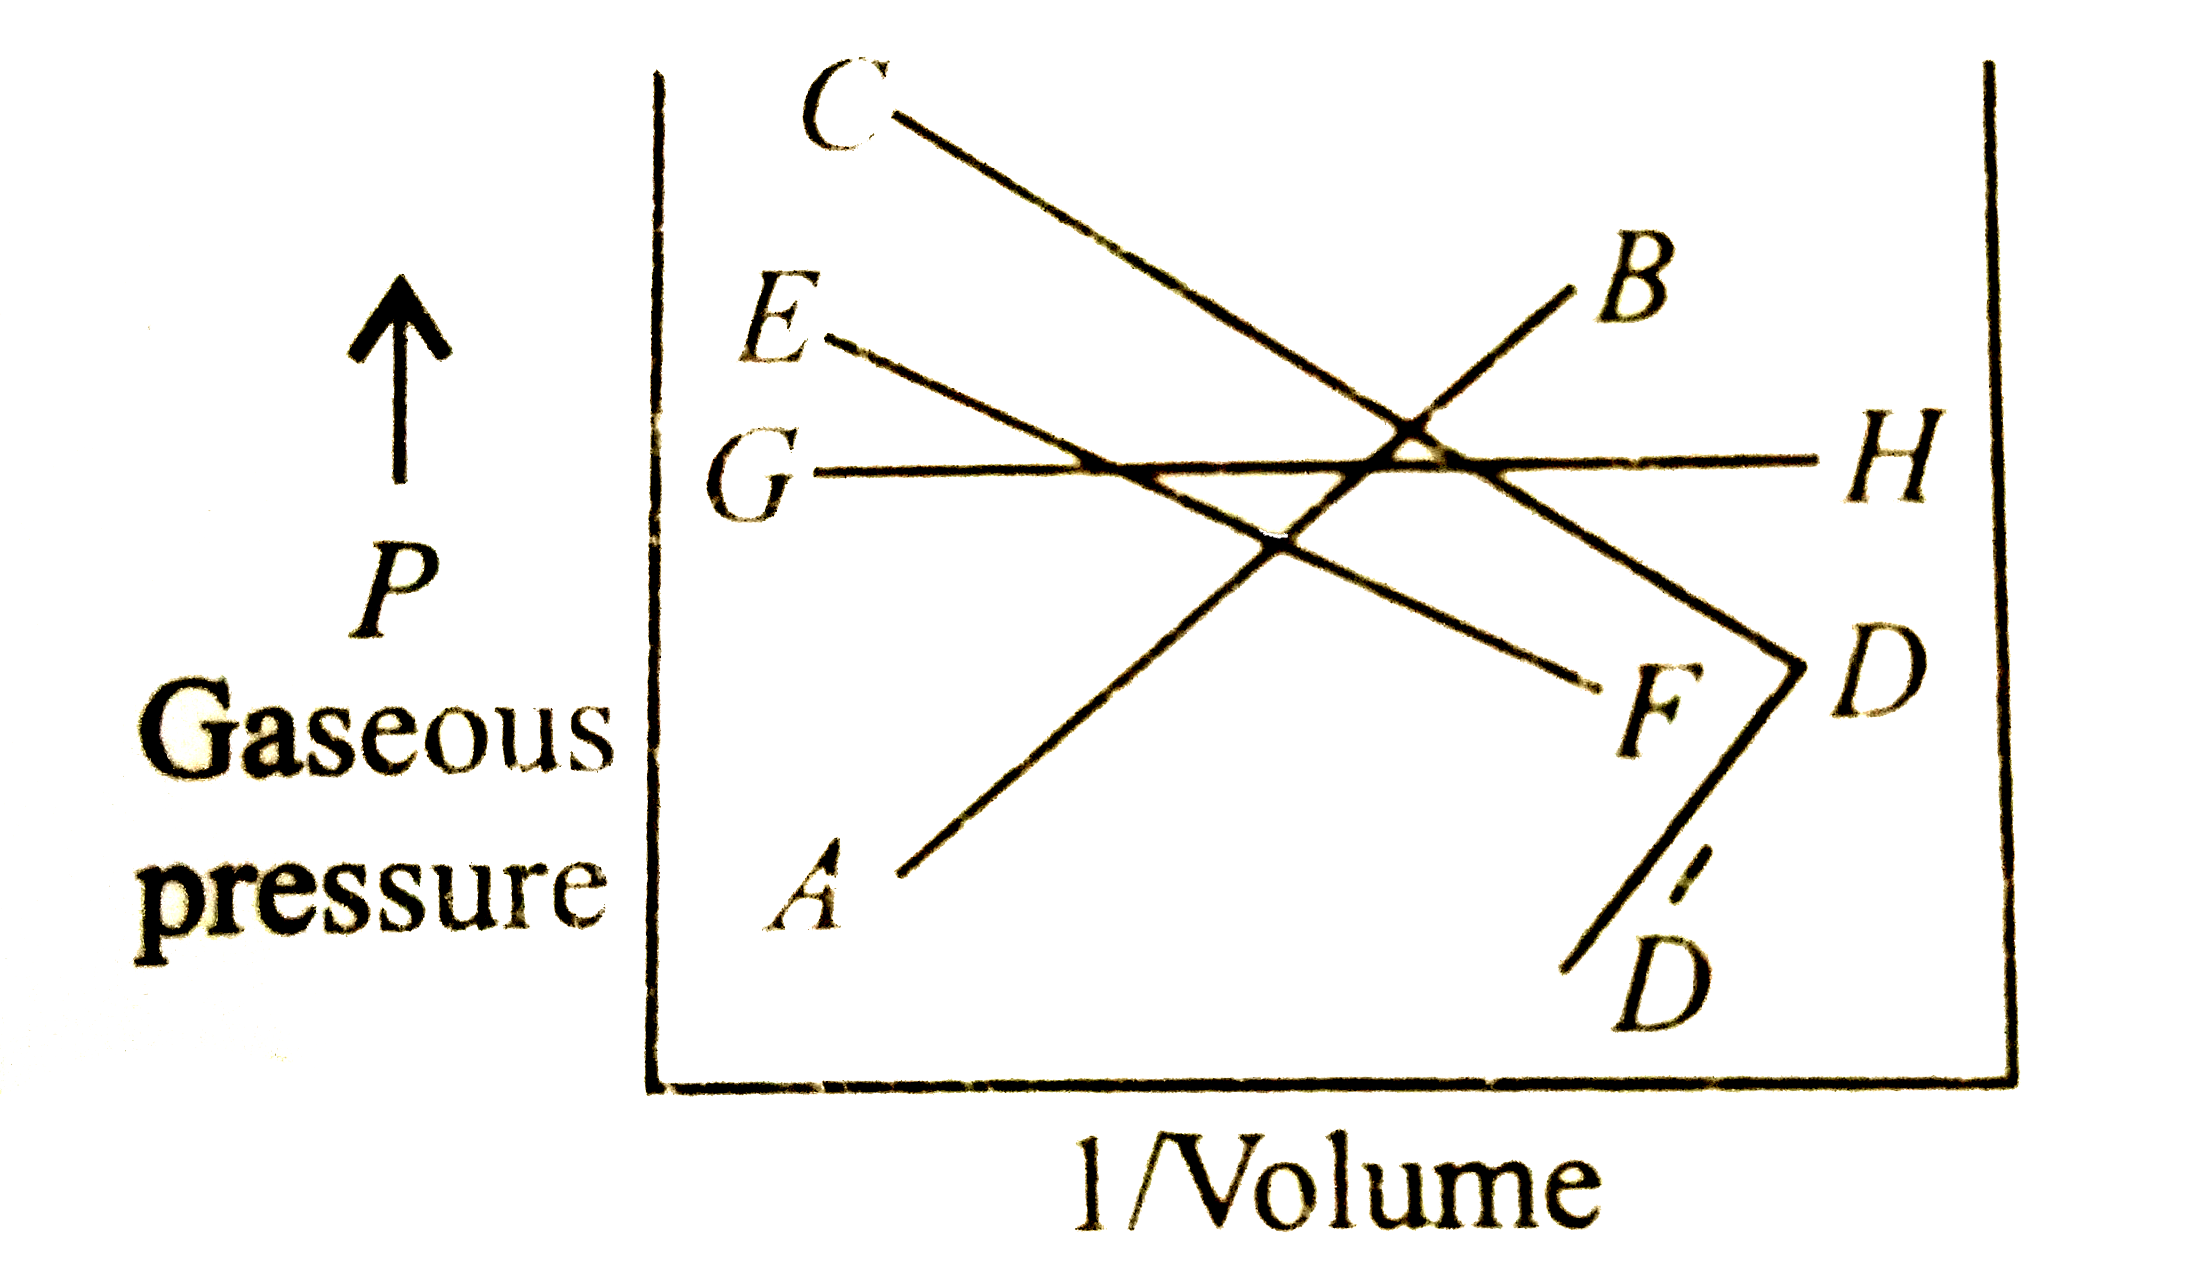
Which one of the given pressure versus volume plots represents Boyle's law ?

Line AB
Line CD
Line EF
Line GH
The correct Answer is:A
Step by step video & image solution for Which one of the given pressure versus volume plots represents Boyle's law ? by Chemistry experts to help you in doubts & scoring excellent marks in Class 11 exams.
Updated on:21/07/2023Topper's Solved these Questions
- STATES OF MATTER BOOK - NCERT FINGERTPS ENGLISHCHAPTER - STATES OF MATTER EXERCISE - Ideal Gas Equation
33 Videos
- STATES OF MATTER BOOK - NCERT FINGERTPS ENGLISHCHAPTER - STATES OF MATTER EXERCISE - Kinetic Energy And Molecular Speeds
4 Videos
- STATES OF MATTER BOOK - NCERT FINGERTPS ENGLISHCHAPTER - STATES OF MATTER EXERCISE - The Gaseous State
1 Videos
- SOME BASIC CONCEPTS OF CHEMISTRY BOOK - NCERT FINGERTPS ENGLISHCHAPTER - SOME BASIC CONCEPTS OF CHEMISTRY EXERCISE - NCERT Exemplar
11 Videos
- STRUCTURE OF ATOM BOOK - NCERT FINGERTPS ENGLISHCHAPTER - STRUCTURE OF ATOM EXERCISE - Assertion And Reason
15 Videos
Similar Questions
Which curve does not represent Boyl's law ?
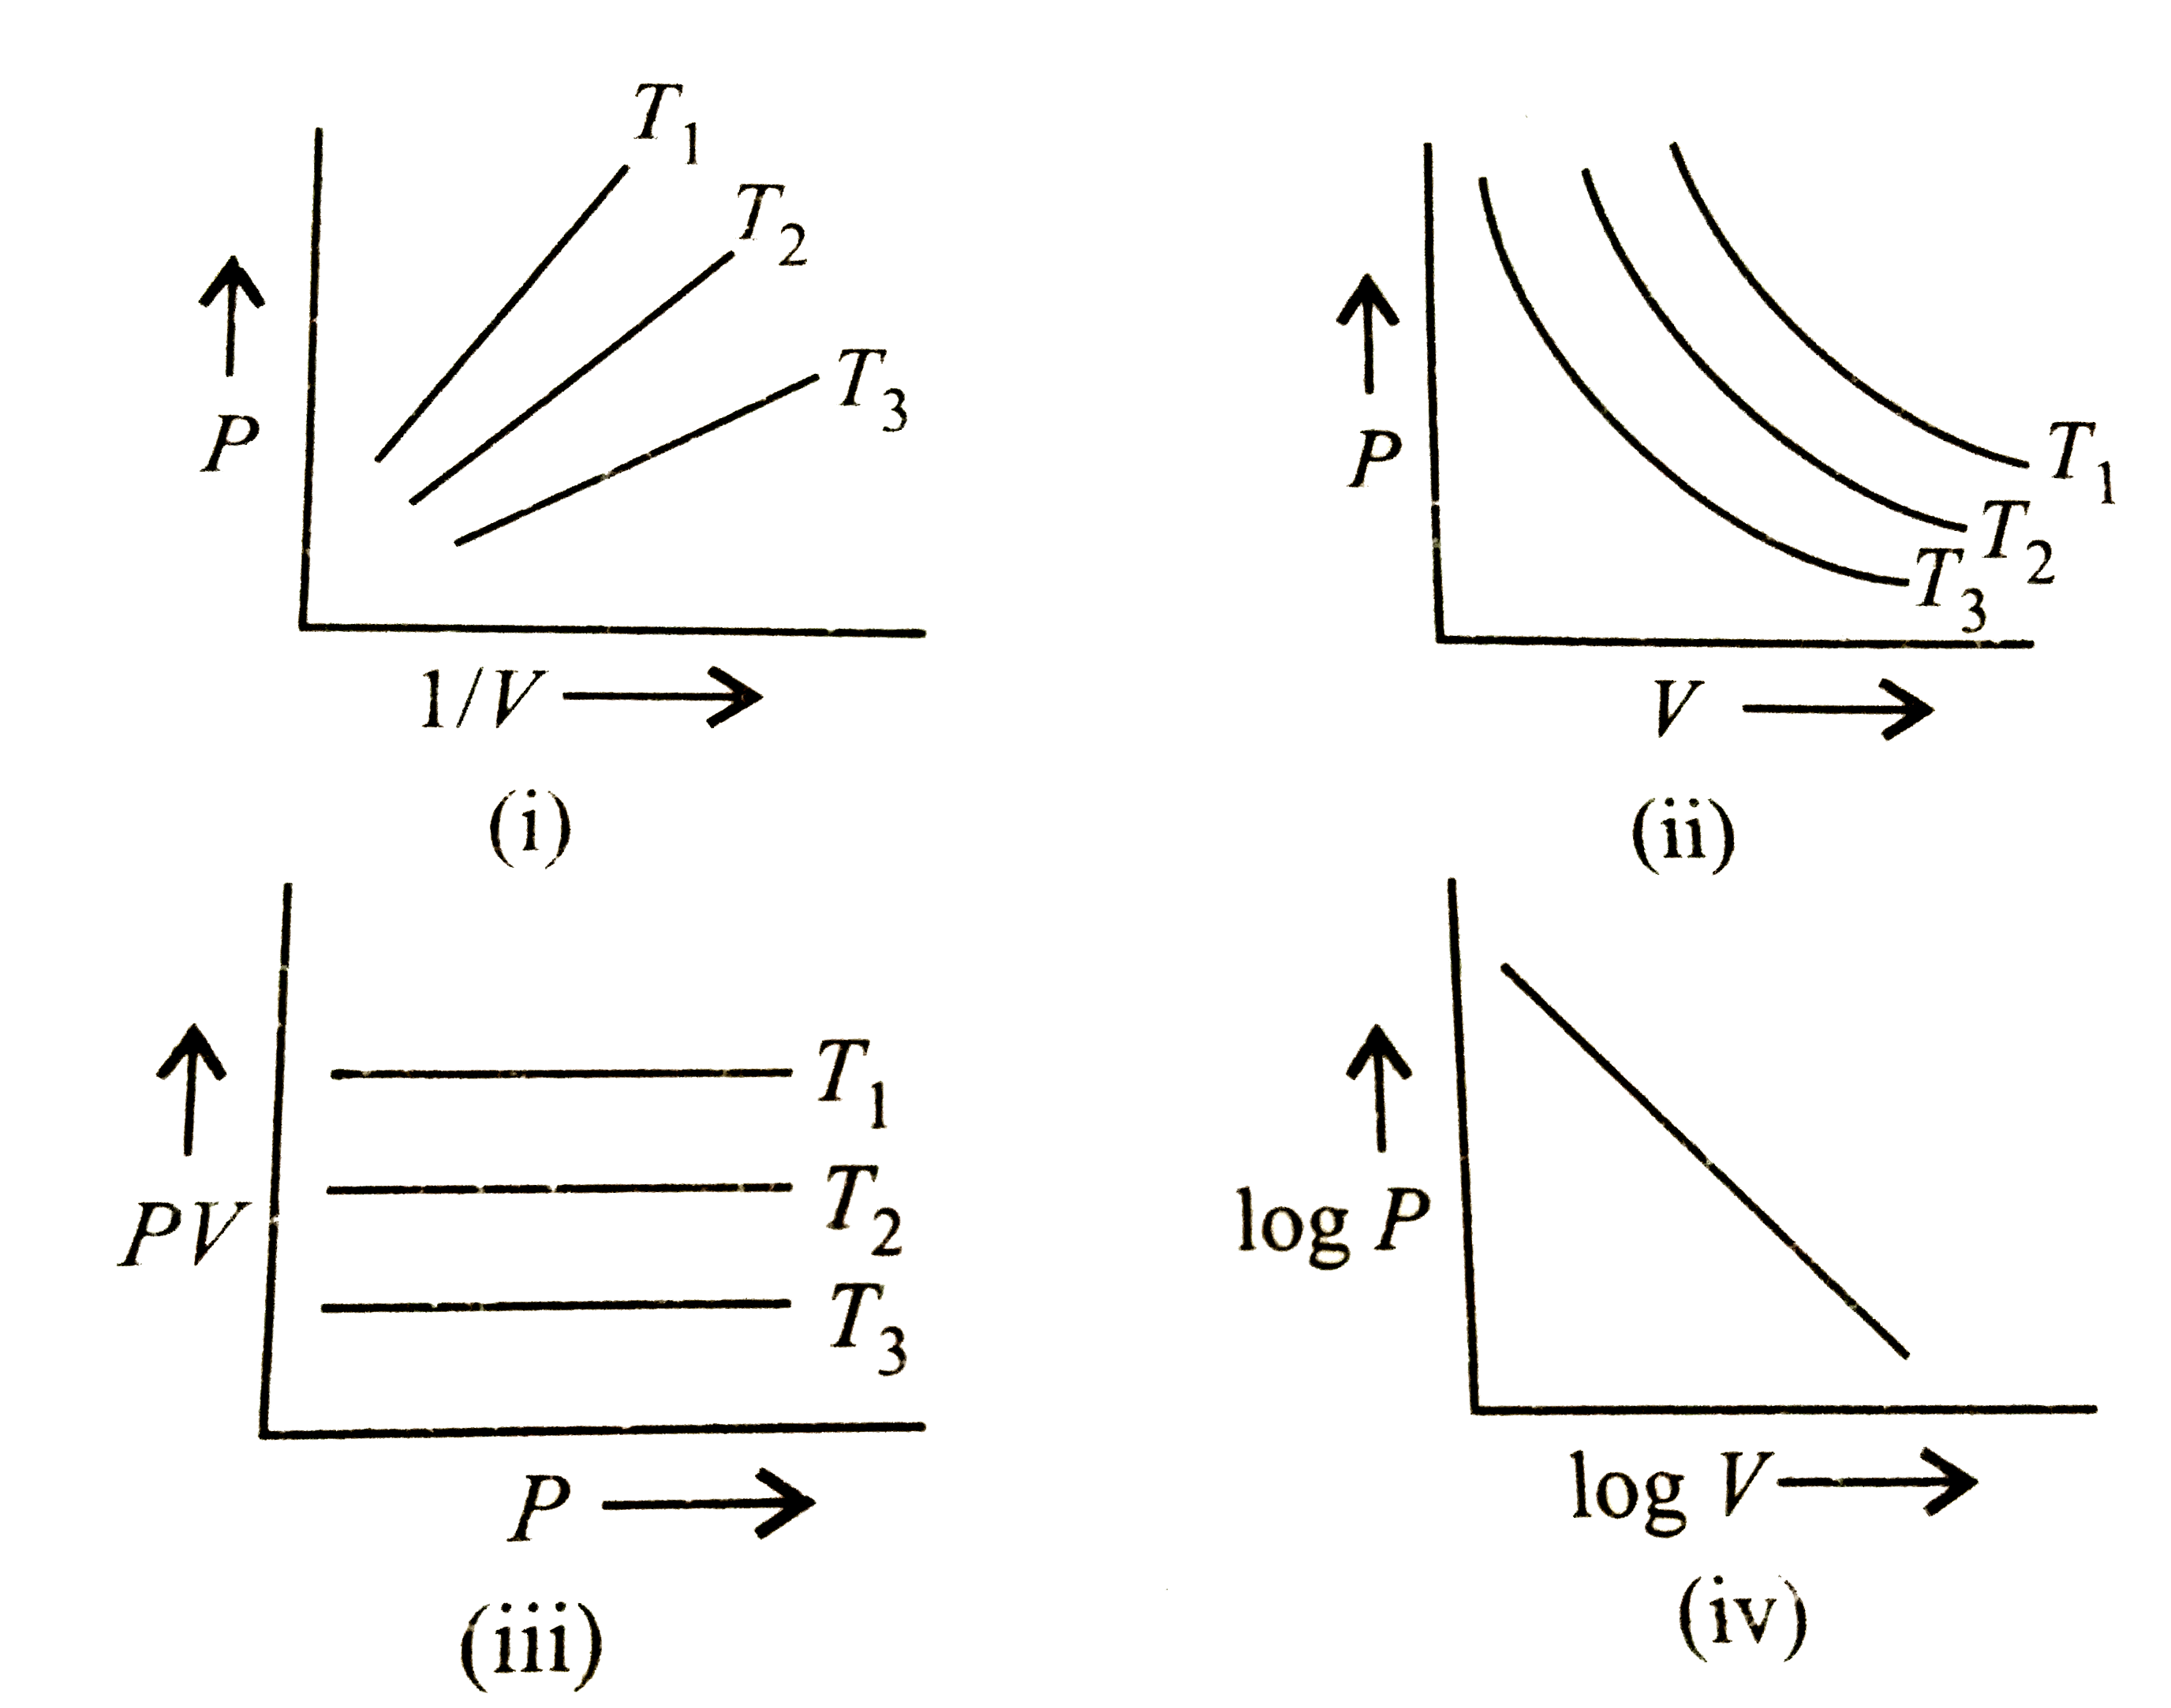
View SolutionGraphs between pressure and volume are plotted at different temperatures . Which of the following isotherms represents Boyle's law as PV = constant ? (T1>T2>T3)

View SolutionWhich of the following plots does not represent Boyle's law?
View SolutionWhich of the following curves represent(s) Boyle's law?
View SolutionWhich of the following graph represents Boyle's law ?
View SolutionWhich of the following expression at constant pressure represents Charles's law?
View SolutionWhich of the following expression at constant pressure represents Charles's law?
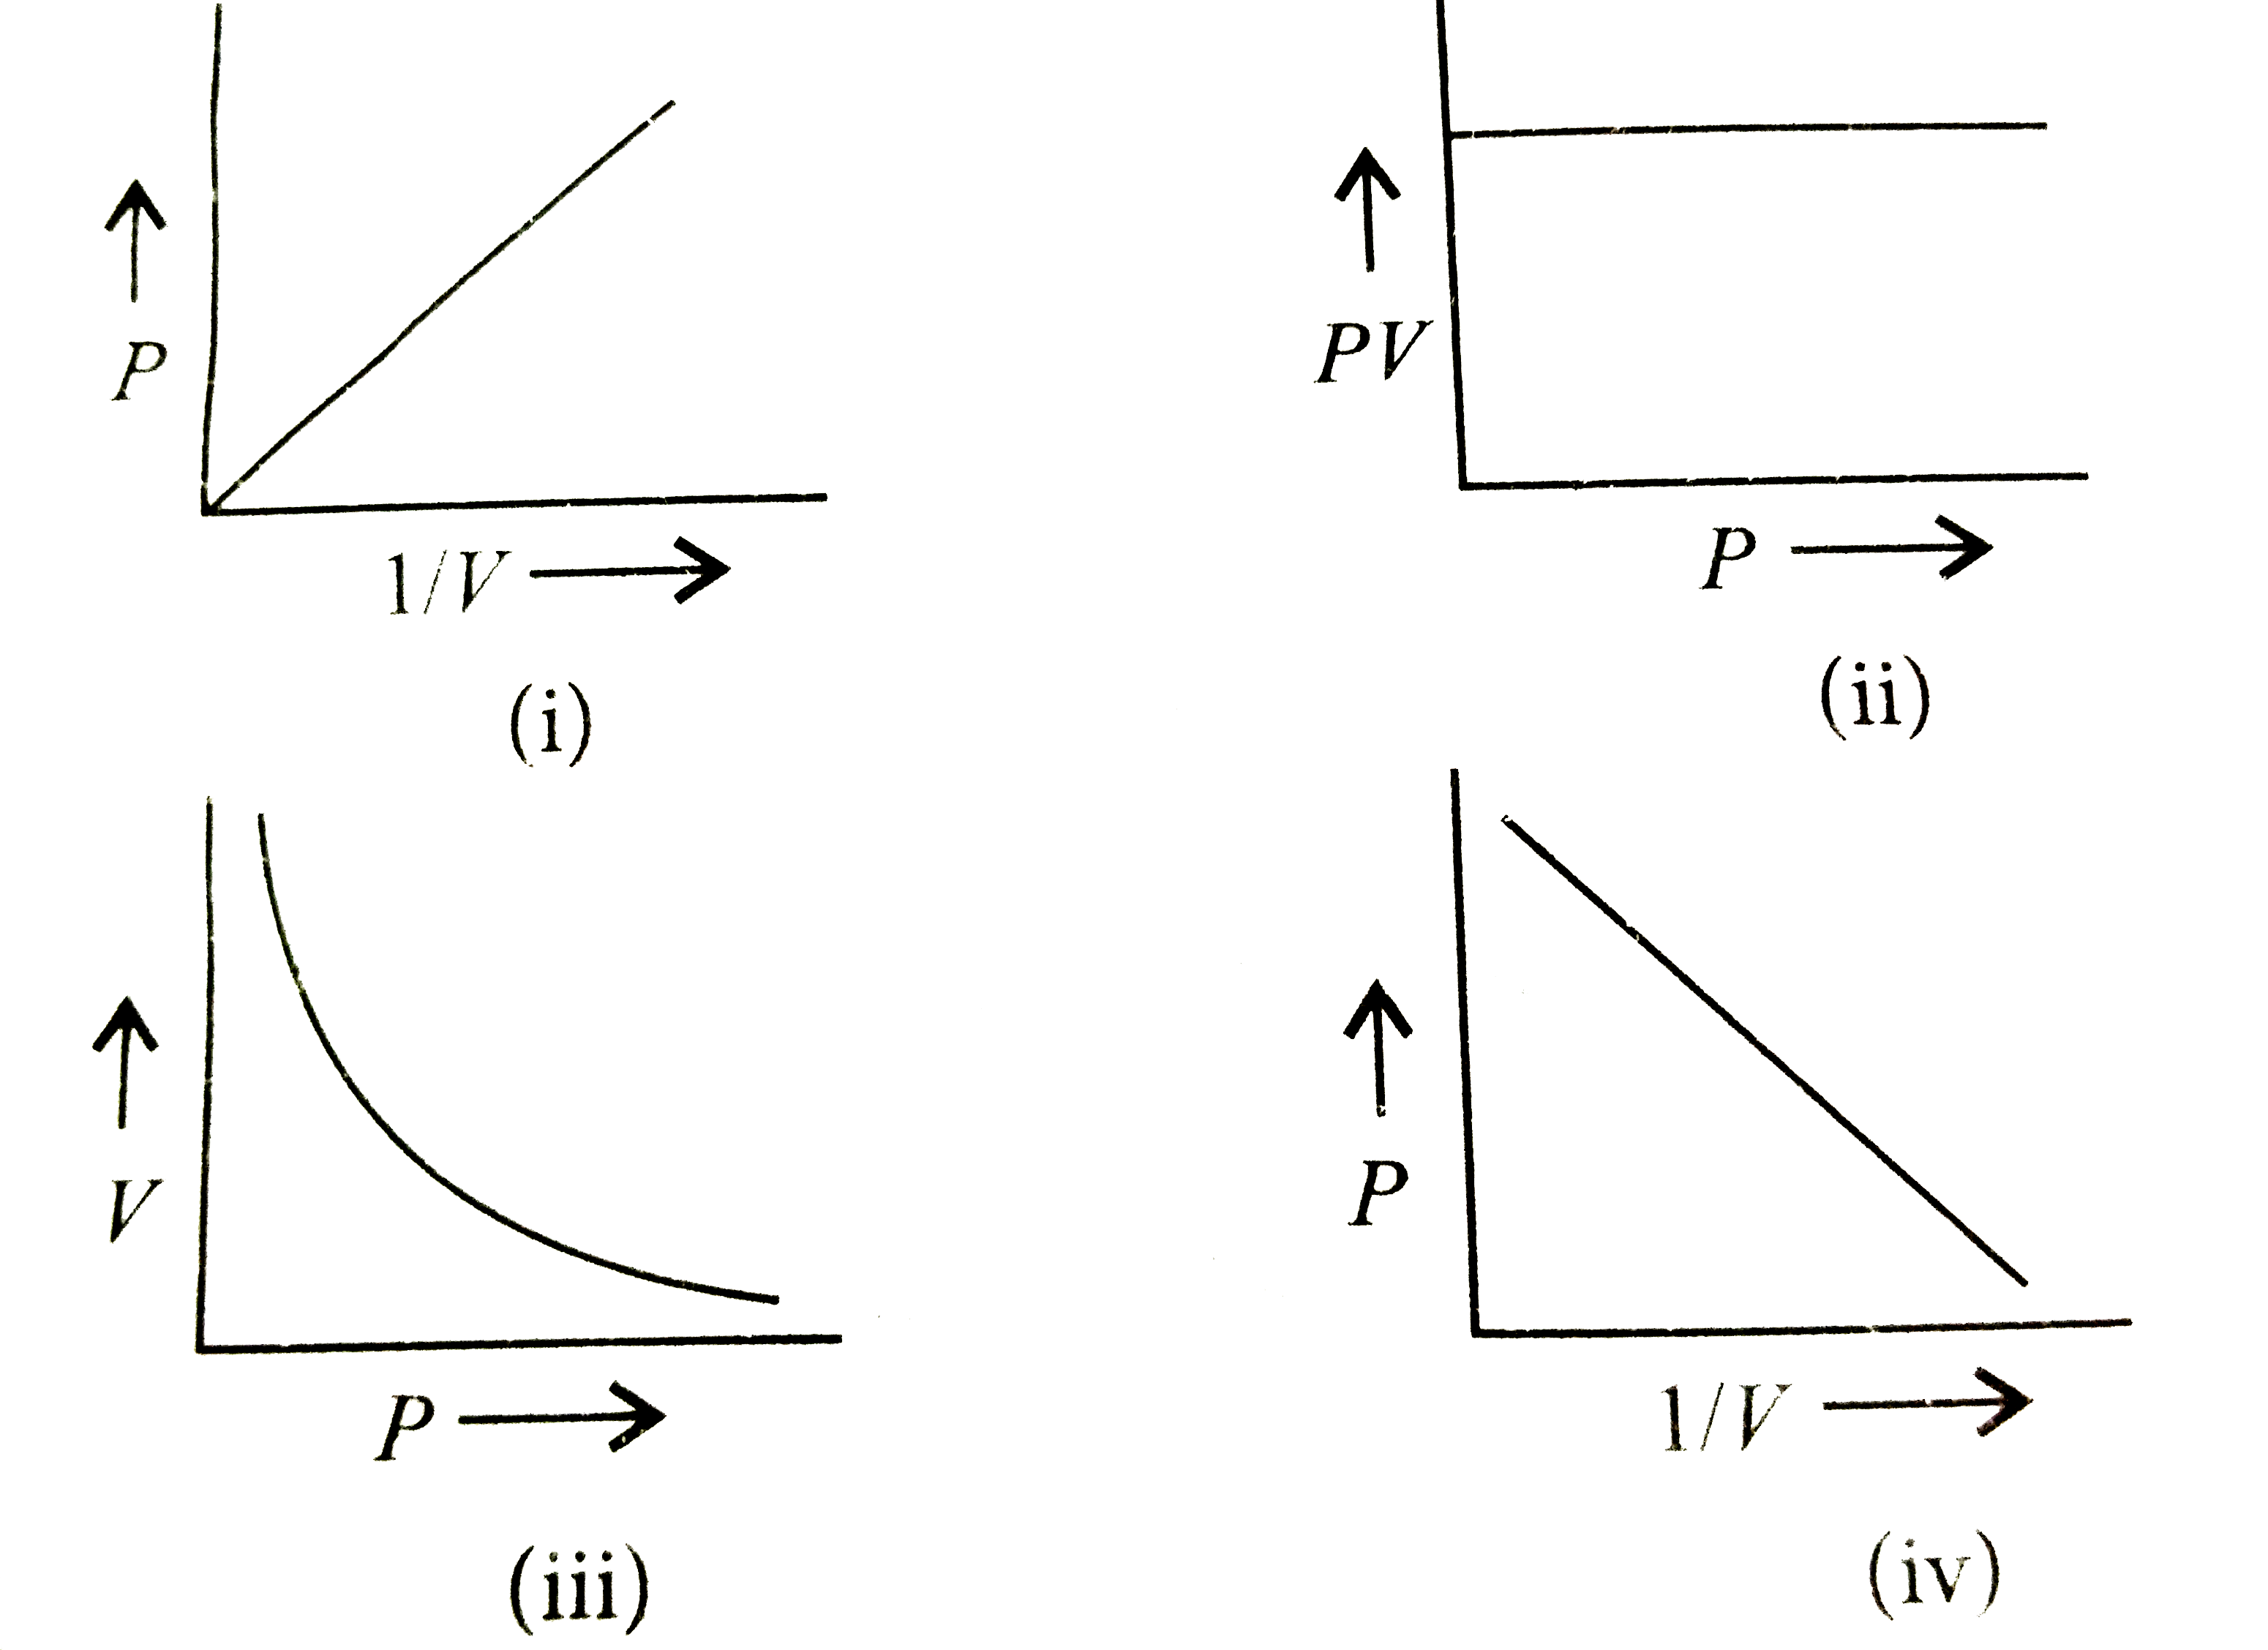
View SolutionWhich of the following graphs represents the correct Boyle's law ?

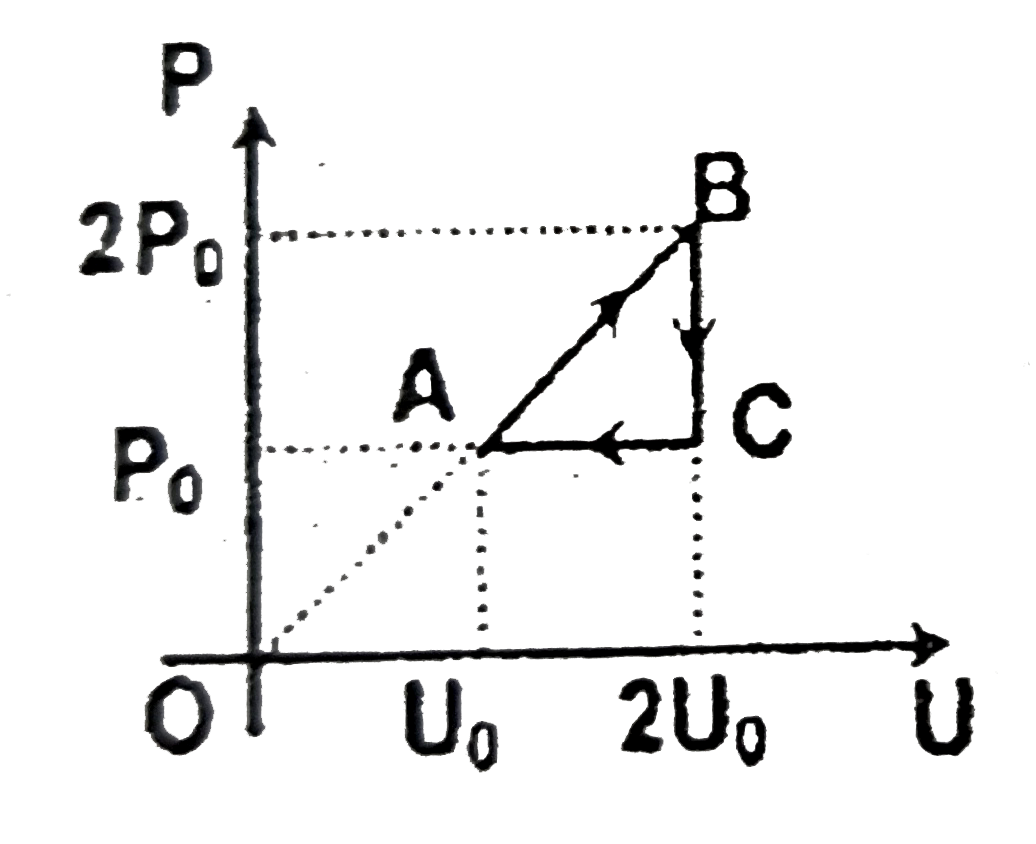
View SolutionAn ideal monatomic gas undergoes a cyclic process ABCA as shown in the figure. Graph of pressure versus volume of the cyclic process ABCA is

View SolutionThe pressure (p) and the dencity ρ of given mass of a gas expressed by Boyle's law, p=Kρ holds true.
View Solution
