Biodiversity Act of India was passed by the Parliament in the year
(a) 1992
(b) 1996
(c) 2000
(d) 2002
1992
1996
2000
2002
The correct Answer is:D
Step by step video & image solution for Biodiversity Act of India was passed by the Parliament in the year (a) 1992 (b) 1996 (c) 2000 (d) 2002 by Biology experts to help you in doubts & scoring excellent marks in Class 12 exams.
Updated on:21/07/2023Topper's Solved these Questions
Similar Questions
The Environment protection Act was passed in the year
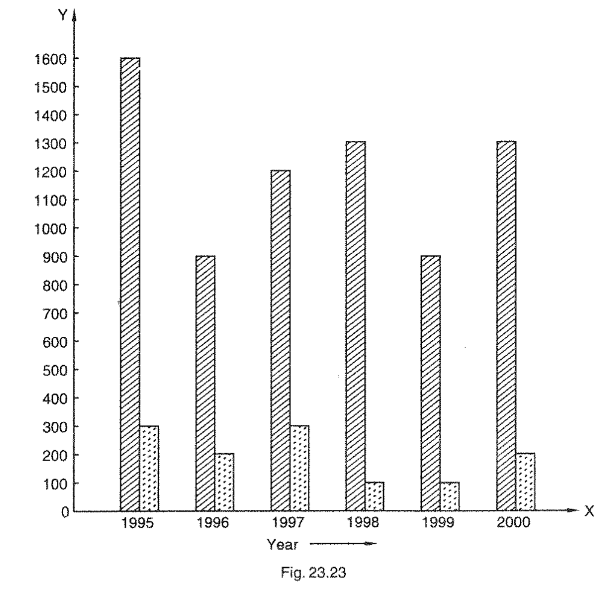
View SolutionThe following bar graph shows the number of persons killed in industrial accidents in a country for some years (Figure) Read the bar graph and choose the correct alternative in each of the following: The year which shows the maximum percentage increase in the number of persons killed in coal mines over the preceding year is:

View Solution
Knowledge Check
The Government of India has passed the environment (Protection) Act in the year
A1990B1987C1986D1992Presently, total number of biodiversity hotspots in the world is
(a) 25
(b) 34
(c) 37
(d) 40A25B34C37D40
Water ( prevention and control of pollution ) Act was passed in the year
View SolutionRecombinant DNA technology developed during
(a) 1970s
(b) 1980s
(c) 1990s
(d) 2000s
View SolutionThe Enviornment Protection Act of Government of India was passed in
View SolutionWhich government Act of India has passed in 1986 to protect and improve the quality of our environment (air, water, and soil)?
View SolutionThe following data gives the amount of loans (in crores of rupees) disbursed by a bank during some years: Year, 1992, 1993, 1994, 1995, 1996 Loan (in crores of rupees), 28, 33, 55, 55, 80 Represent the above data with the help of a bar graph. With the help of the bar graph, indicate the year in which amount of loan is not increased over that of the preceding year.
View SolutionThe following data gives the amount of loans (in crores of rupees) disbursed by a bank during some years: Year, 1992, 1993, 1994, 1995, 1996 Loan (in crores of rupees), 28, 33, 55, 55, 80 Represent the above data with the help of a bar graph. With the help of the bar graph, indicate the year in which amount of loan is not increased over that of the preceding year.
View Solution
