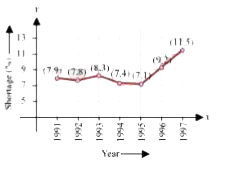
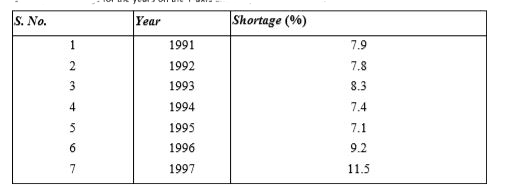
The following Table shows the total power shortage in India from 1991 - 1997. Show the data in the form of a graph. Plot shortage percentage for the years on the Y-axis and the year on the X-axis
Video Solution
Text Solution
|
Updated on:21/07/2023
Related Playlists
Similar Practice Problems
- Question 1 - Select One
A graph is plotted taking ∘––C along the Y - axis and of along the X - axis .It is a /an
AparabolaBstraight lineCellipseDcircle - Question 1 - Select One
A graph is plotted taking .∘C along the Y-axis and .∘F along the X-axis. It is a/an
AparabolaBstraight lineCellipseDcircle - Question 1 - Select One
If the momentum of a particle is plotted on X−axis and its kinetic energy on the Y−axis, the graph is a
Astraight lineBparabolaCrectangular hyperbolaDcircle - Question 1 - Select One
The following graph shows the profit ( in crore ₹) earned by a company in the years from 2012 to 2019.
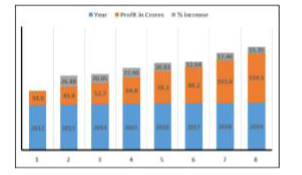
The percentage increased in the profit from the previous year , is greatest in the year :A2013B2017C2015D2018 - Question 1 - Select One
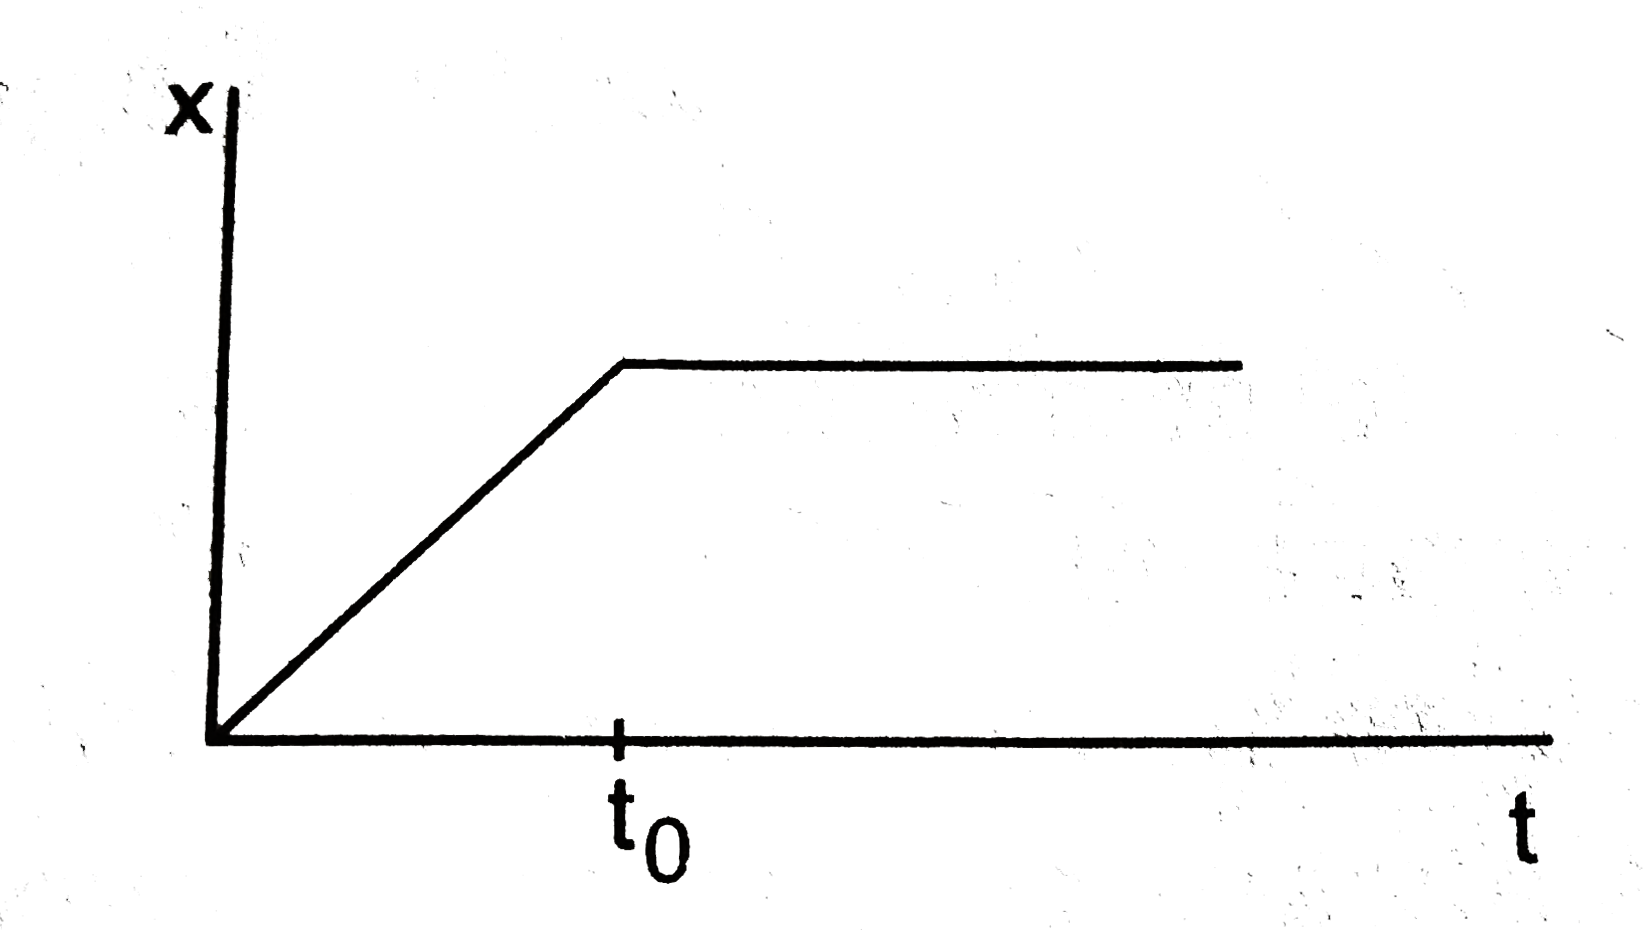
Figure show the displacement - time graph of a particle moving on the x-axis
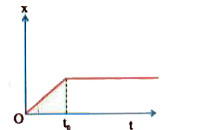 Athe particle is continuously going in positive X directionBthe particle is at restCthe velocity increases up to a time t0 and then becomes constant.Dthe particle moves at constant velocity up to a time t0 and then stops.
Similar Questions
The following Table shows the total power shortage in India from 1991 - 1997. Show the data in the form of a graph. Plot shortage percentage for the years on the Y-axis and the year on the X-axis
 View Solution
The given table shows the quantity of petrol and its cost.

Plot a graph to show the data.View Solution. The following data shows the year wise strength of a school.Represent the the above data by bar graph:
View SolutionFigure shows the displacement time graph of a particle moving on the X-axis
 View Solution
The line graph shows the production of product A and B during the period 2004 to 2009 and the second line graph shows the percentage sale of these products
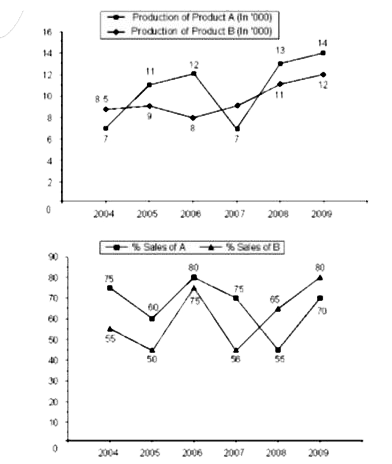
In the given line graph, what is the total sale of products A and B in the year 2007View Solution


