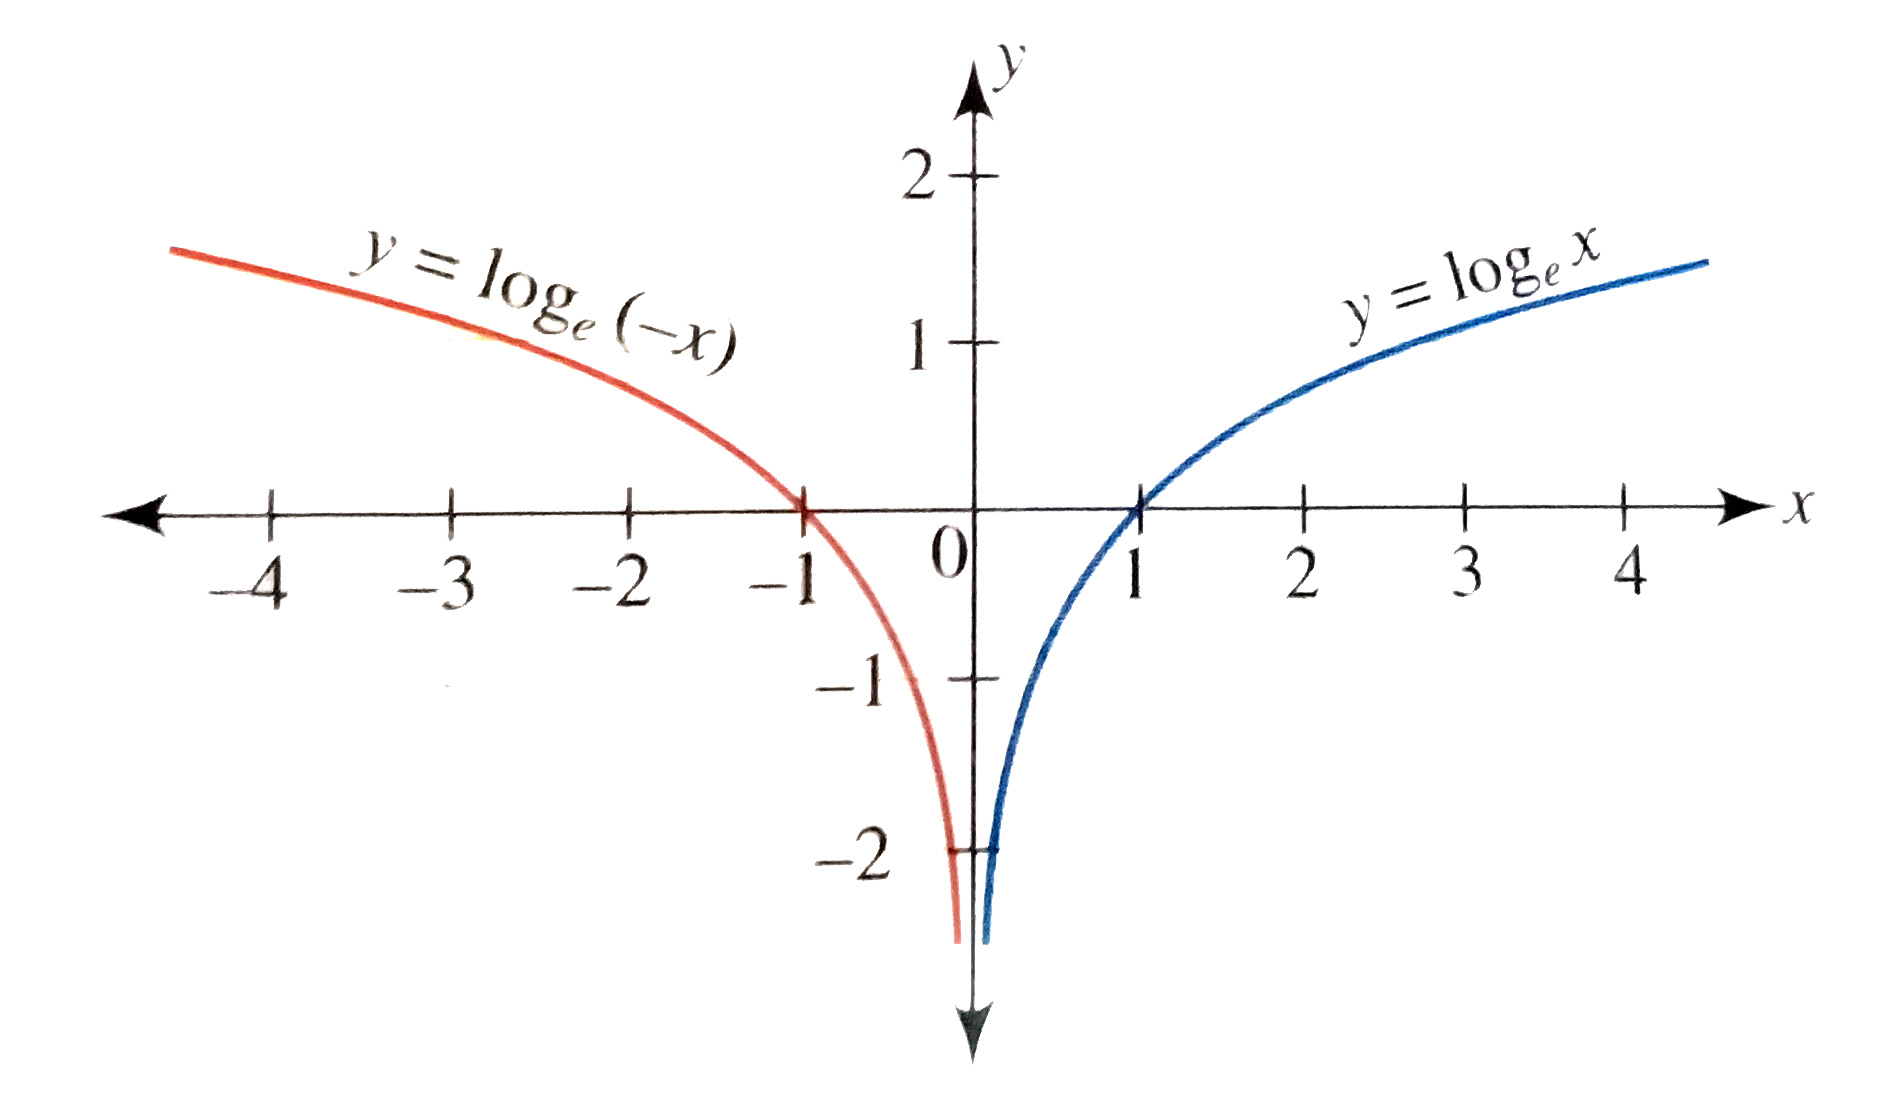
Plot the curve y=(log)e(−x).Solution in Bengali
To draw the graph of y=loge(−x), flip the graph of y=logex over the y-axis shown in the following figure.

Topper's Solved these Questions
Similar Questions
Draw the graph of y=tan−1x−cot−1x.
01:48View SolutionDraw the graph of y=(x−1)(x2−x+1).
05:48View SolutionIf y=ax^ax^...((((∞)))) , then prove that dydx=y2(log)eyx(1−y(log)ex(log)ey)
05:11View SolutionPlot the following curves :
y=xlnx02:13View SolutionPlot the following curves :
y=xlnx01:13View SolutionFind the range of f(x)=cos((log)e{x}).
03:22View SolutionPlot the curve y=(log)e(−x).
02:43View SolutionFind the range of f(x)=(log)ex−((log)ex)2∣∣(log)ex∣∣
02:45View SolutionThe integrating factor of the differential equation dydx(x(log)ex)+y=2(log)ex is given by
08:04View SolutionPlot the curve y=(log)e(−x).
04:52View SolutionFind the area bounded by y=−(log)ex,y=(log)ex,y=(log)e(−x),andy=−(log)e(−x).
03:31View SolutionThe area bounded by the curves y=(log)exandy=((log)ex)2 is
03:47View SolutionThe integrating factor of the differential equation dydx(x(log)ex)+y=2(log)ex is given by
01:37View SolutionIf y=ax^ax^...((((∞)))) , then prove that dydx=y2(log)eyx(1−y(log)ex(log)ey)
01:40View SolutionIf y=ax^ax^...((((∞)))) , then prove that dydx=y2(log)eyx(1−y(log)ex(log)ey)
03:36View SolutionFind the range of f(x)=cos((log)e{x}).
01:10View Solution

