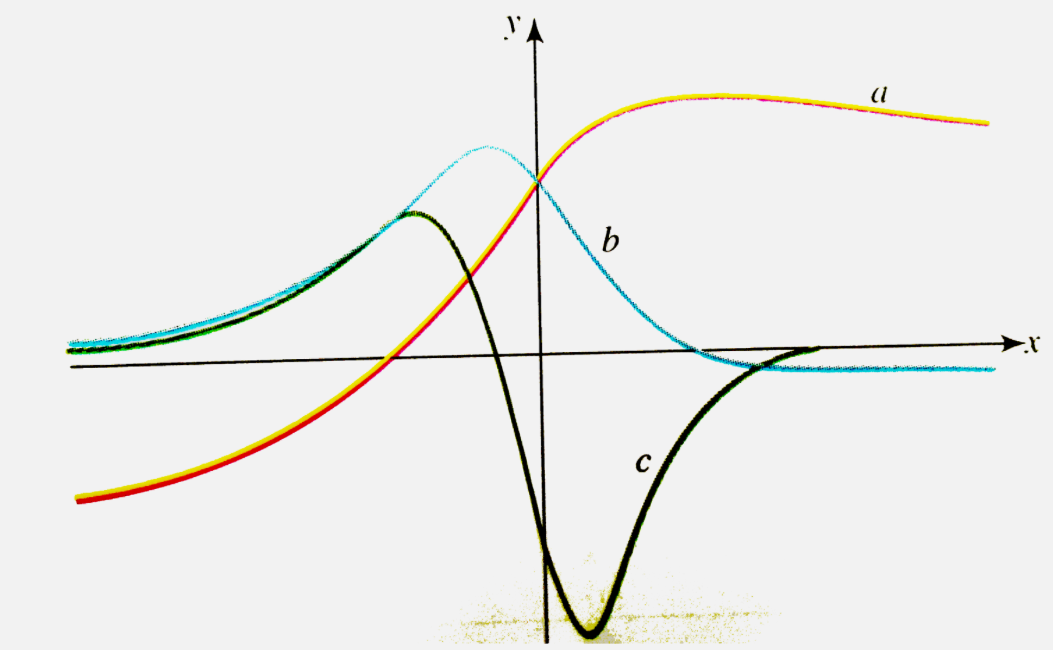
The figure shows the graphs of f, f' and f''. Indentify each curve and explain your choices.
 Solution in Bengali
Clearly the graph 'a' and 'b' are lying entirely above the x-axis. Now for graph 'b', derivative becomes zero at point p.

For graph 'c', derivative becomes zero at x = q and x = r.
Now none of the graphs meets the x-axis at two points q and r.
Hence 'a' must be the graph of the derivative of graph 'b'. Also for x = p, the graph of 'a' meets the x-axis , which confirms this fact.
Let 'b' be the graph of y = f(x) and 'a' be the graph of y = f'(x) , then can 'c' be the graph of y = f''(x)?
Certainly not, as otherwise graph 'c' had cut the x-axis twice.
So 'c' is the graph of y=f(x). 'b' is the graph of y = f'(x) and 'a' is the graph of y = f''(x).
Also for graph 'c', the angle of tangent with + ve x -axis is acute and increases till the point x = p. After x = p and onwards, angle decreases but remains positive. Thus, the graph of y = f'(x) , which is graph is graph 'b' , line entirely above the x-axis. In other words. the graph of 'c' is entirely increasing, hence its derivative is positive, as a result graph 'b', which is the graph of y = f'(x), lies above x - axis.
So finally c is y = f(x), b is y = f'(x) and a = f'(x).
Topper's Solved these Questions
- BOOK - CENGAGE PUBLICATIONCHAPTER - GETTING STARTED WITH GRAPHSEXERCISE - ILLUSTRATION 1.261videos
GETTING STARTED WITH GRAPHS
- BOOK - CENGAGE PUBLICATIONCHAPTER - GETTING STARTED WITH GRAPHSEXERCISE - ILLUSTRATION 1.271videos
GETTING STARTED WITH GRAPHS
- BOOK - CENGAGE PUBLICATIONCHAPTER - GETTING STARTED WITH GRAPHSEXERCISE - ILLUSTRATION 1.241videos
GETTING STARTED WITH GRAPHS
- BOOK - CENGAGE PUBLICATIONCHAPTER - FUNCTIONSEXERCISE - Comprehension Type7videos
FUNCTIONS
- BOOK - CENGAGE PUBLICATIONCHAPTER - GRAPH OF INVERSE TRIGONOMETRIC FUNCTIONSEXERCISE - Exercises18videos
GRAPH OF INVERSE TRIGONOMETRIC FUNCTIONS
Similar Questions
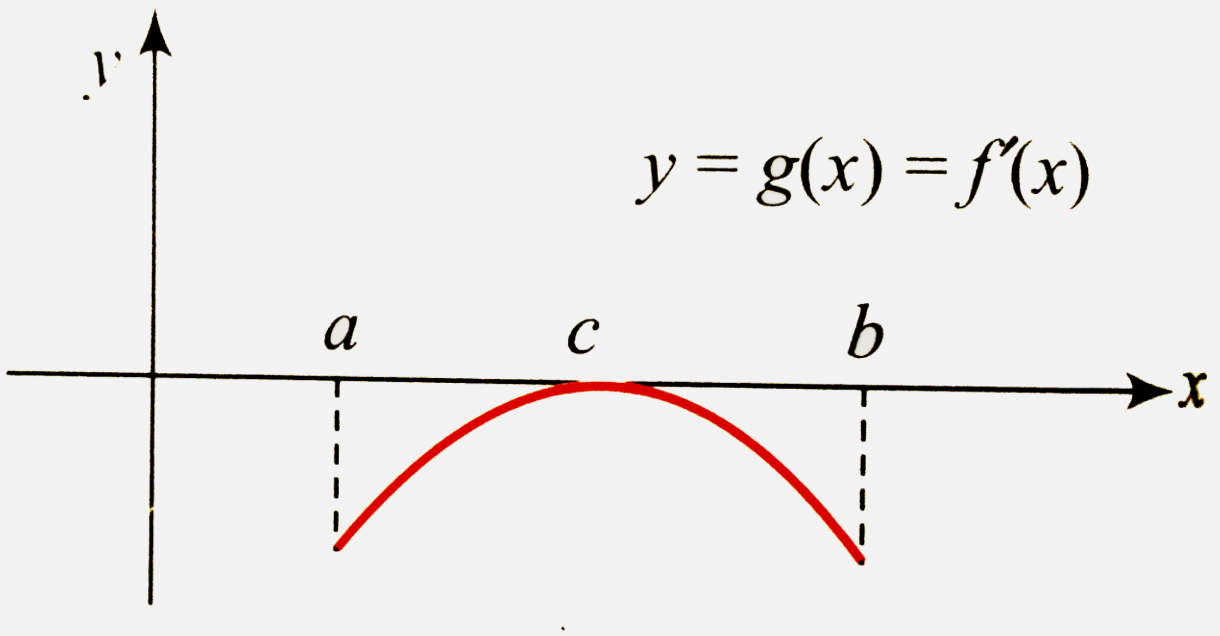
Following is the graph of y = f' (x) , given that f(c) = 0. Analyse the graph and answer the following questions.
(a) How many times the graph of y = f(x) will intersect the x - axis?
(b) Discuss the type of roots of the equation f (x) = 0, a≤x≤b.
(c) How many points of inflection the graph of y=f(x),a≤x≤b, has?
,(d) Find the points of local maxima/minima of y=f(x),a≤x≤b,
, (e) f"(x)=0 has how many roots?
 View Solution
Find the asymptote of the function y=2x2+3x+1x if any.
View Solution
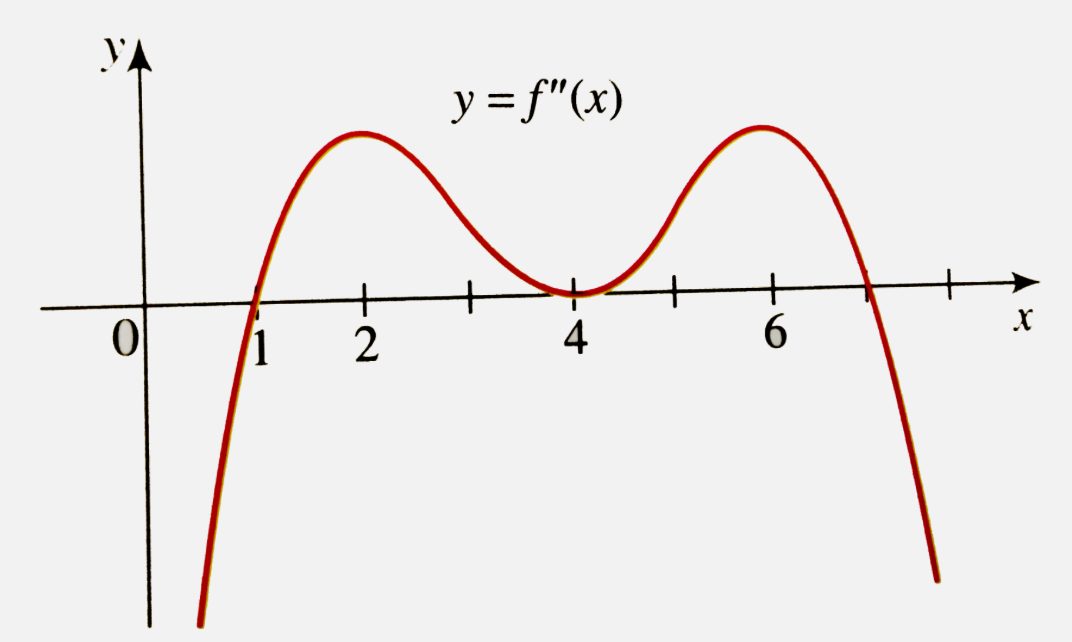
The graph of the second derivation f''(x) is given in the following figure. State the x - coordinate of the point of inflection of f. Given reasons for your answer.
 01:37View Solution
Let f(x)=x2−2x−1∀x∈R.Letf:(−∞,a]→[b,∞), where a is the largest real number for which f(x) is bijective.
If f:R→R, then range of values of k for which equation f(|x|)=k has 4 distinct real roots is02:11View SolutionDraw the graph of y=tan−1x−cot−1x.
01:31View SolutionThe figure shows the graphs of f, f' and f'' . Identify each curve and explain your choices.
(##CEN_GRA_C01_S01_025_Q01.png" width="80%">02:45View SolutionThe figure shows the graphs of f, f' and f''. Indentify each curve and explain your choices.
 02:17View Solution
How many lines of symmetry does the above figure have ?
05:41View SolutionDetermine the point of symmetry of a regular hexagon.
02:21View SolutionDtermine the images of the following figure about the given line :
02:03View SolutionMatch the following Column A to Column B
 02:10View Solution
Match the following Column A to Column B
 02:17View Solution
Match the following Column A to Column B
 02:10View Solution
Find the area of the figure given below.
 04:23View Solution
The area of the shaded part in the figure given below is ______.
 04:39View Solution
The inequation represented by the graph given below is :
07:12View Solution

