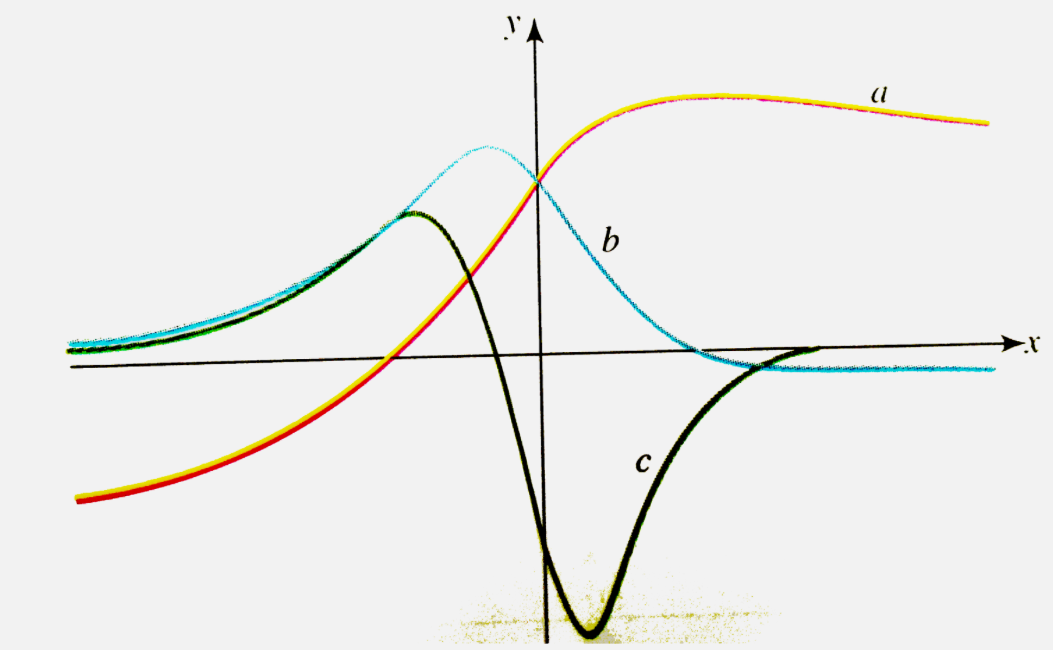
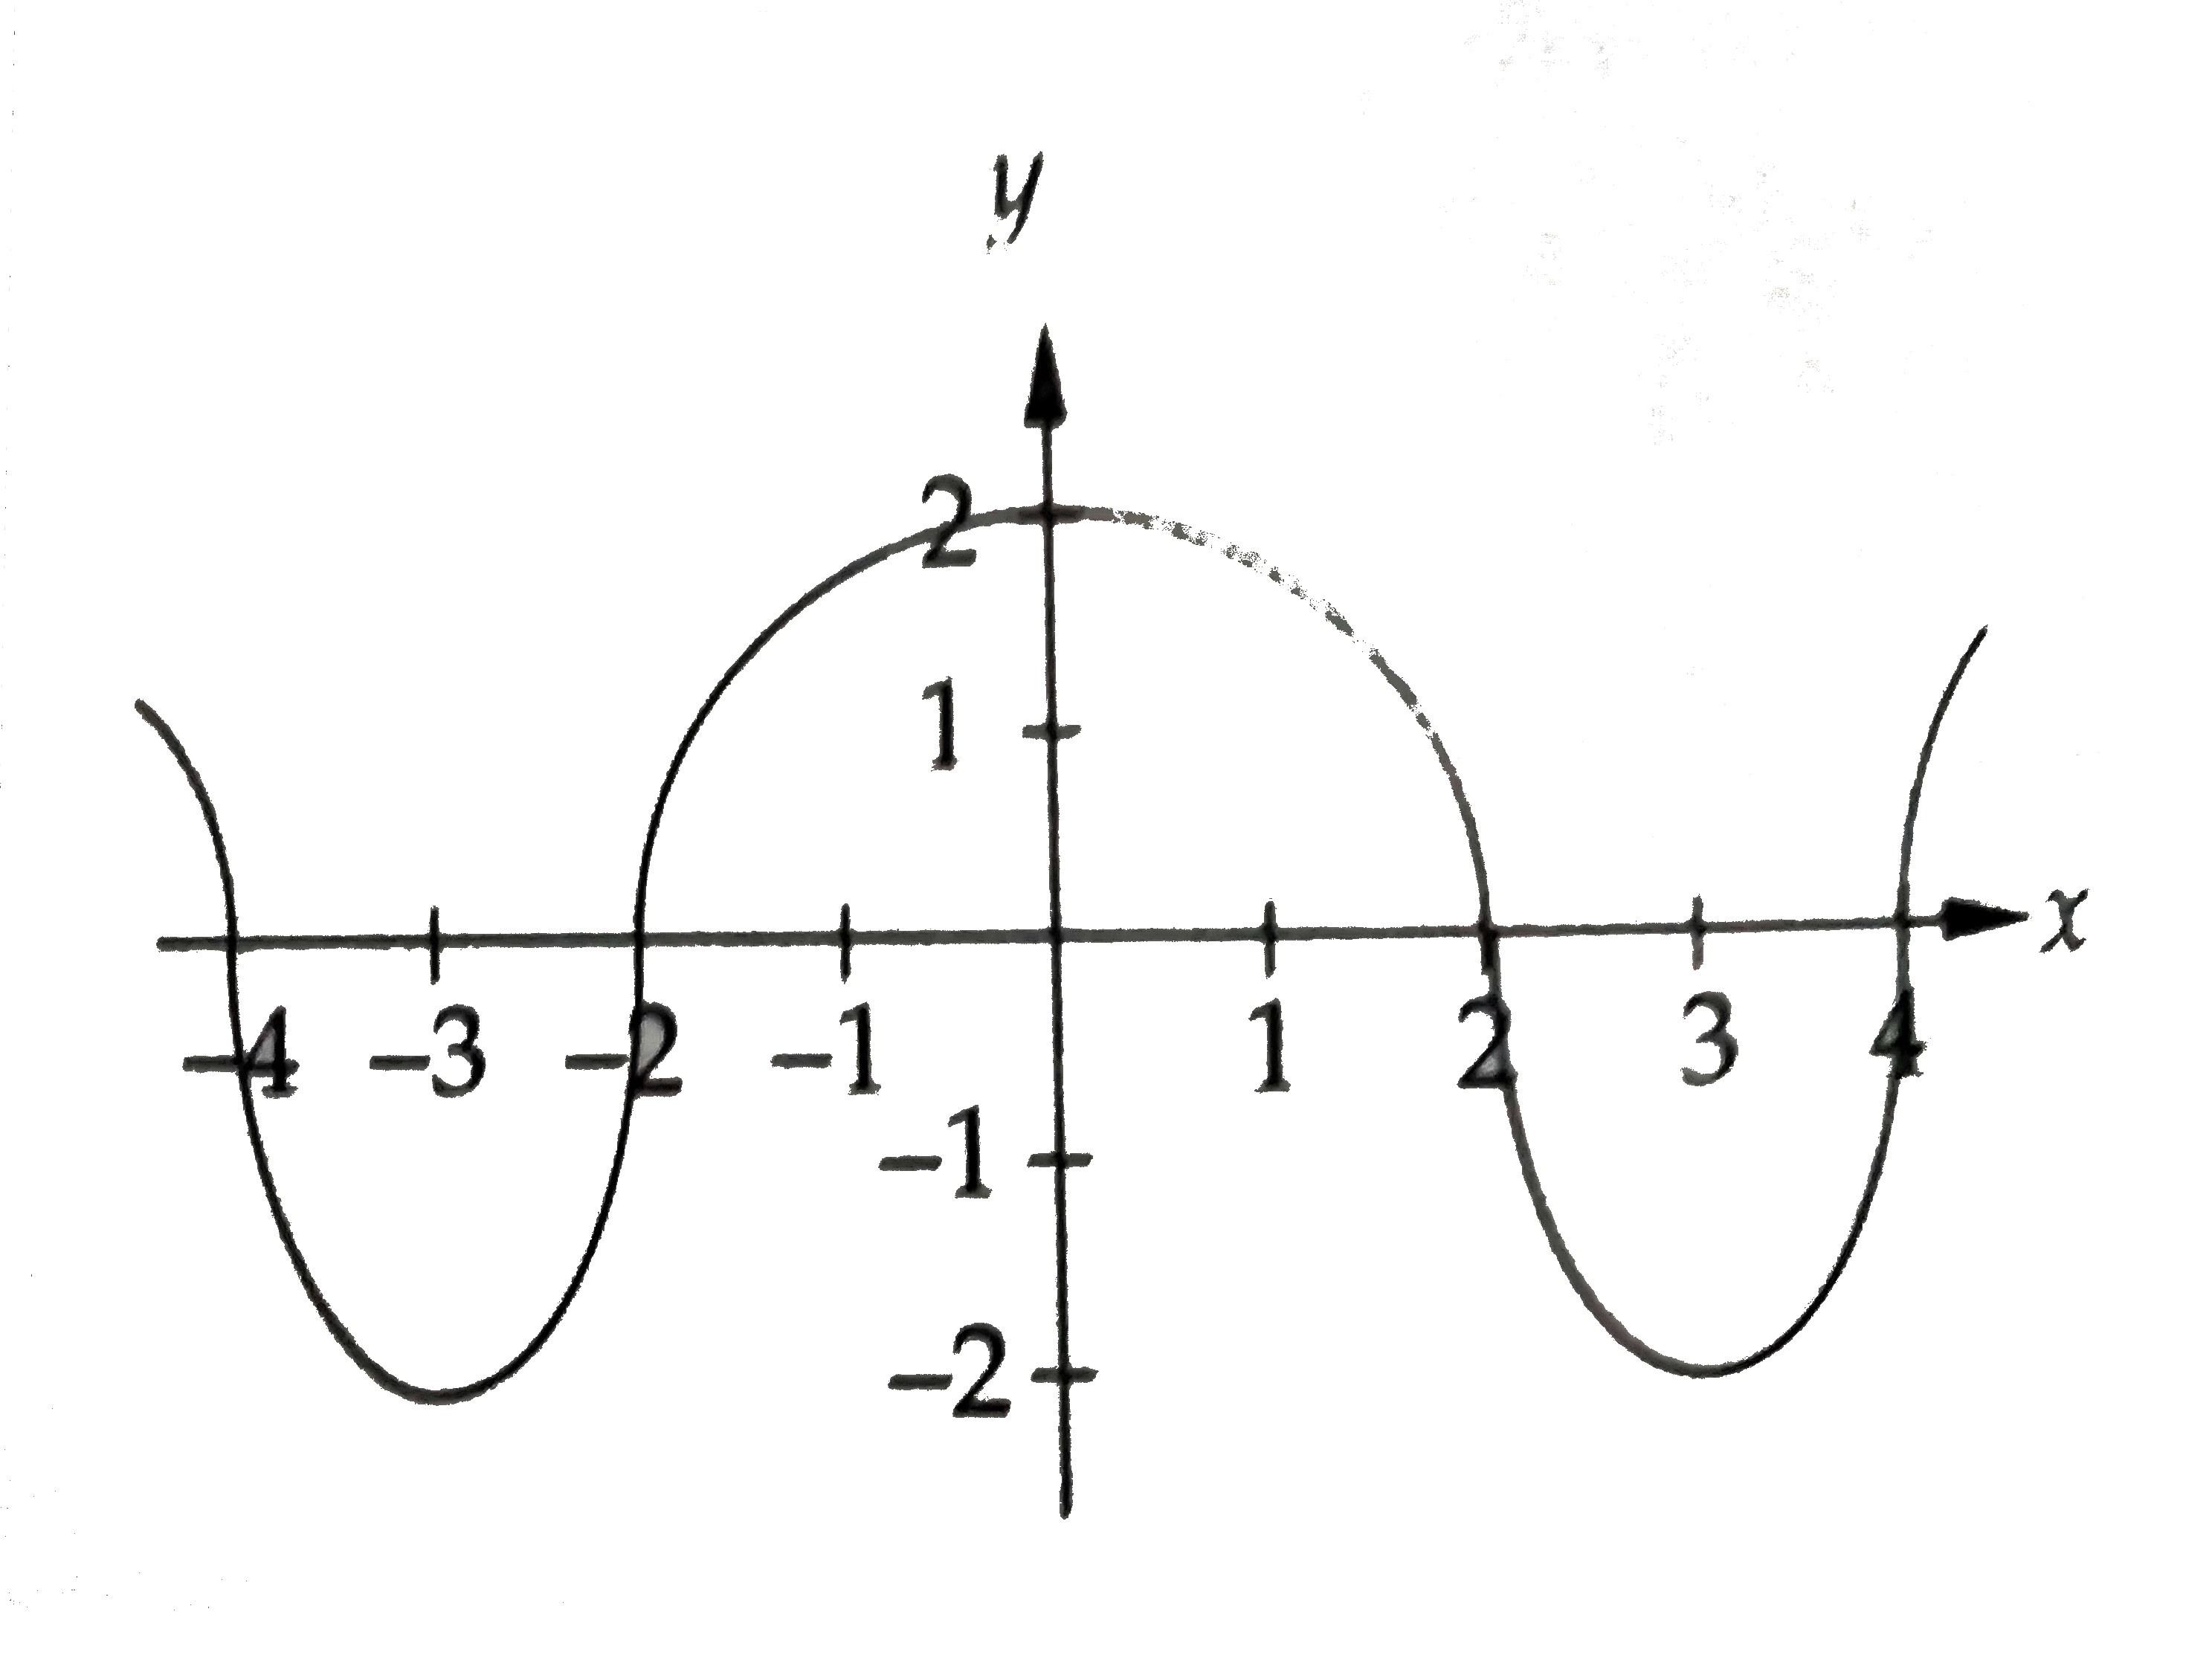
The figure shows the graphs of f, f' and f''. Indentify each curve and explain your choices.
Text Solution
Draw the line x = p meeting graph 'b' at its point of maxima, where the derivative is zero.
(##CENGRAC01E01016_S01.png width=80%><br>Thus,graph'c'isthegraphofthederivativeof'b'.<br>Also,l∈ex=qmeetsgraph'a'atitsp∮ofmaxima,wherethederivativeiszer⊙<br>Thus,'b'isthegraphofthederivativeof'a'.<br>Thus,'a','b','c'arethegraphsof y = f(x), y = f'(x) and y = f''(x), respectively.
|
Topper's Solved these Questions
- GETTING STARTED WITH GRAPHSBOOK - CENGAGECHAPTER - GETTING STARTED WITH GRAPHSEXERCISE - Exercise
18 Videos
- FUNCTIONSBOOK - CENGAGECHAPTER - FUNCTIONSEXERCISE - Question Bank
30 Videos
- GRAPH OF INVERSE TRIGONOMETRIC FUNCTIONSBOOK - CENGAGECHAPTER - GRAPH OF INVERSE TRIGONOMETRIC FUNCTIONSEXERCISE - Exercise
18 Videos
Similar Questions
Knowledge Check
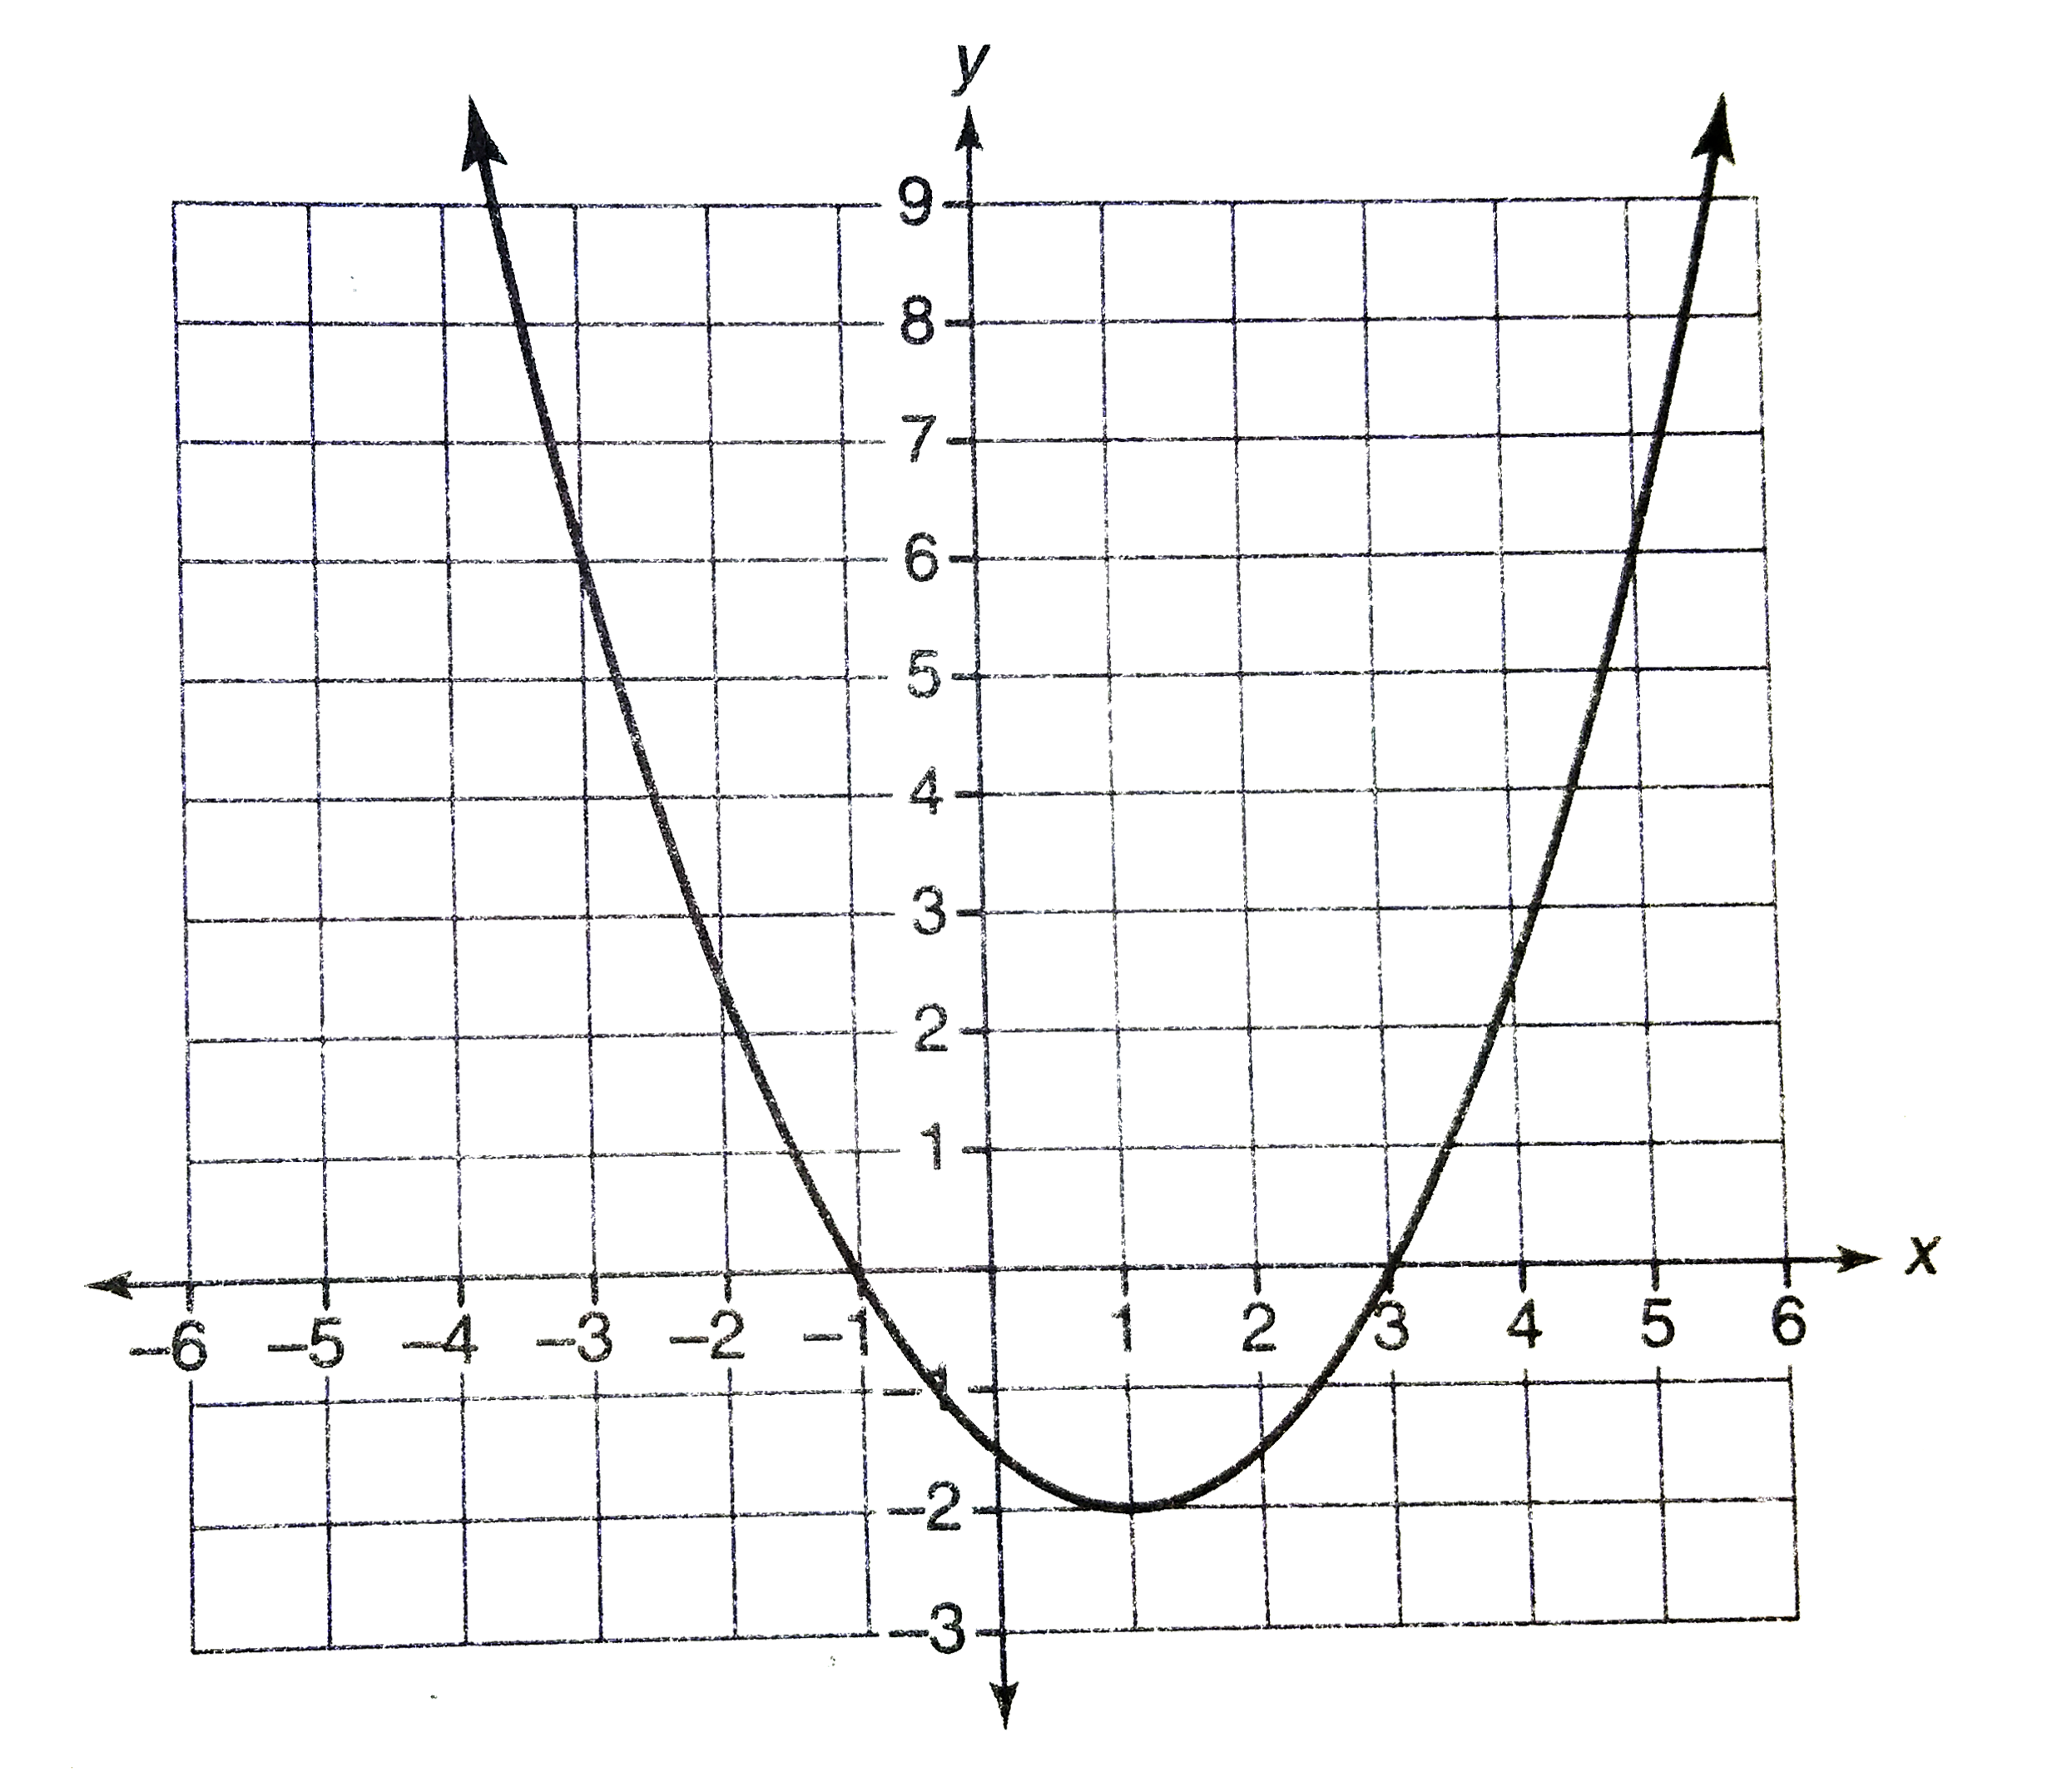
The figure above shows the graph of the quadratic function f with a minimum point at (1,−2). If f(5)=f(c), then which of the following could be the values of c?A−5B−3C0D6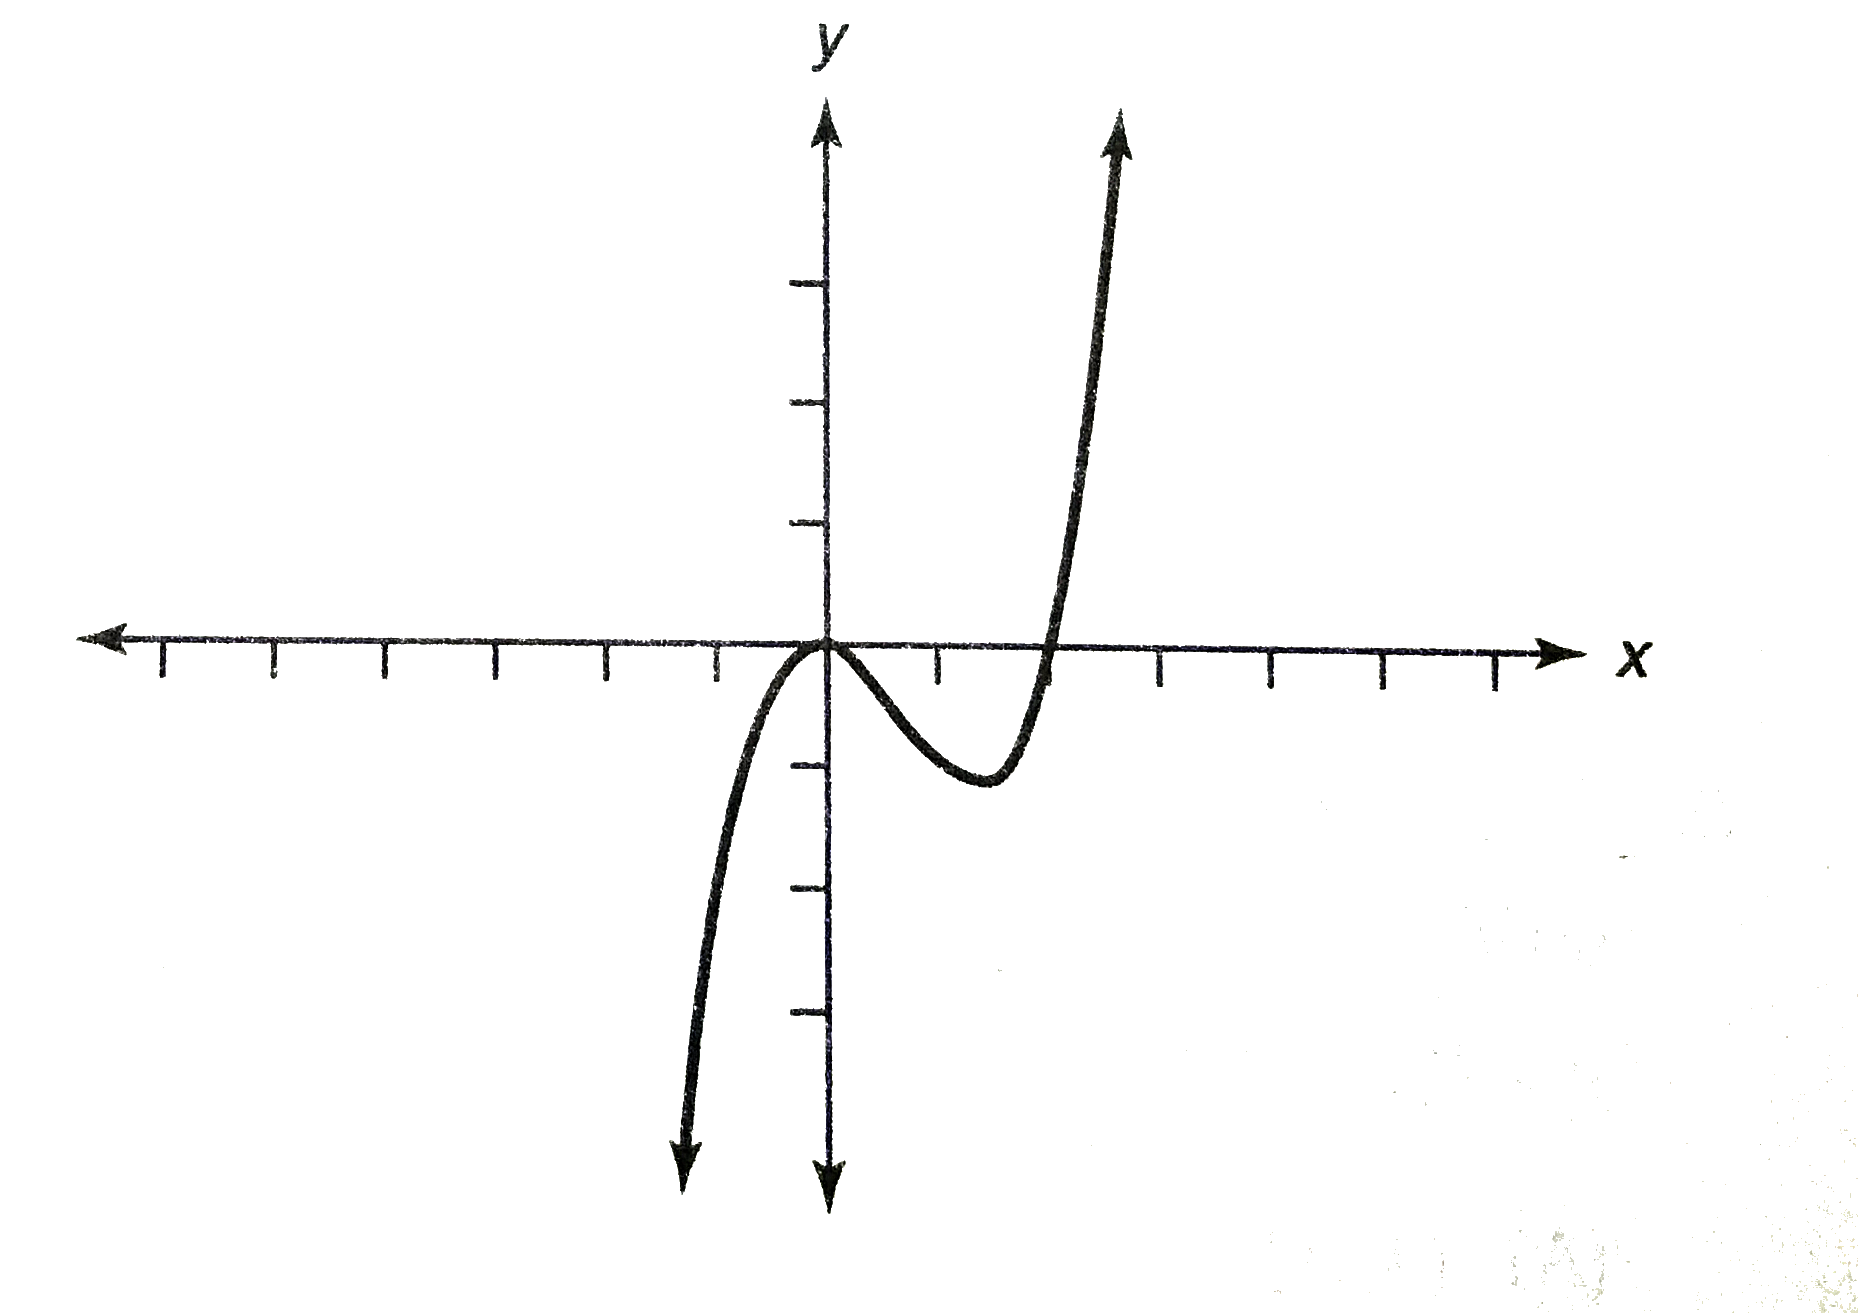
The figure above shows the graph of function f. If g(x)=−f(x), which graph represents function g?A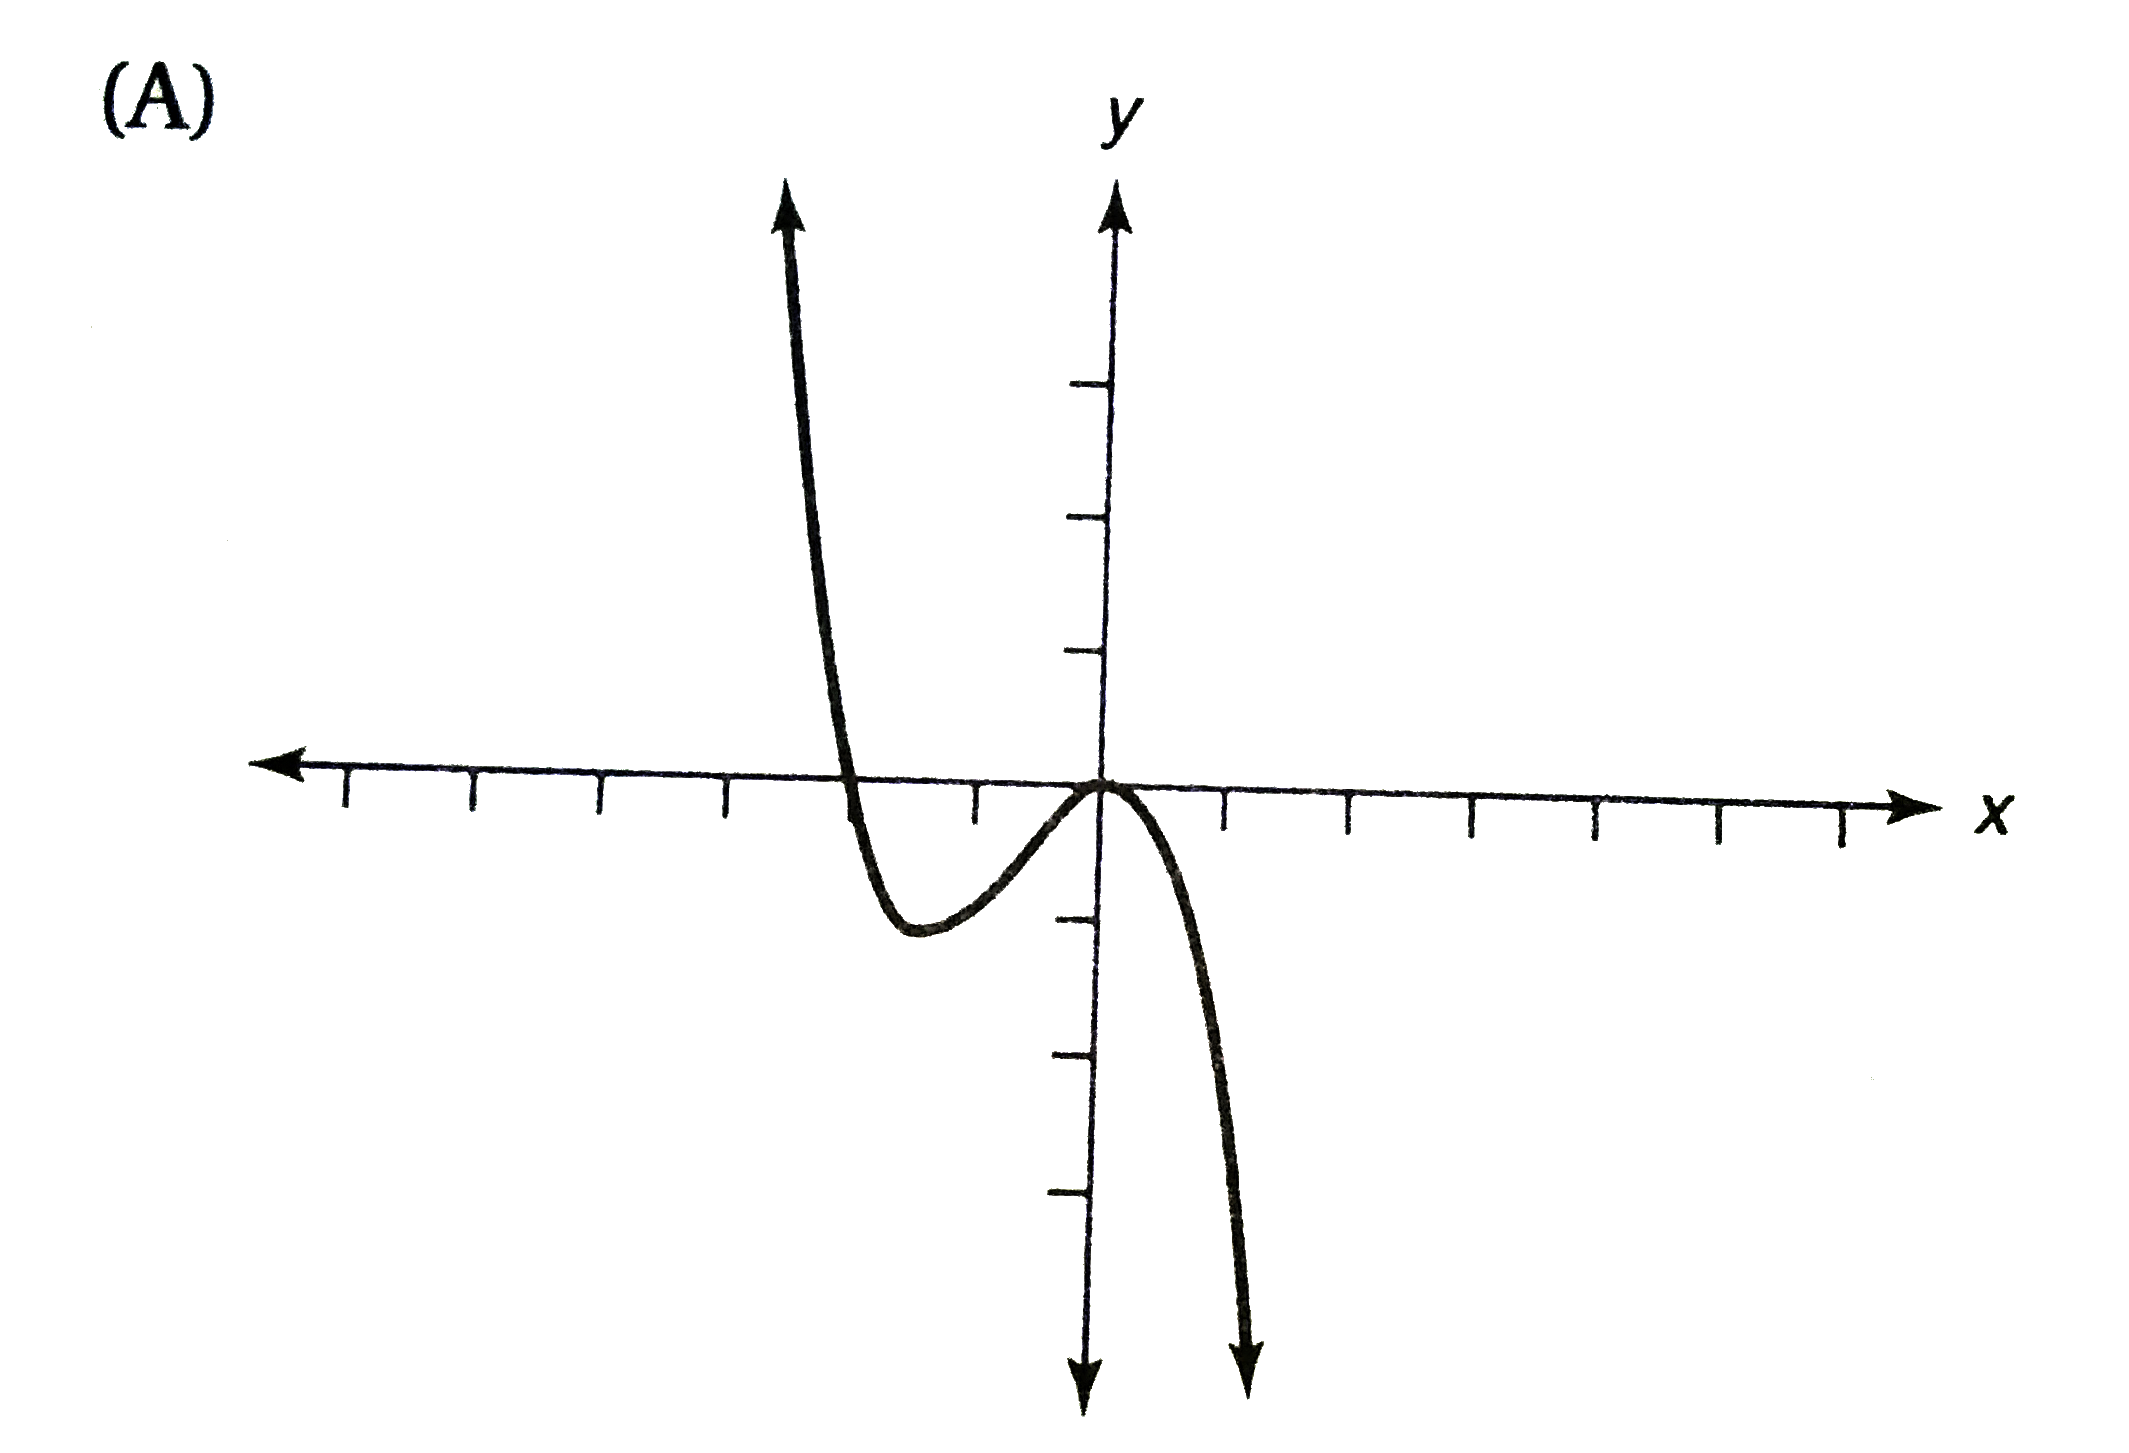 B
B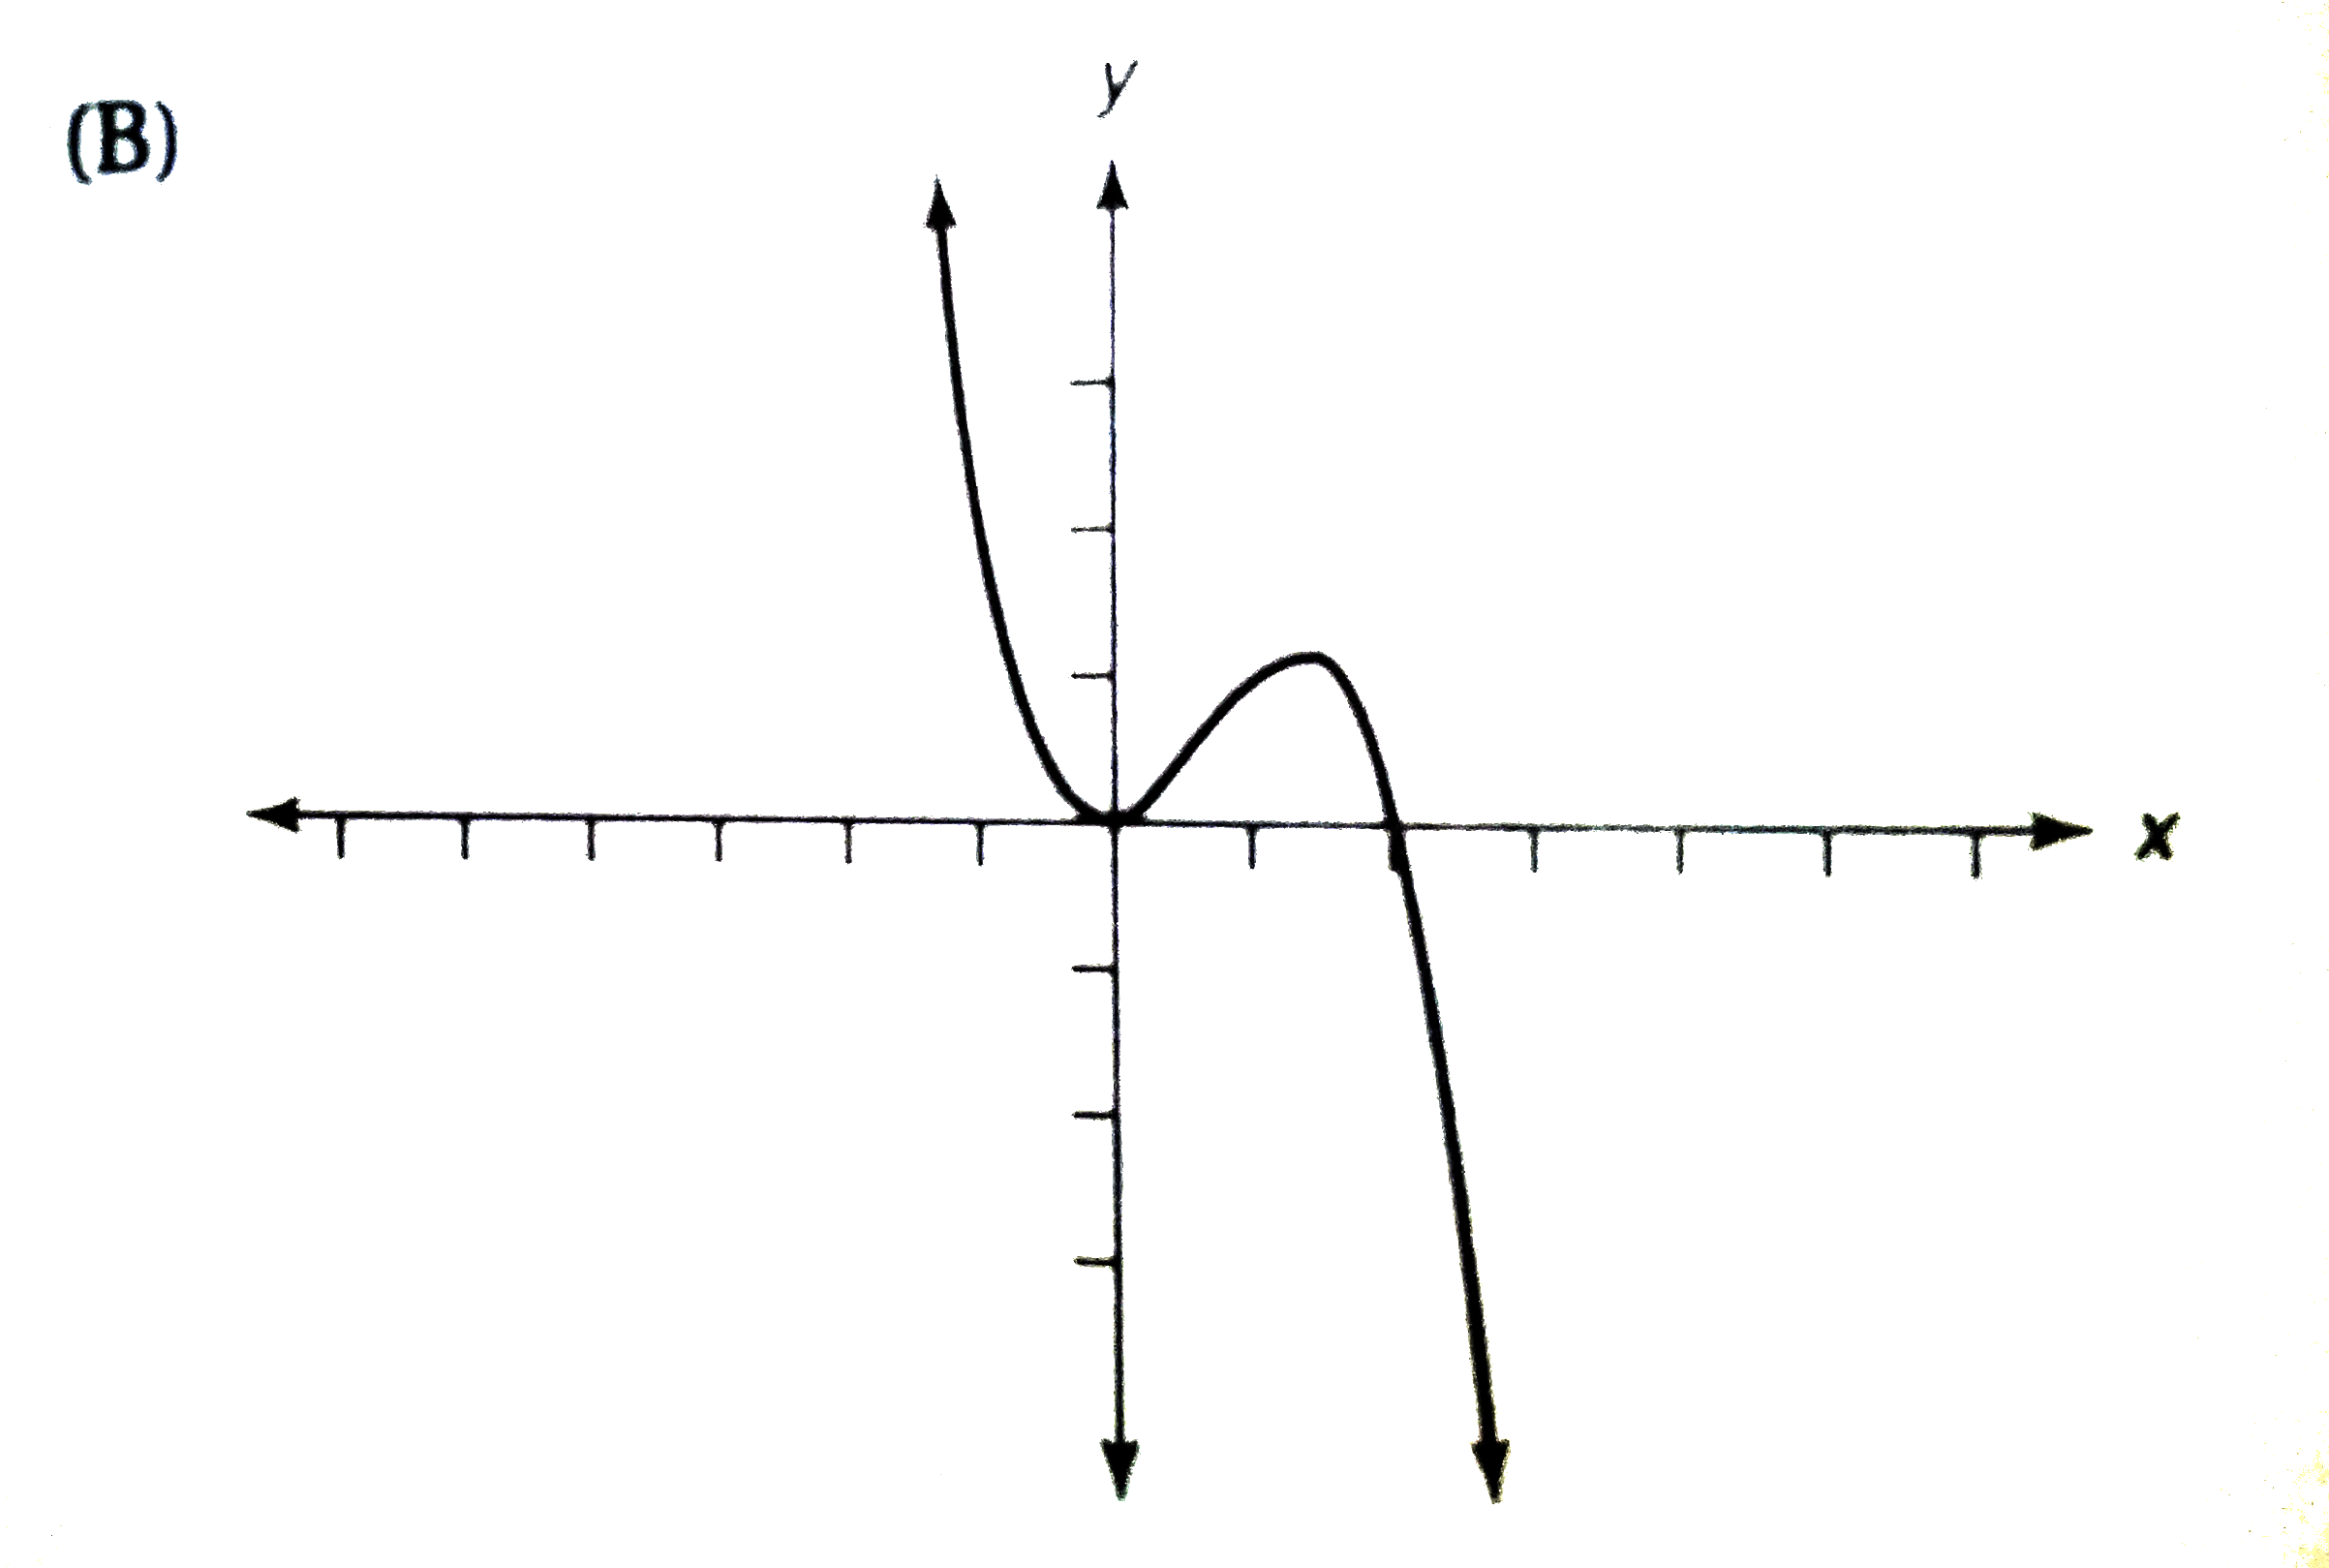 C
C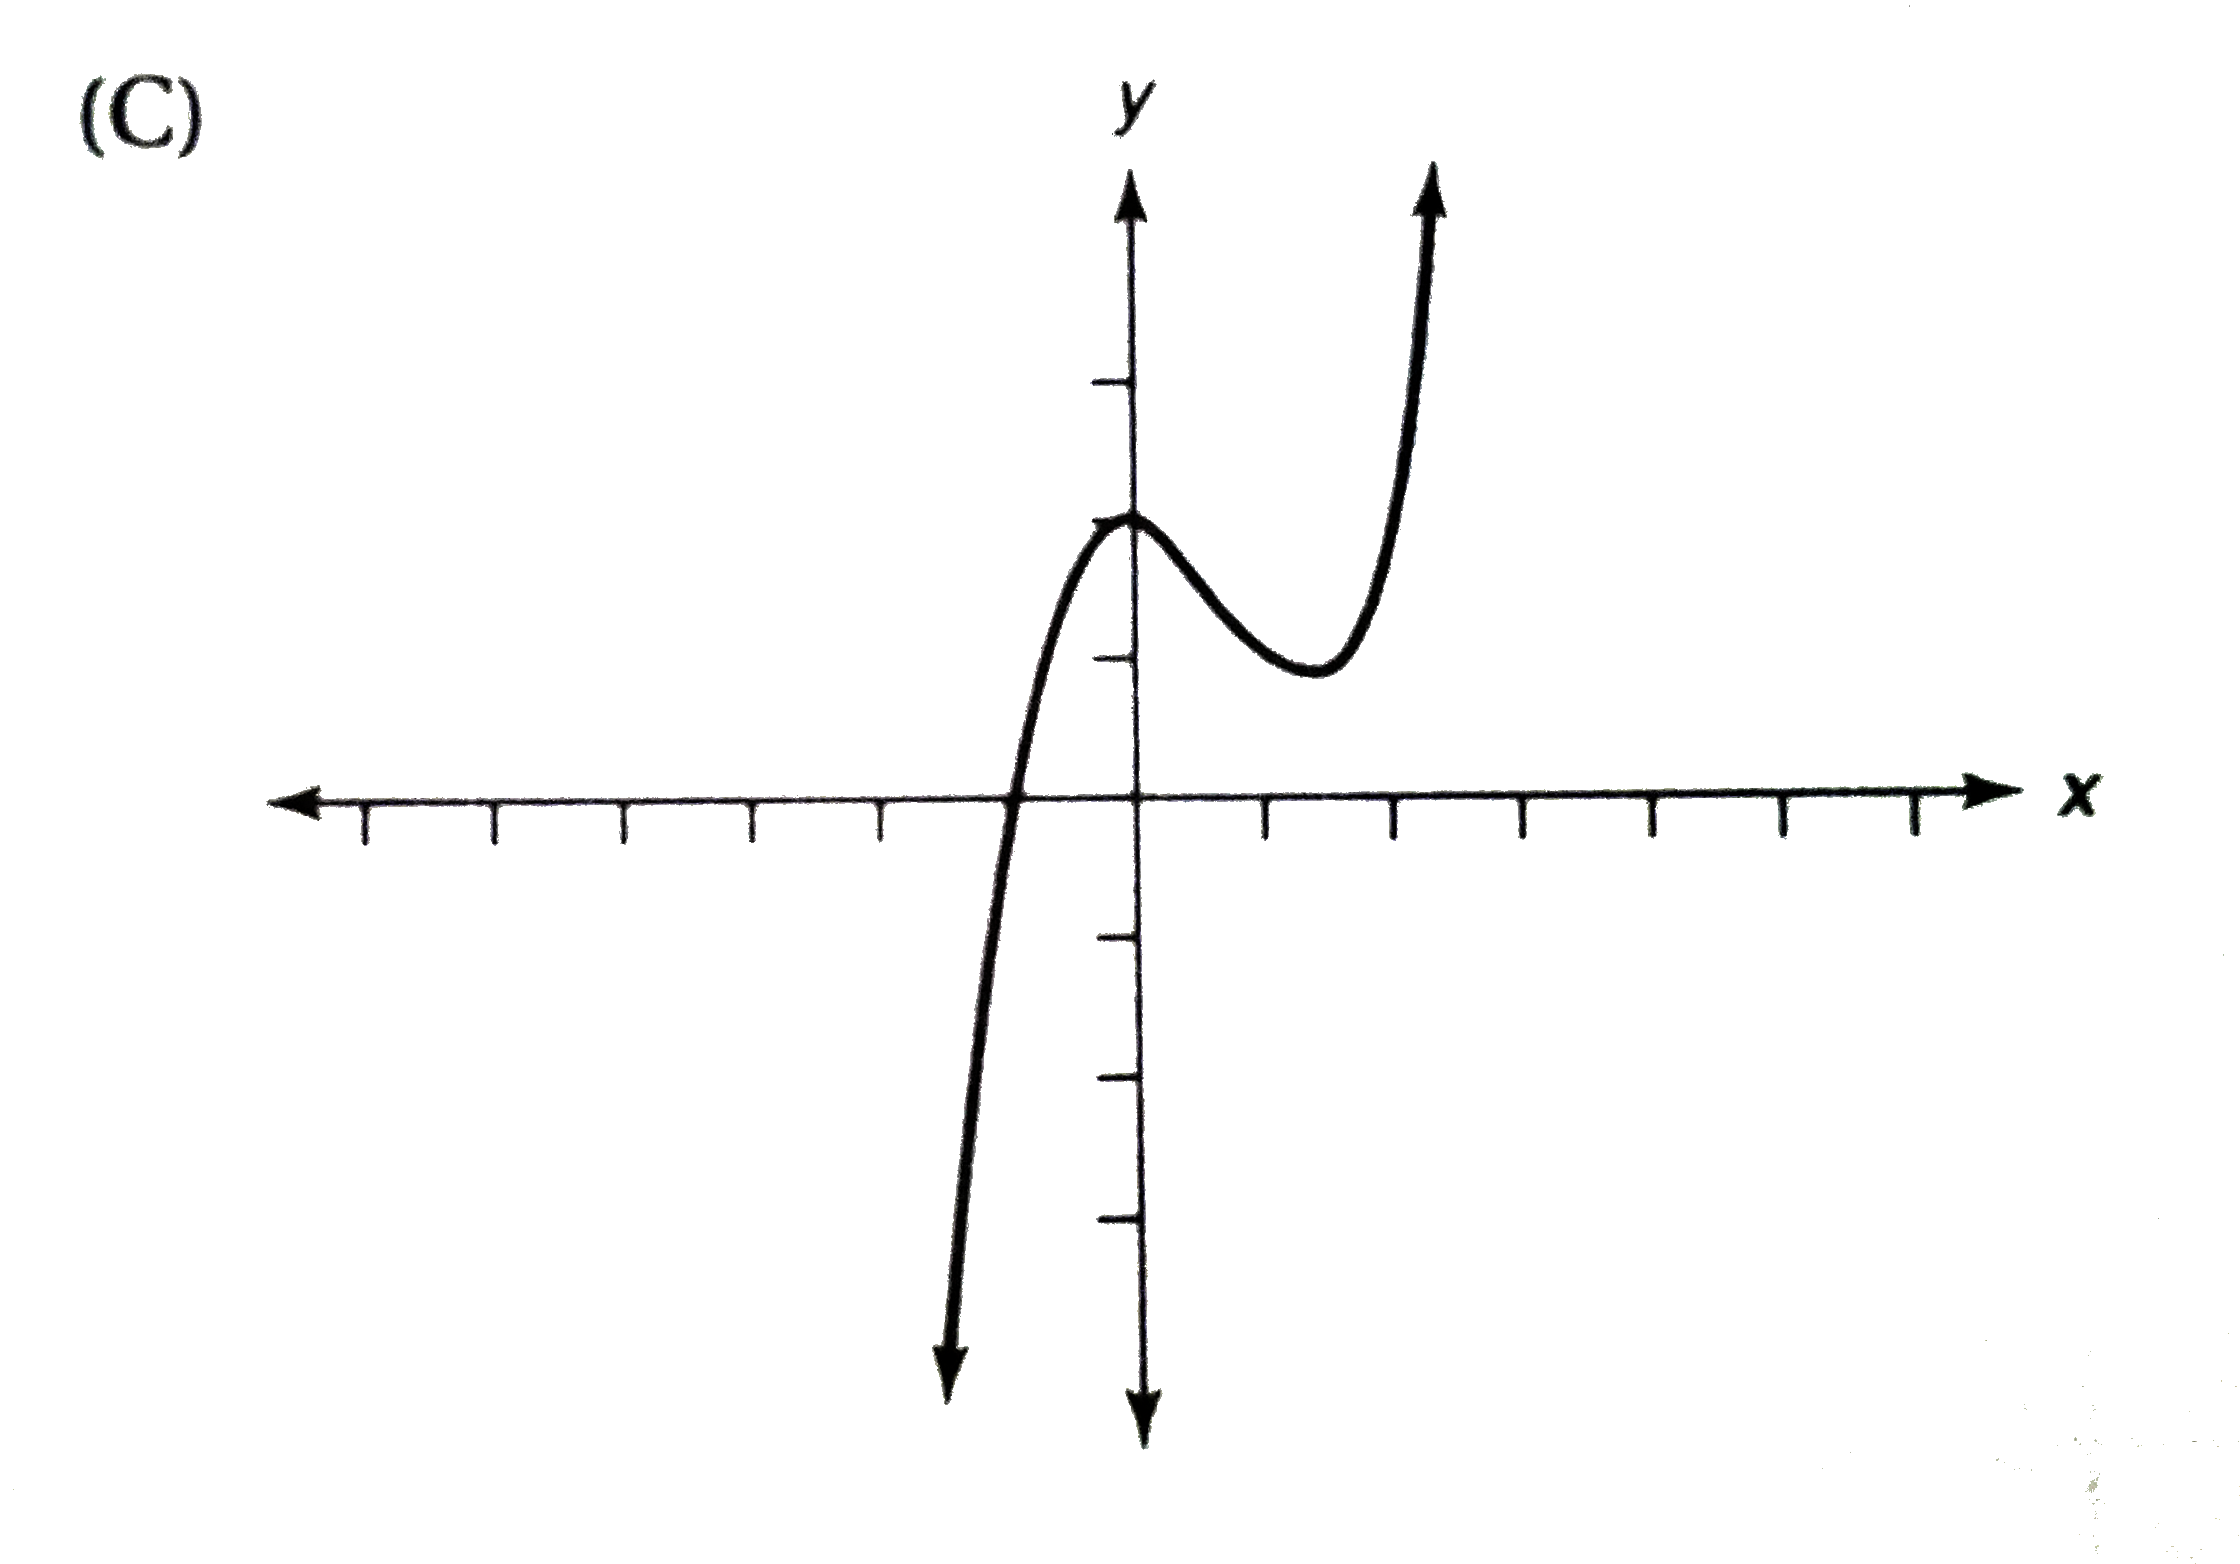 D
D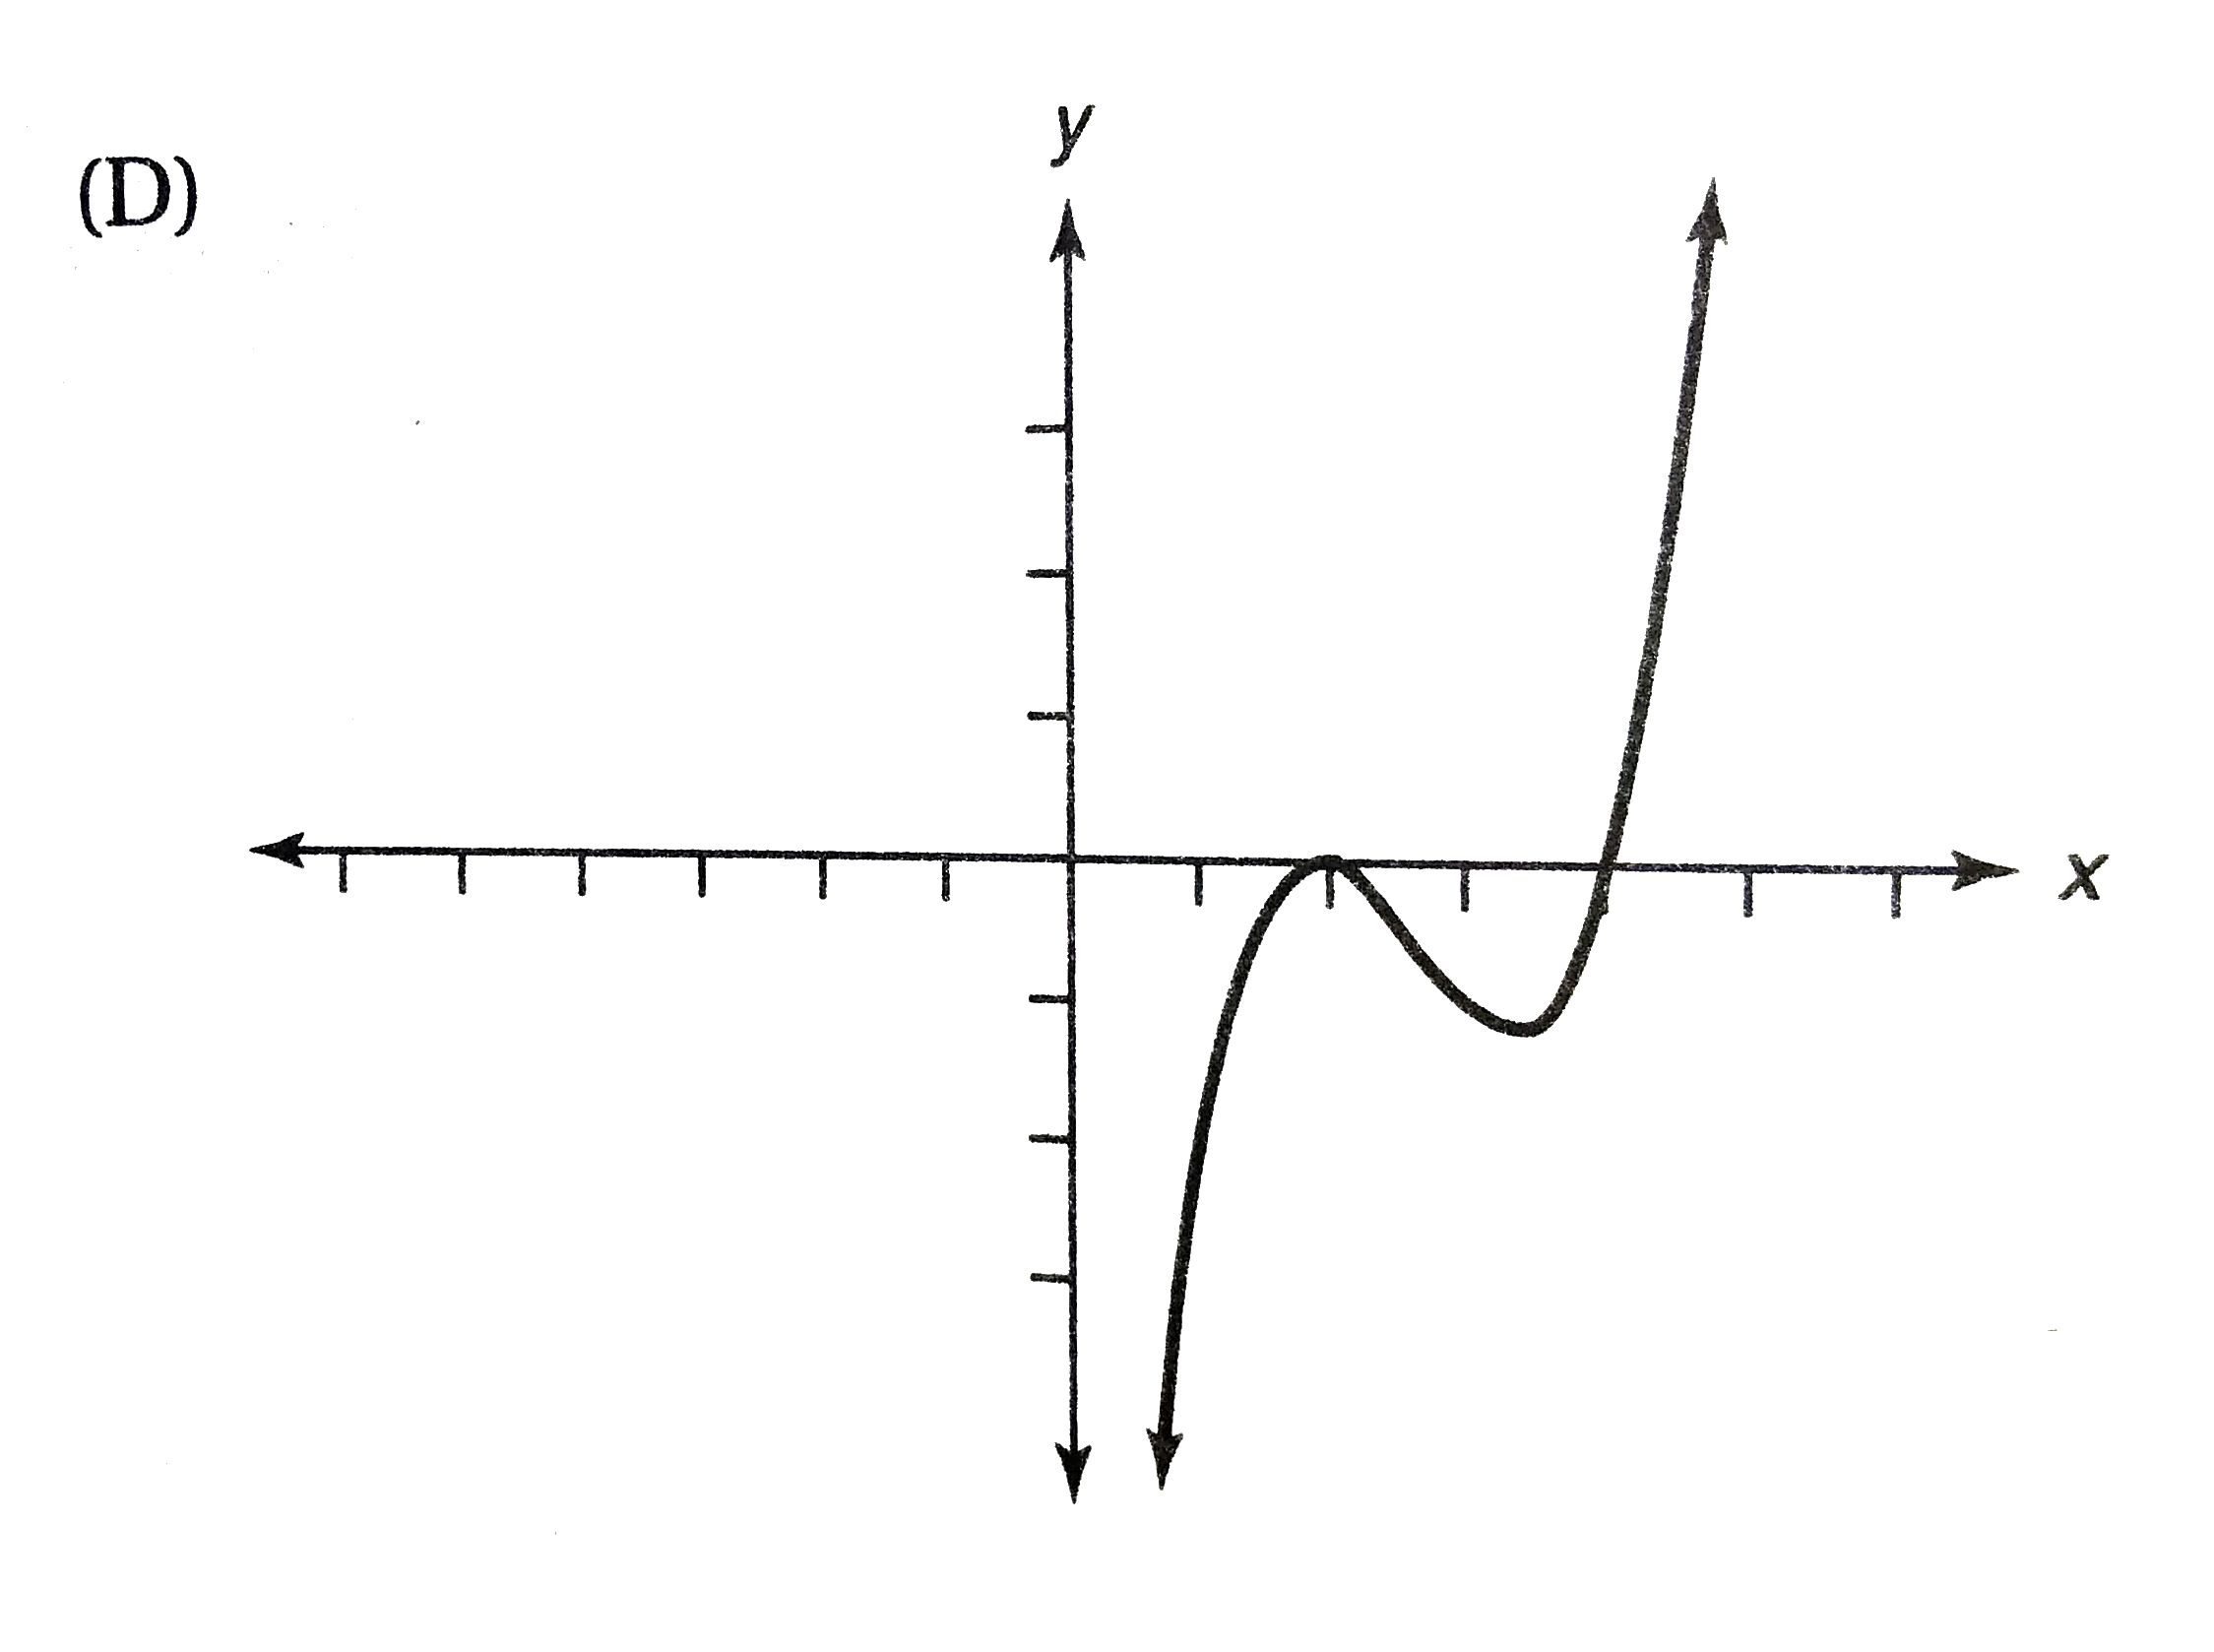
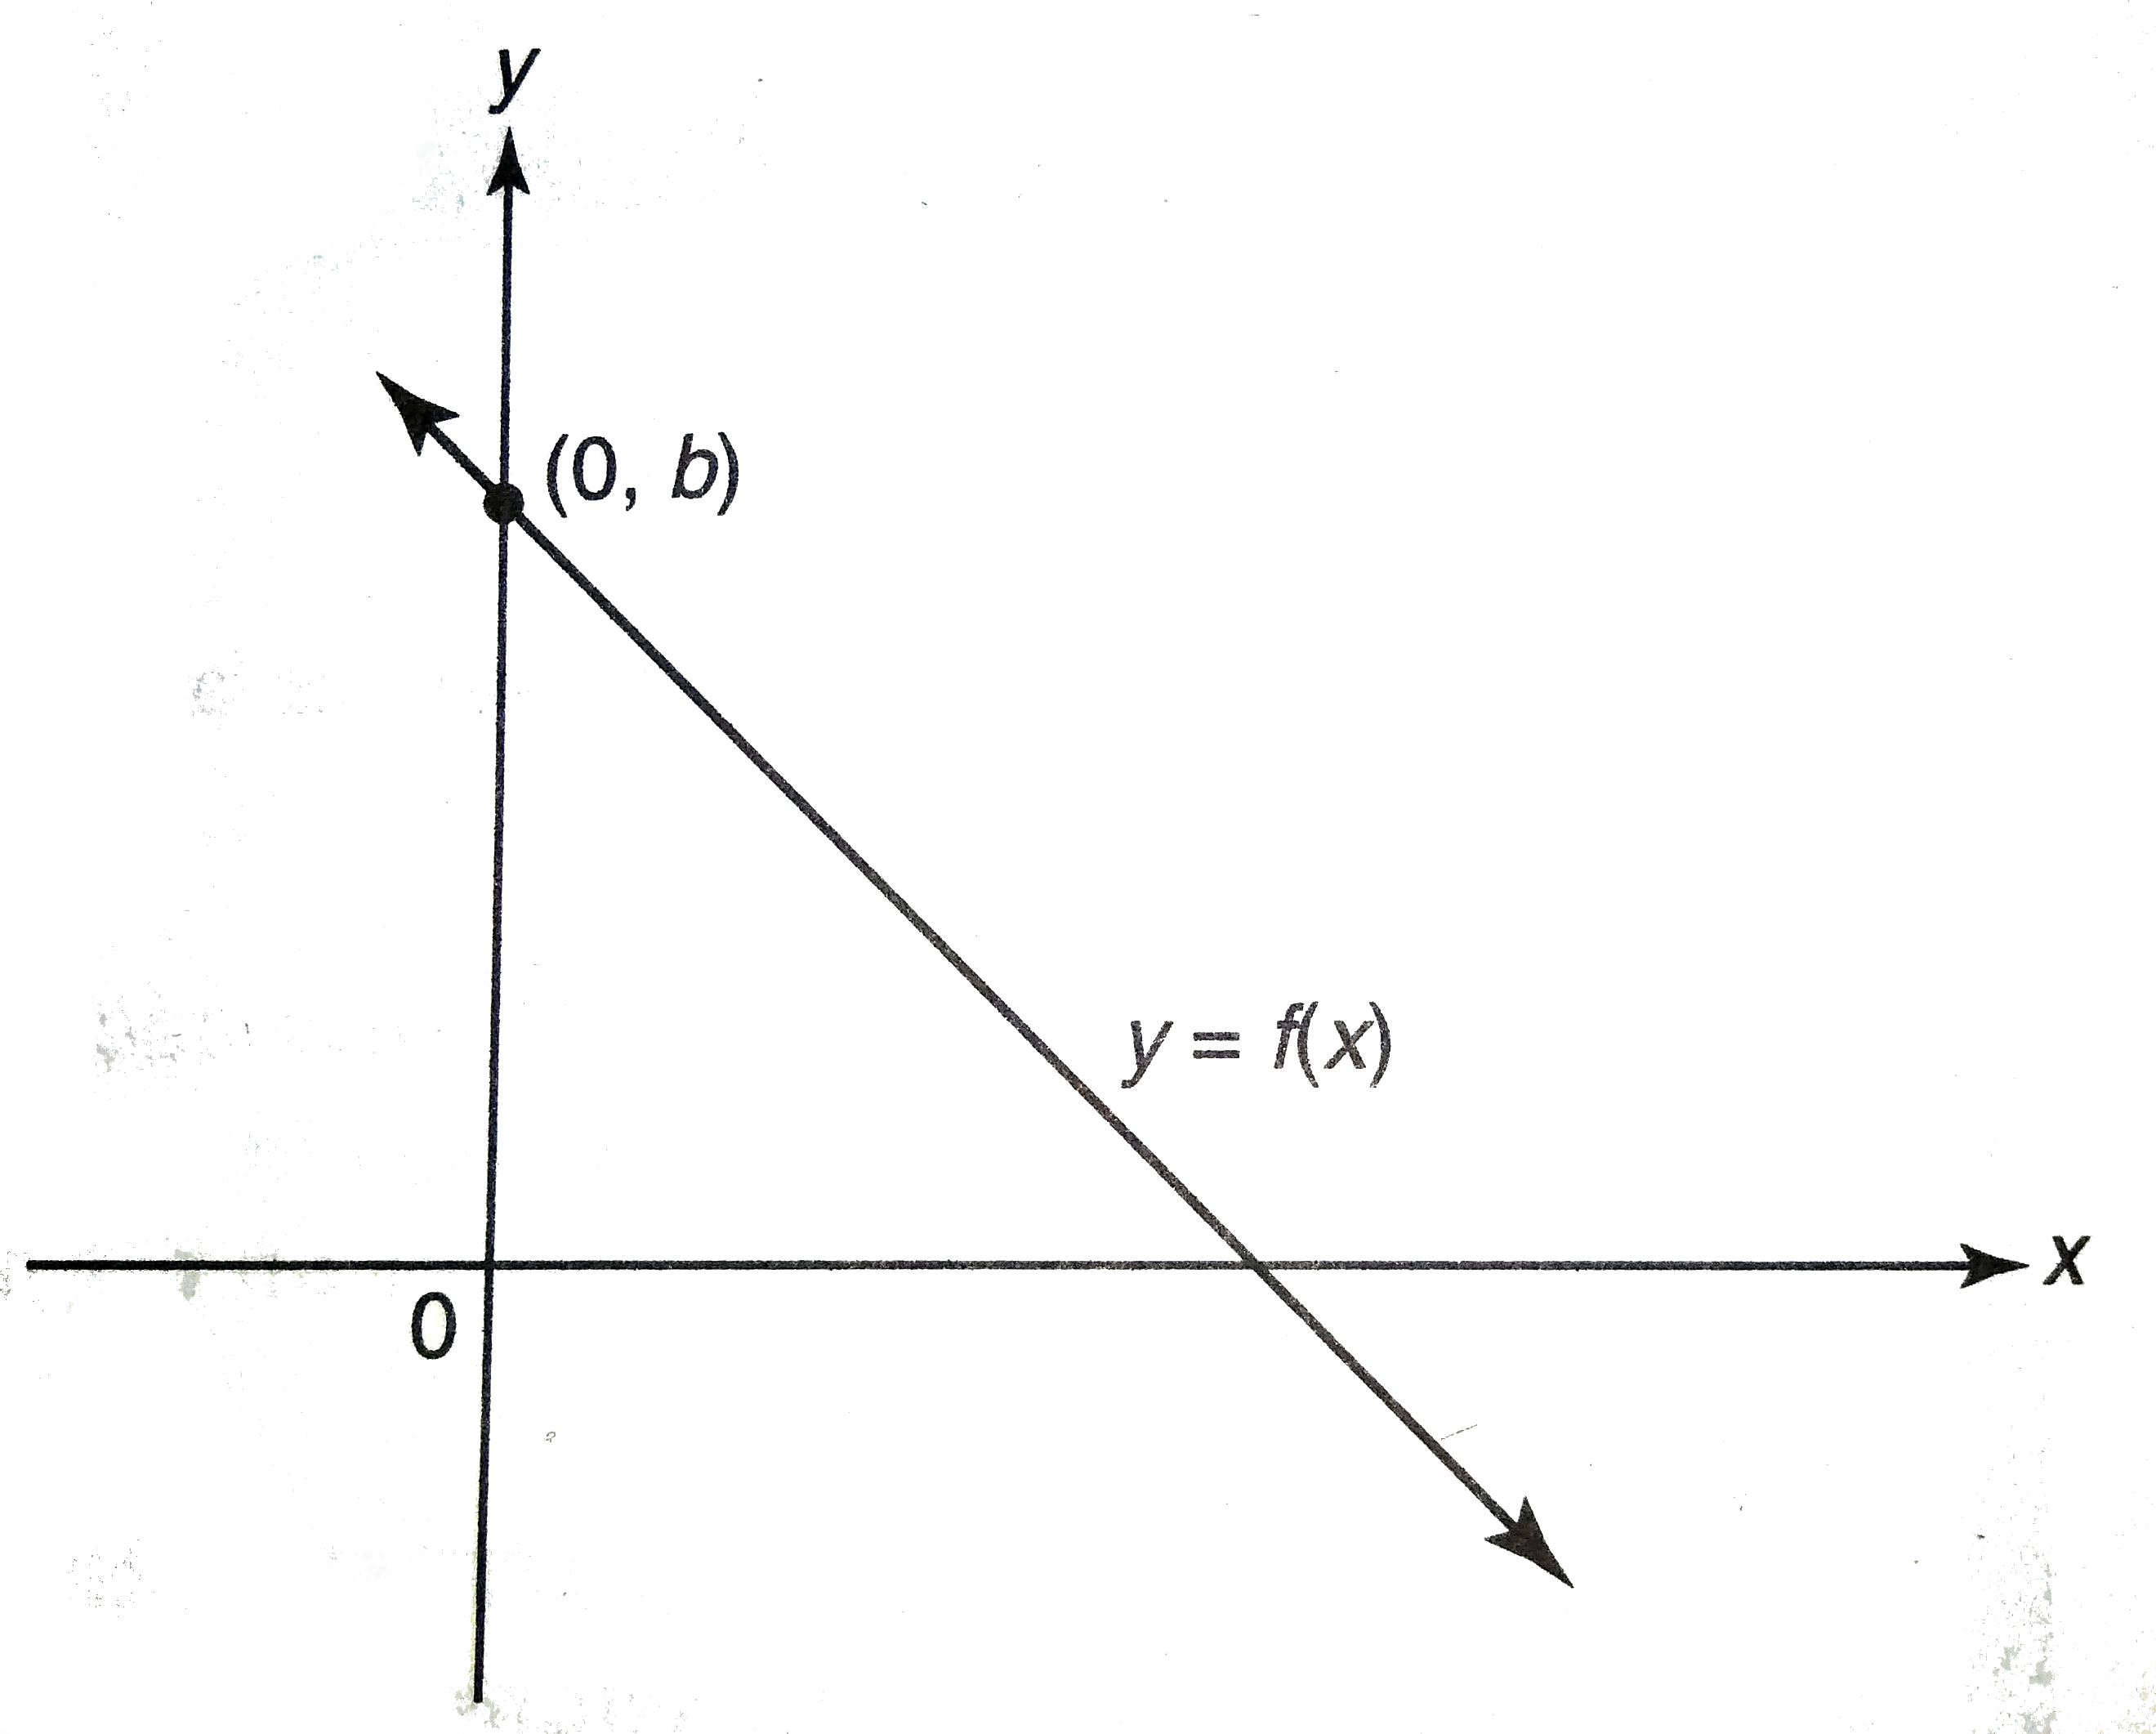
The figure above shows the graph of the linear function, y=f(x). If slope of the line is -2 and f(3)=4, what is the value of b?A8B9C10D11
In Figure shows the graph of f(x), what is the value of f(f(3)) ?
View Solution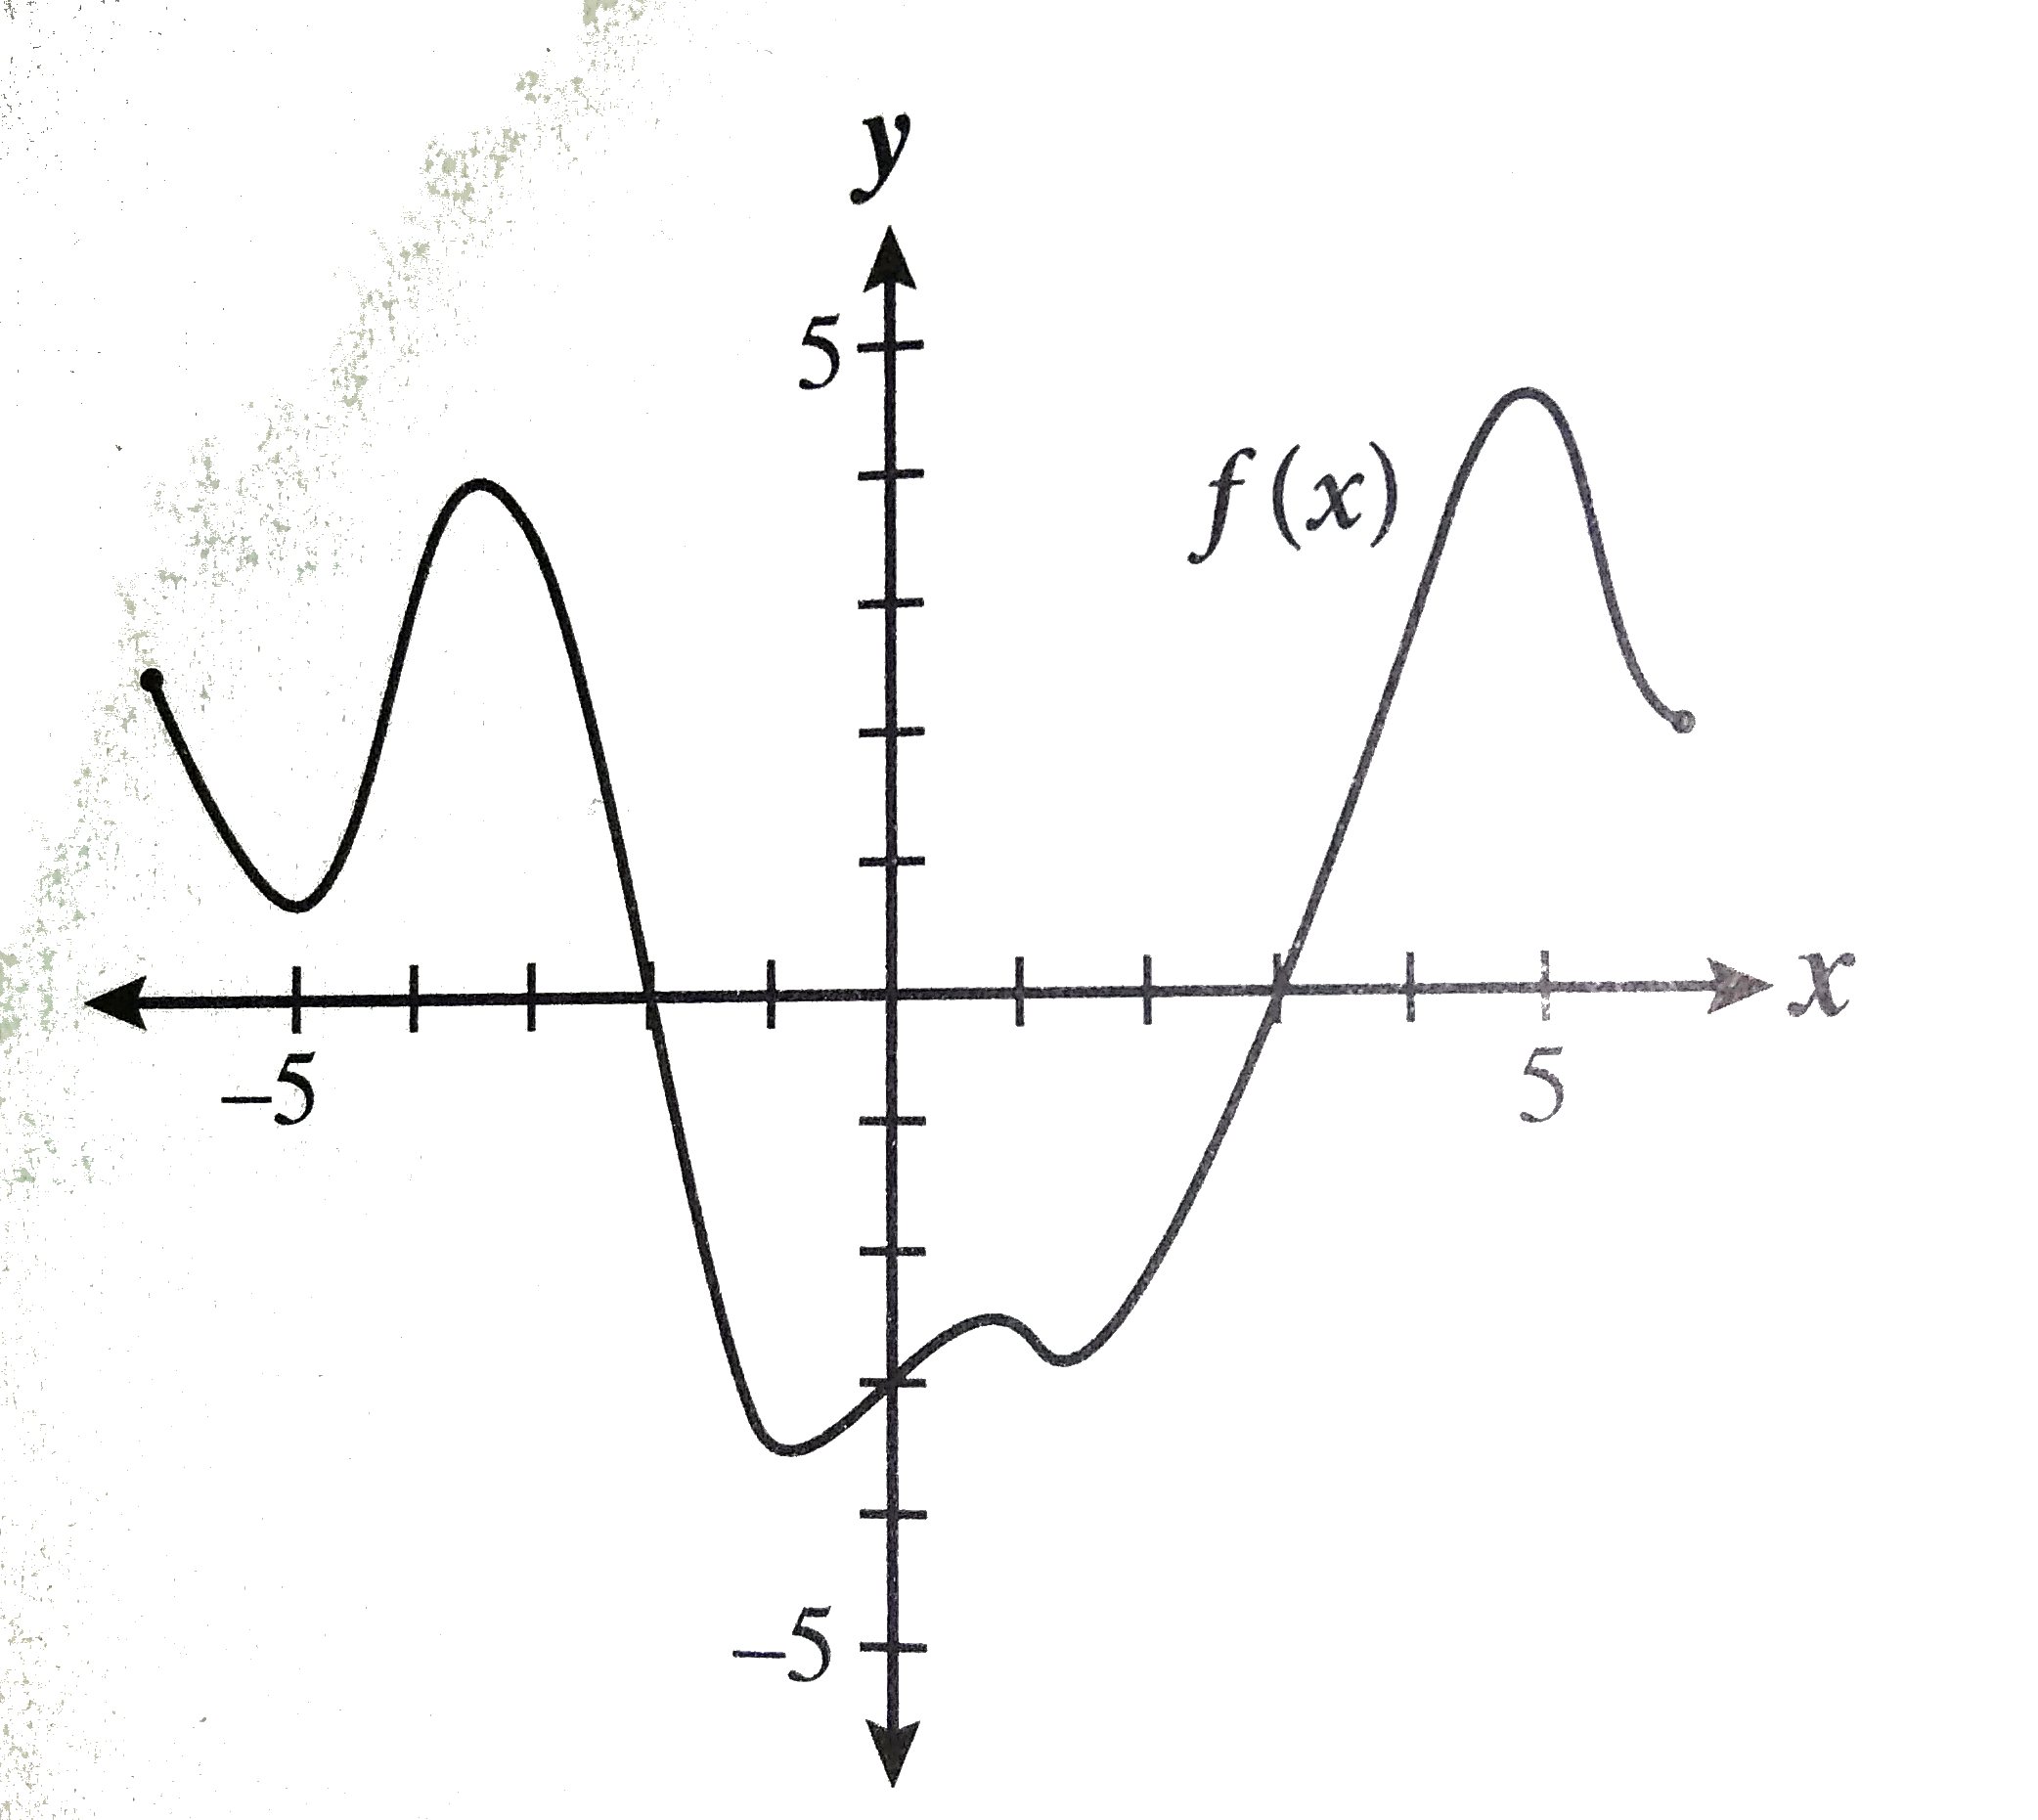
The figure above shows the graph of f(x). For which value(s) of x does f(x) equal 0?
View SolutionThe figure above shows the graph of function h. If function f is defined by f(x)=h(2x)+1, what is the value of f(−1)?
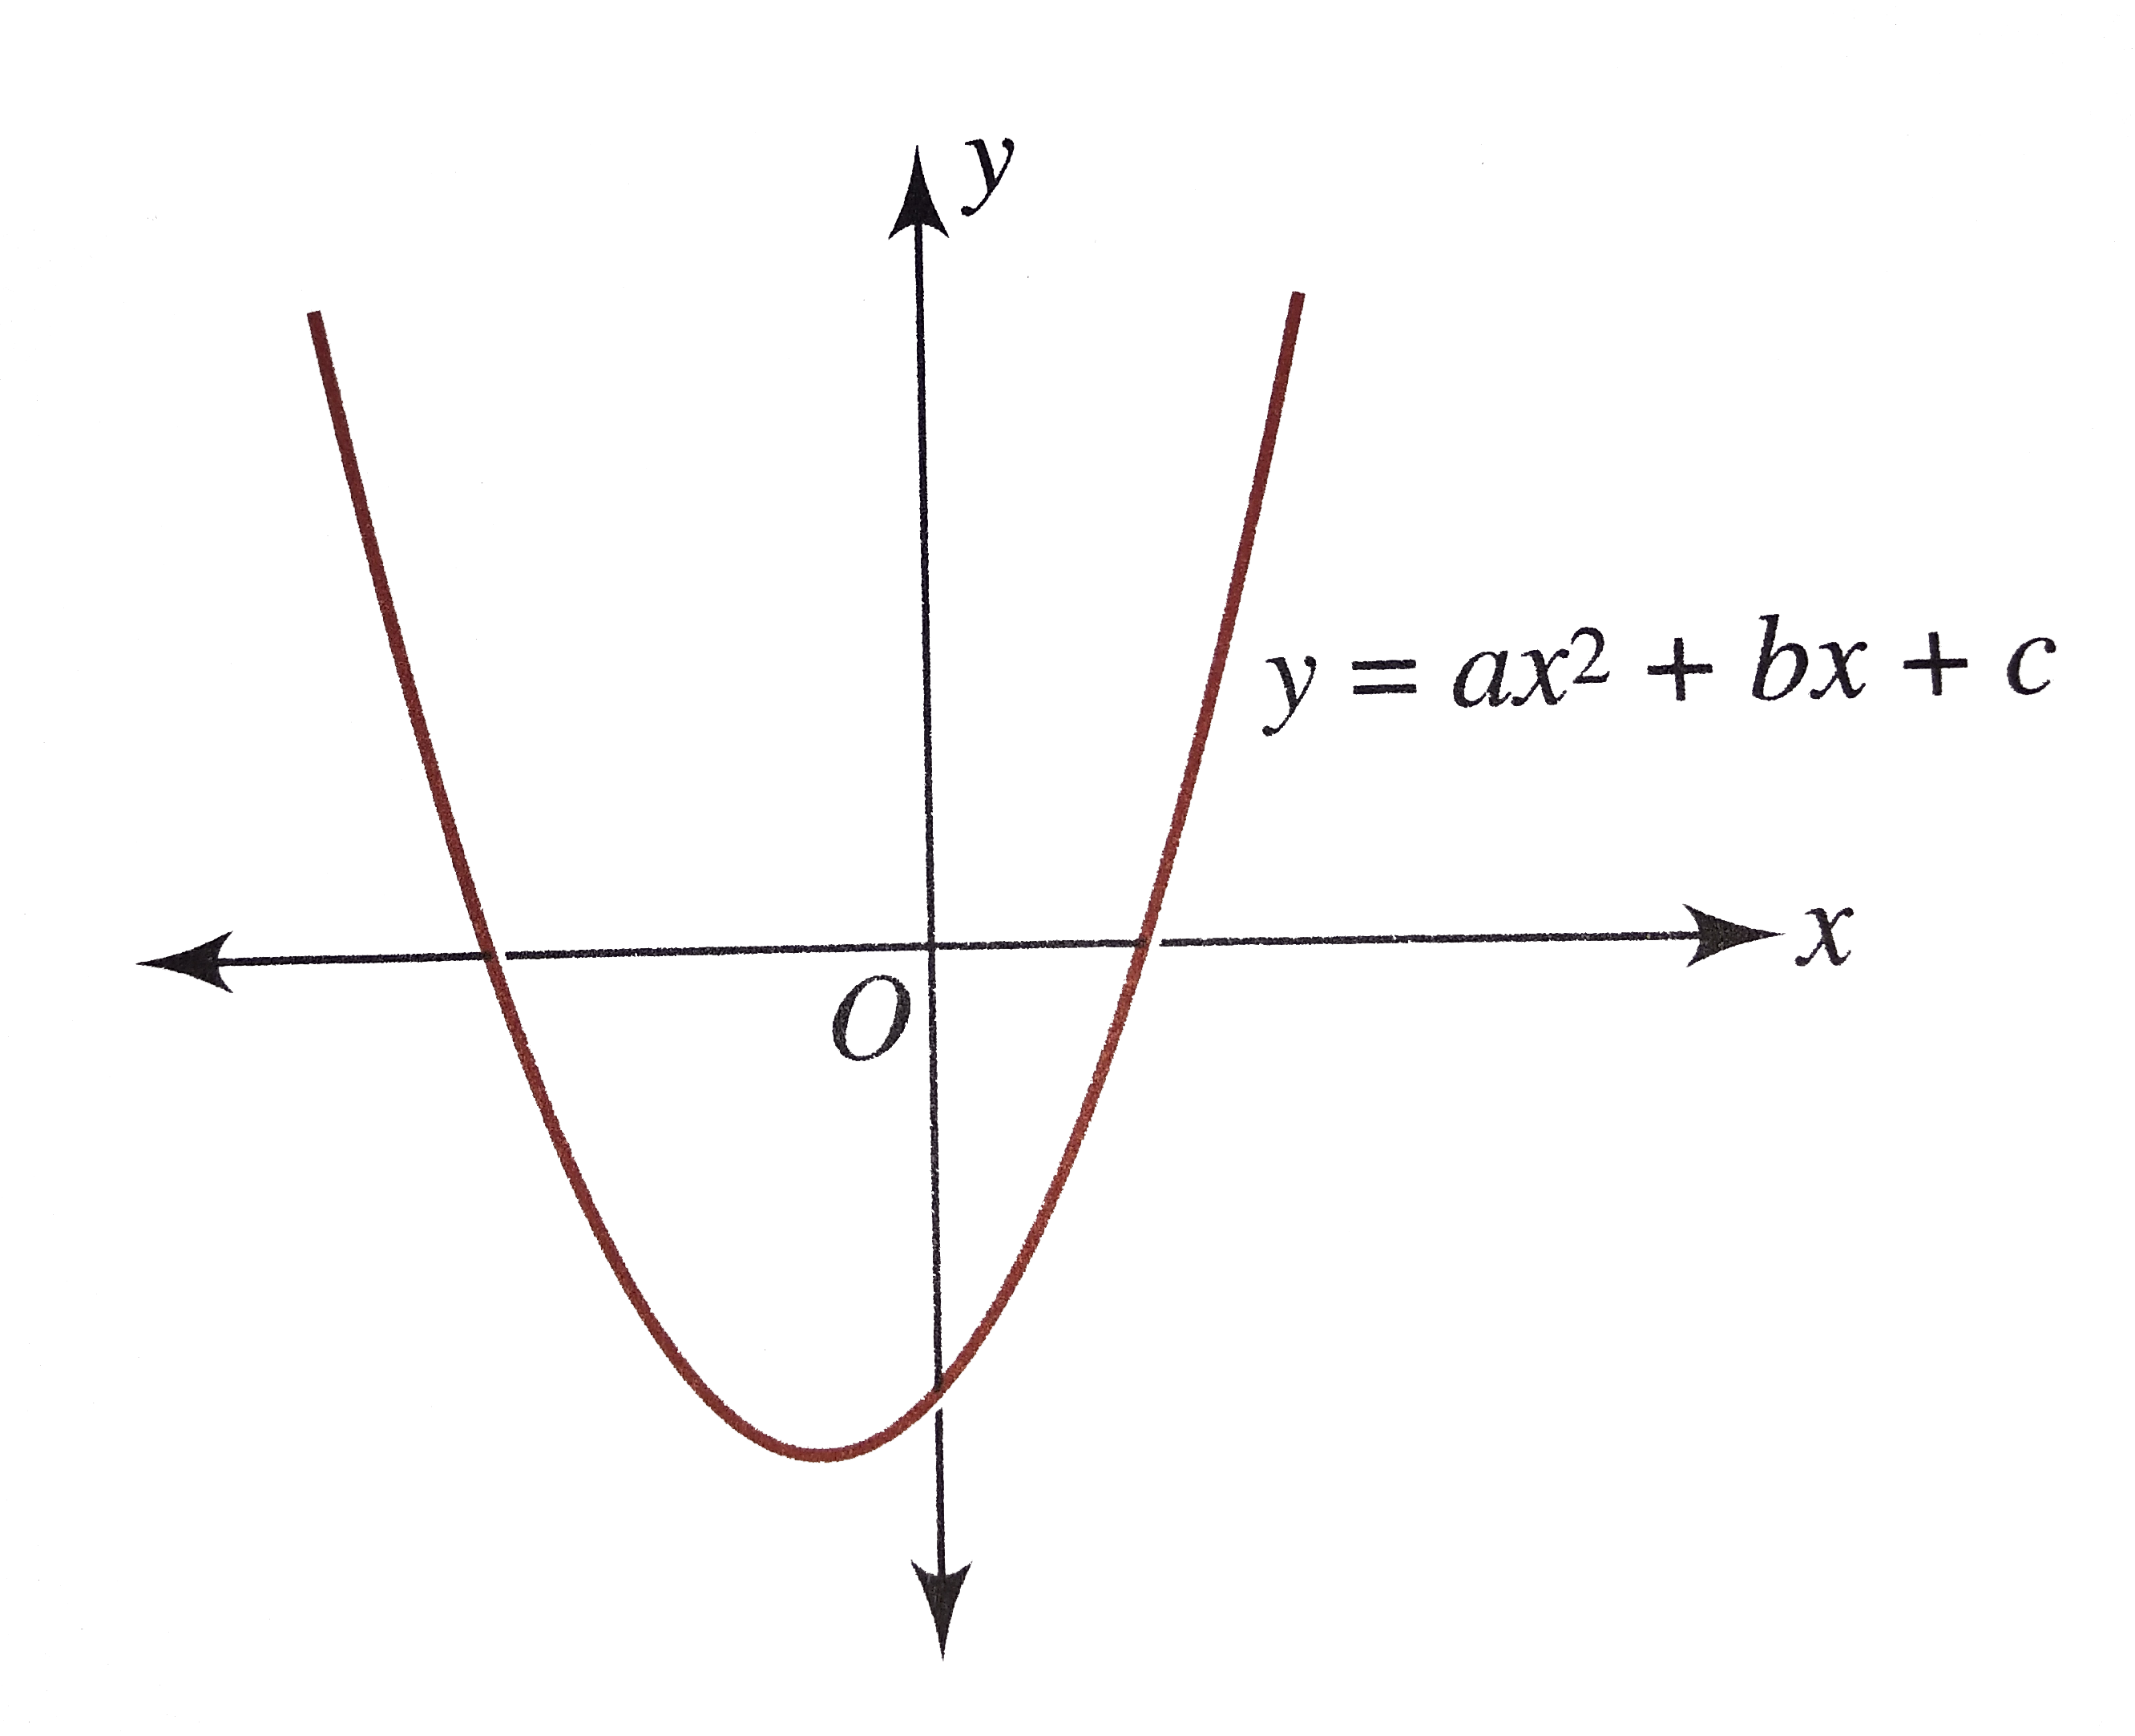
View SolutionThe following figure shows the graph of f(x)=ax2+bx+c, then find the sign of values of a,bandc.
View SolutionThe following figure shows the graphs of a differentiable fucntion y=f(x) on the interval [a,b] (not contaning 0).
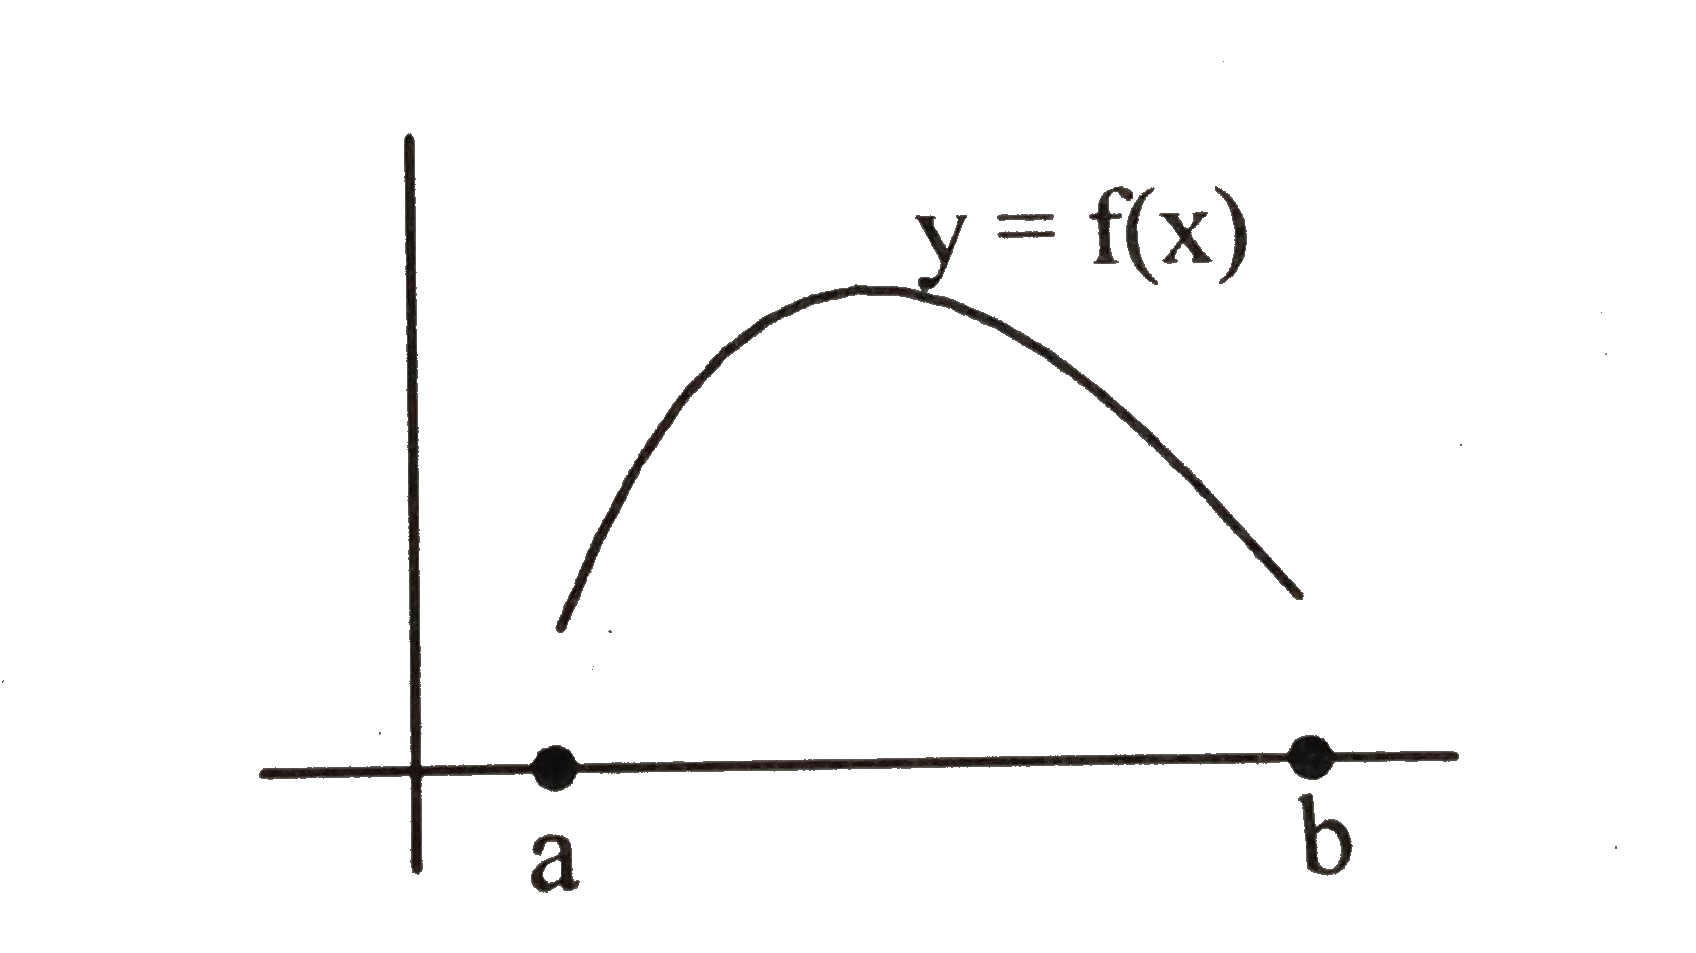
Let g(x)=f(x)/x which of the following is a possible graph of y=g(x) ?
View Solution
