Draw the graph of .Solution in Bengali
We have , which is an odd function.
Domain of the function is
1. y-intercept
f(0)=0
So the graph cuts the y-axis at (0,0).
2. x-intercept (zeros)
Put y=0 or
So the graph meets the x-axis at (0,0) and .
3. Asymptotes
Vertical asymptotes
Clearly , the graph has vertical asymptote , where the denominator becomes zero.
Horizontal asymptotes
Clearly, the graph has no horizontal asymptote as the degree of the numerator is higher than the degree of the numerator is higher than the degree of the denominator.
Oblique asymptotes ltbr>
Hence the oblique asymptote is .
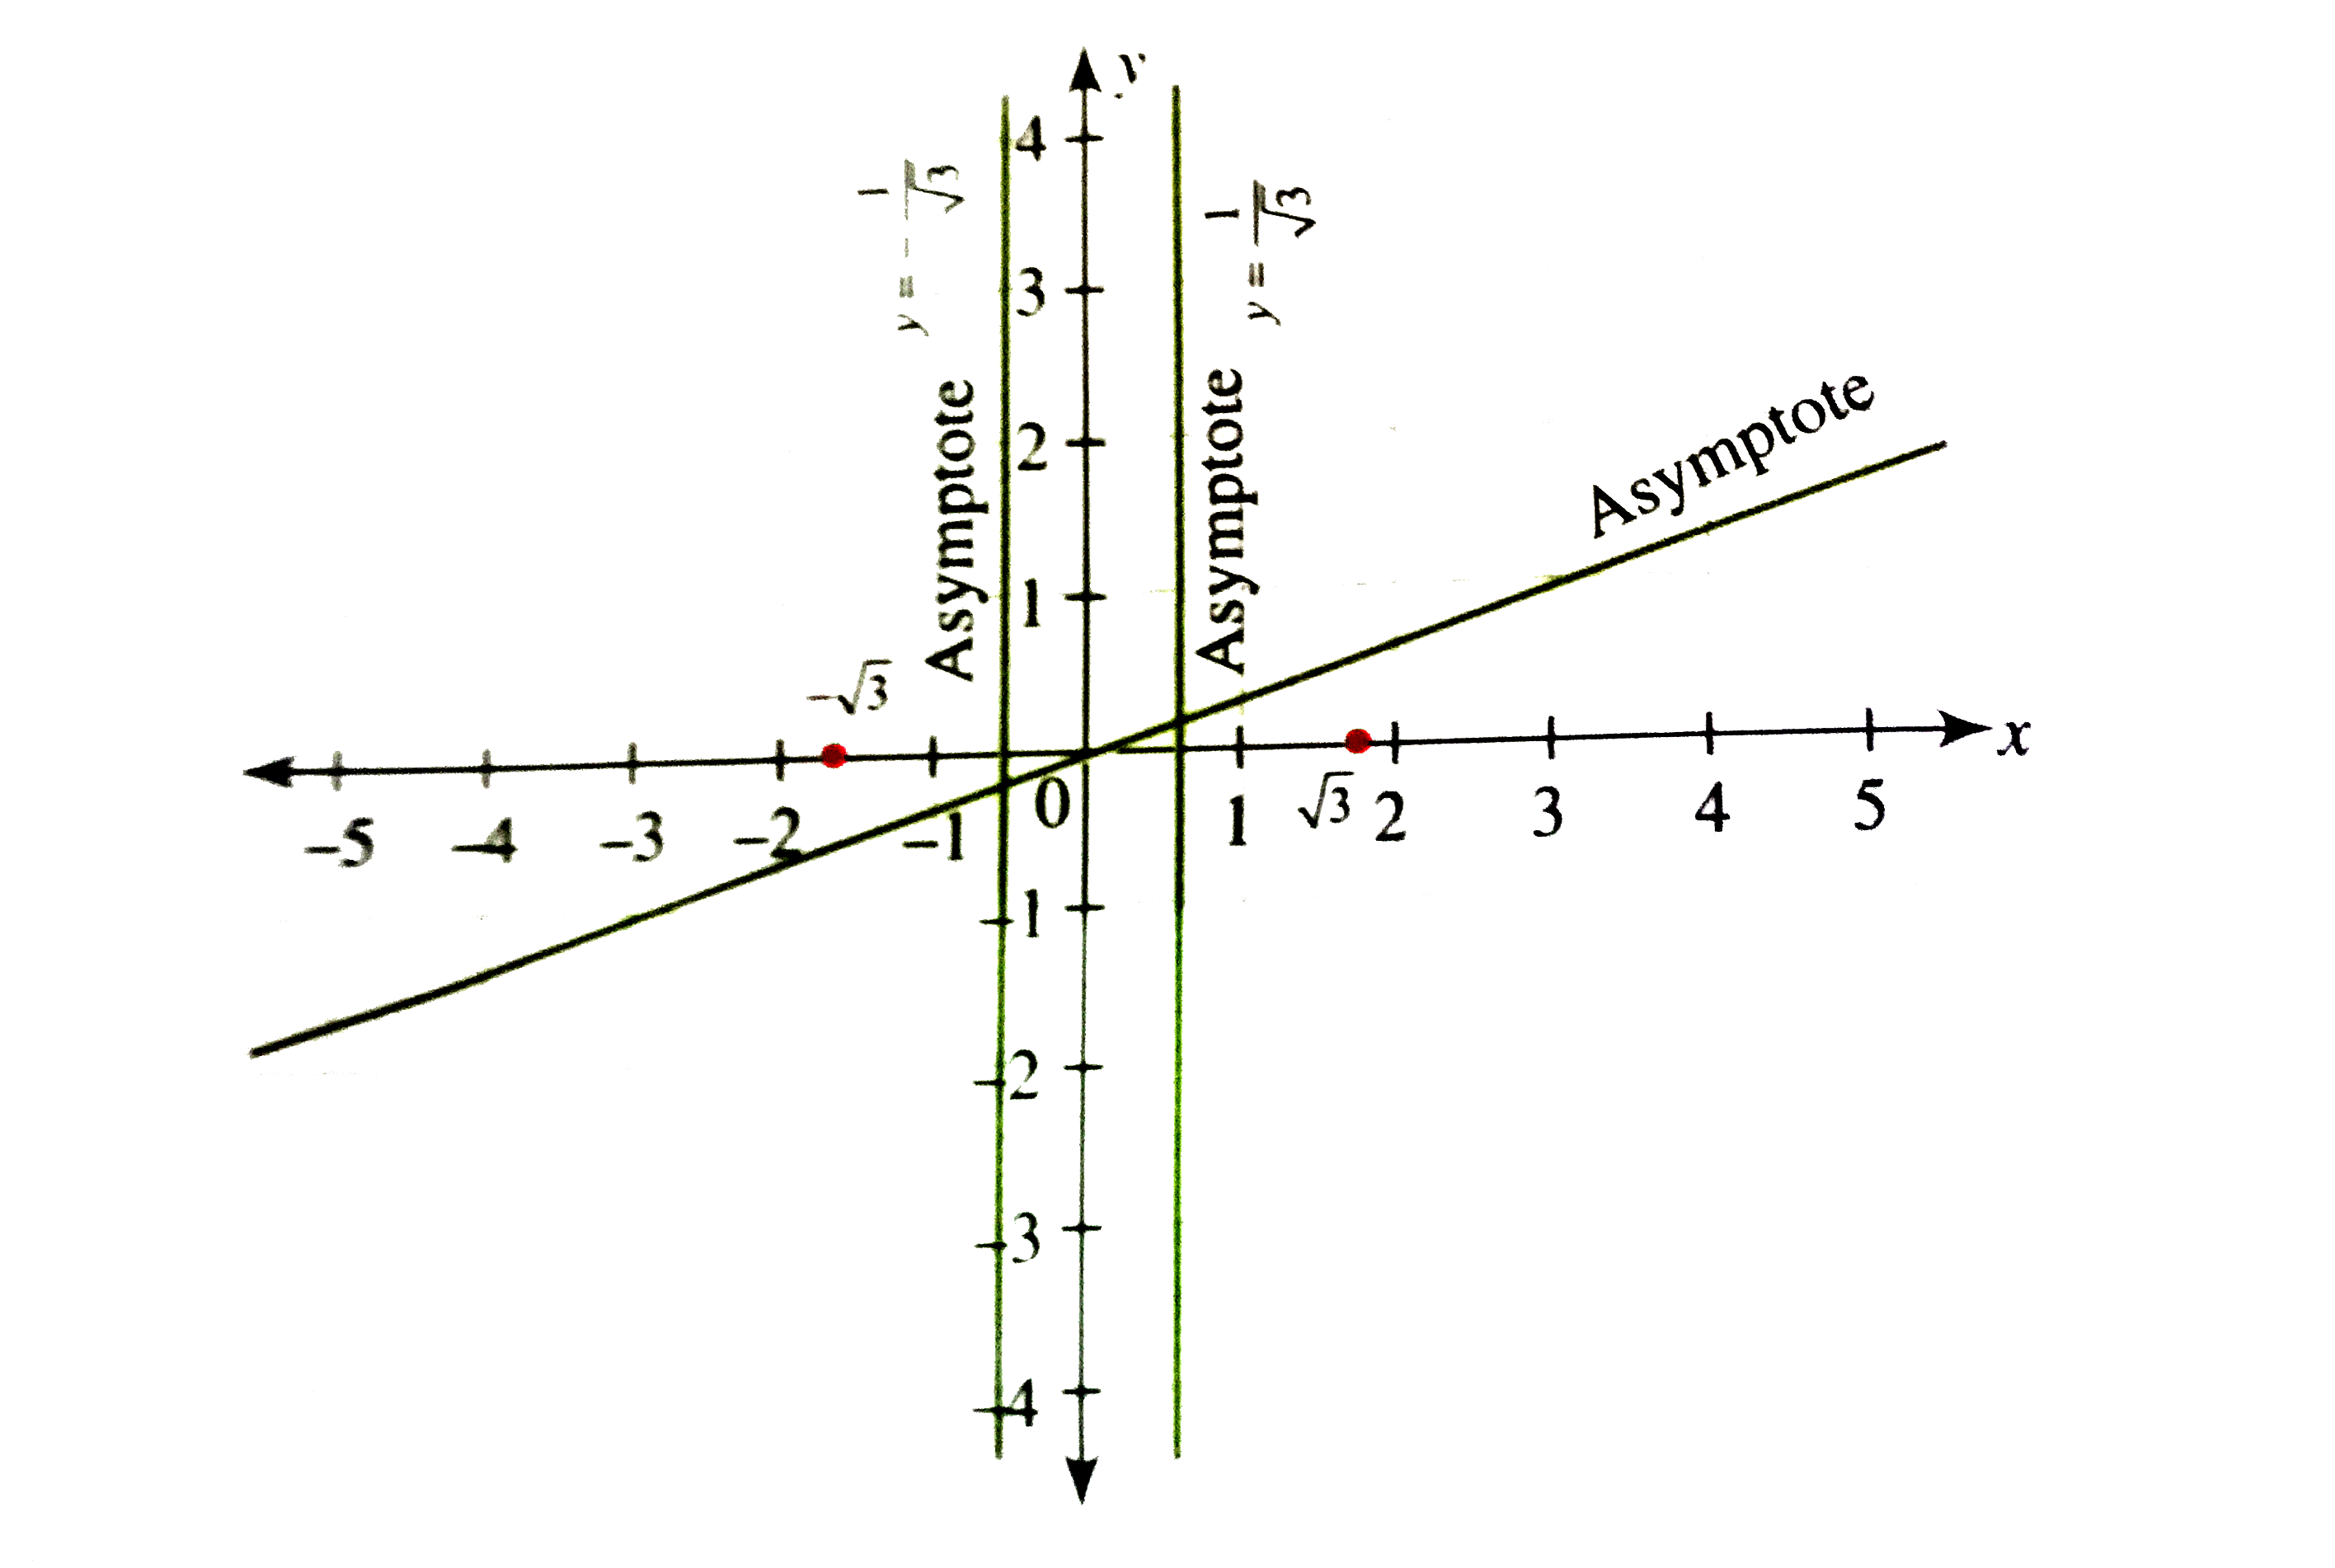
Thus, important points ans lines are as shown in the following figure.

4. Monotinicity/Extremum
Hence the function is increasing throughout.
and
f(x) approaches asymptote as .
Thus, in , f(x) increases from to intersecting the x-axis at
and
Thus, in , f(x) increases from to intersecting the x-axis at (0,0).
and
Thus, in increases from to intersecting the x-axis at .
f(x) approaches asymptote as .
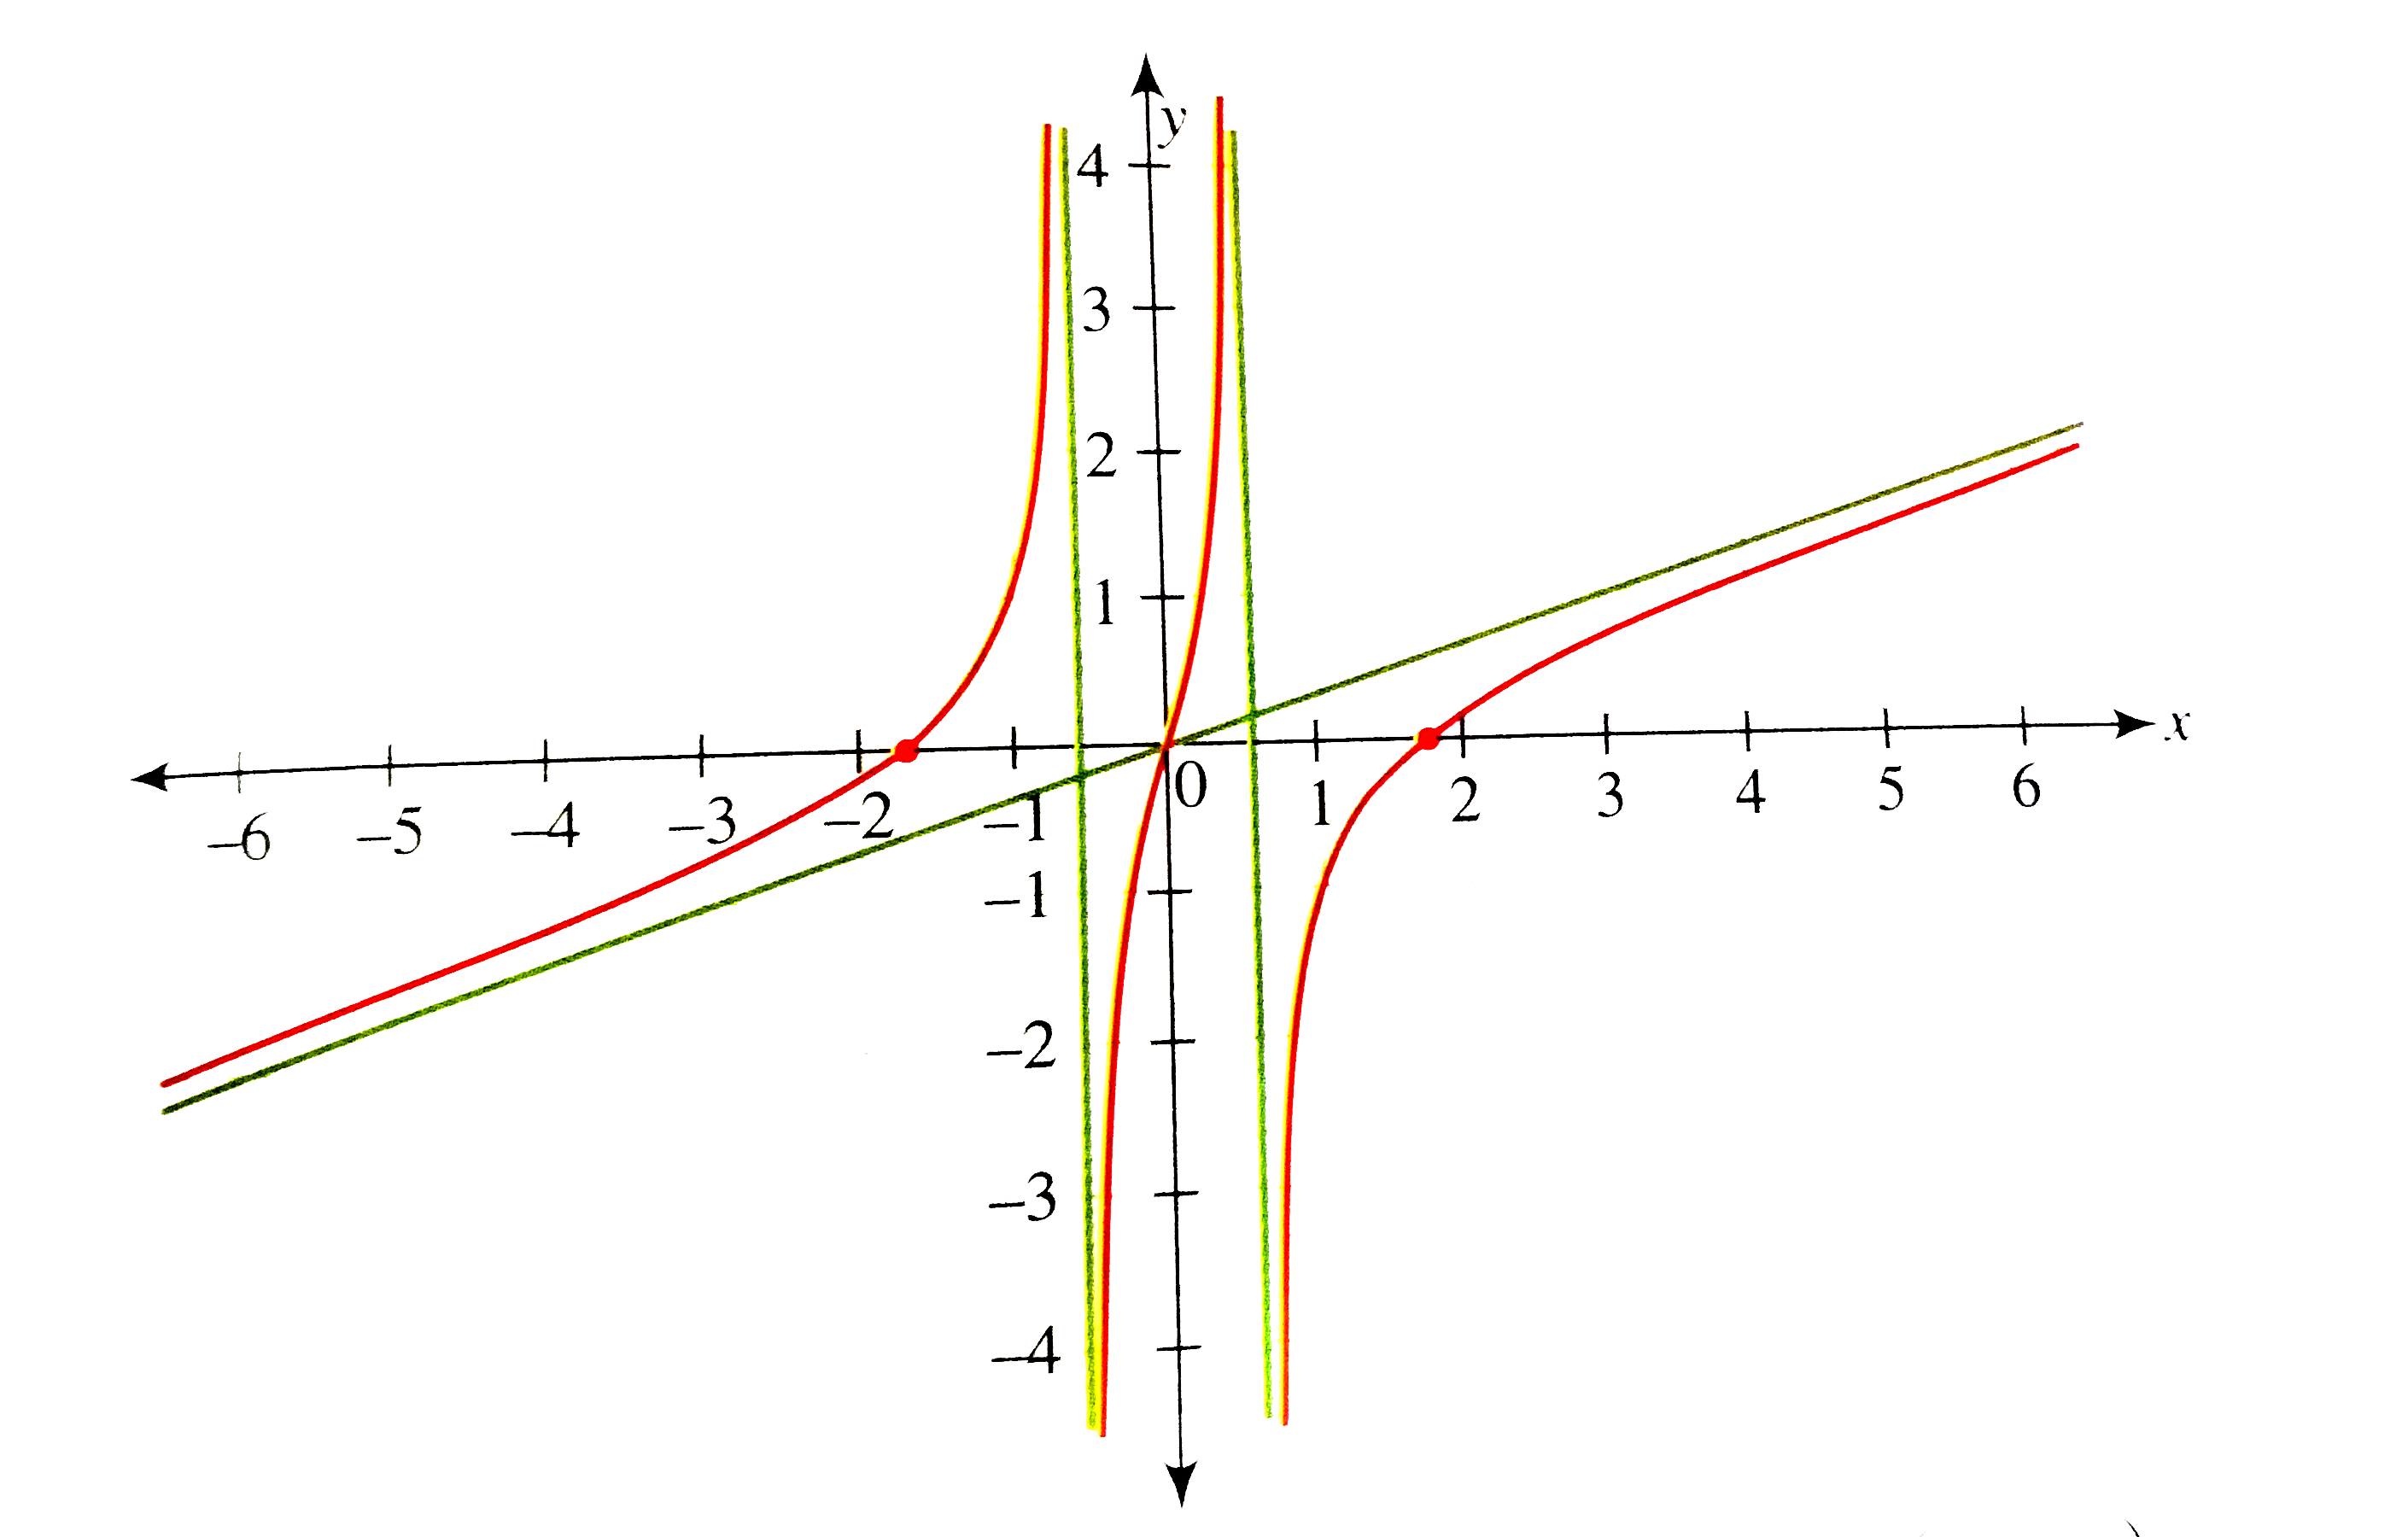
From the above discussion, the graph of can be drawn as follows.

Now in each of the intervals takes values .
So in each of the intervals, takes values .
So the graph of can be drawn as follows.

Here are asymptotes.
Topper's Solved these Questions
- BOOK - CENGAGE PUBLICATIONCHAPTER - GRAPHS OF POLYNOMIAL AND RATIONAL FUNCTIONSEXERCISE - Exercises17videos
GRAPHS OF POLYNOMIAL AND RATIONAL FUNCTIONS
- BOOK - CENGAGE PUBLICATIONCHAPTER - GRAPHICAL TRANSFORMATIONSEXERCISE - ILLUSTRATION78videos
GRAPHICAL TRANSFORMATIONS
- BOOK - CENGAGE PUBLICATIONCHAPTER - GRAPHS OF ELEMENTARY FUNCTIONS EXERCISE - EXERCISES34videos
GRAPHS OF ELEMENTARY FUNCTIONS
Similar Questions
Draw the graph of y=(x−1)(x2−x+1).
02:40View SolutionPlot y=|x|,y+x−2∣,andy=|x|2∣
05:29View SolutionDraw the graph of y=1(1/x).
03:49View Solutiony = tan ^ (- 1) [(3x-x ^ (3)) / (1-3x ^ (2))], - (1) / (sqrt (3))
02:11View SolutionDraw the labelled graph of the following: y=|x−1|−|3x−2|
02:09View SolutionDraw Graph y=|x-1|-|3x-2|
View Solutiondraw the graph of |y|=x^(3)-3x+2
View SolutionDraw the graph of y=tan(3x).
01:03View SolutionDraw the graph of y=3x−x31−3x2 and hence the graph of y=tan−1.3x−x31−3x2.
10:19View SolutionDraw the graph of y=tan−1(3x−x31−3x2).
07:02View SolutionFor drawing the graph of 3x−2y=−1, if y=2, what is the value of x?
02:32View SolutionSketch the graph for y=tan−1(3x−x31−3x2)
08:44View SolutionDraw the graph of y=tan−1(3x−x31−3x2).
02:44View SolutionDraw the graph of y=tan(3x).
02:53View SolutionDraw the labelled graph of the following: y=|x−1|−|3x−2|
11:36View SolutionDraw Graph y=|x−1|−|3x−2|
02:19View Solution
