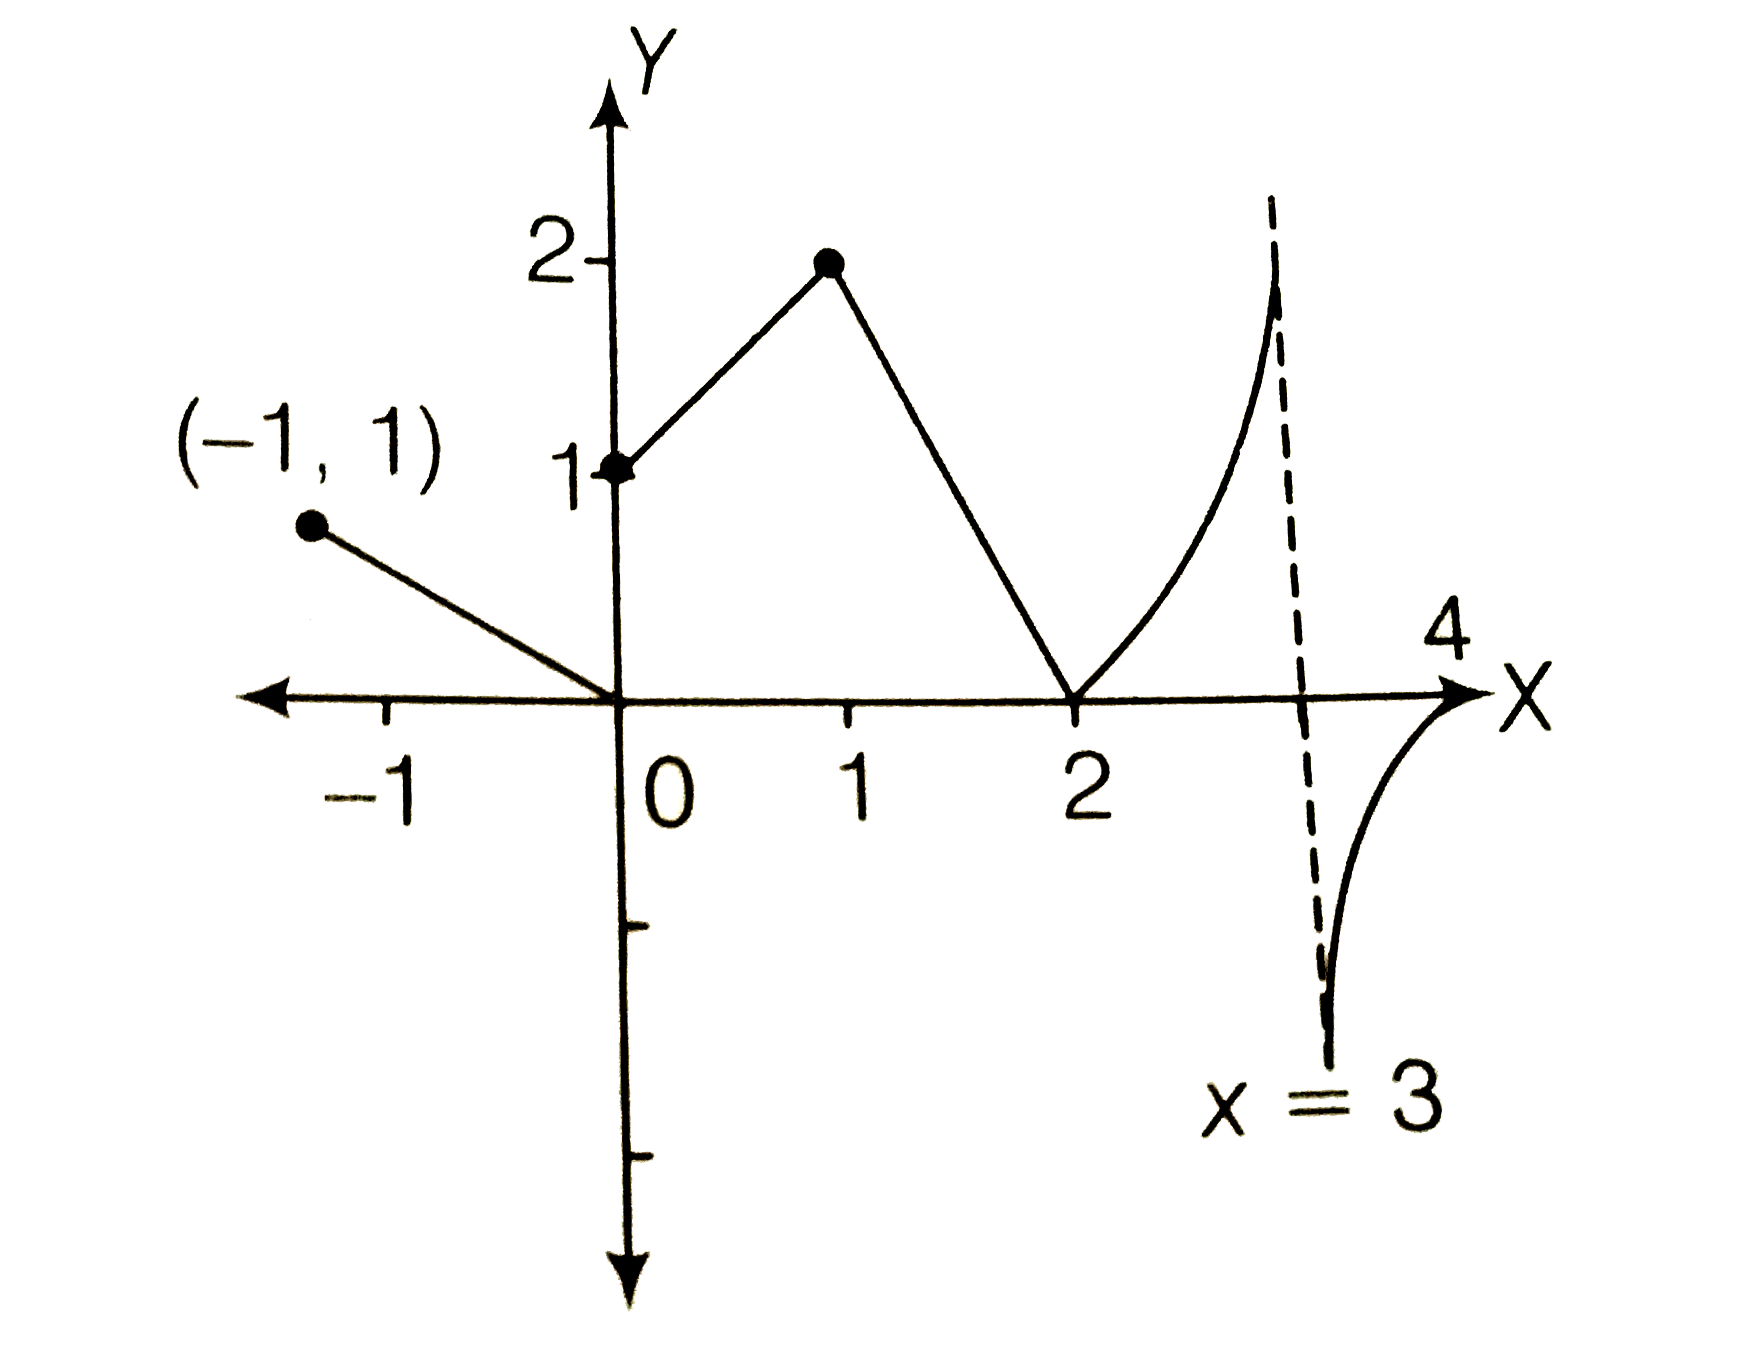
If graph of a function f(x) which is defined in [-1, 4] is shown in the following figure then identify the correct statement(s).
![If graph of a function f(x) which is defined in [-1, 4] is shown in the following figure then identify the correct statement(s).](https://d10lpgp6xz60nq.cloudfront.net/physics_images/CEN_CAL_C01_E17_027_Q01.png)
domain of f(|x|−1) is [−5,5]
range of f(|x|+1) is [0,2]
range of f(−|x|) is [−1,0]
domain of f[−3,3]
The correct Answer is:A, B, C
(a) −1≤|x|−1≤4⇒0≤|x|≤5⇒−5≤x≤5
(b) f(|x|+1)
range of f(|x|+1) is [0, 2]

range of f(−|x|) is [−1,0]

(d) −1≤|x|≤4⇒x∈[−4,4]
Topper's Solved these Questions
- FUNCTIONSBook:CENGAGE PUBLICATIONChapter:FUNCTIONSExercise:Comprehension Type
Explore 7 Videos
- FUNCTIONSBook:CENGAGE PUBLICATIONChapter:FUNCTIONSExercise:Comprehension Type
Explore 7 Videos
- EQUATION OF PLANE AND ITS APPLICATIONS -IIBook:CENGAGE PUBLICATIONChapter:EQUATION OF PLANE AND ITS APPLICATIONS -IIExercise:DPP 3.4
Explore 8 Videos
- GETTING STARTED WITH GRAPHSBook:CENGAGE PUBLICATIONChapter:GETTING STARTED WITH GRAPHSExercise:Exercises 1.18
Explore 1 Video
Similar Questions
The graph of a function fx) which is defined in [-1, 4] is shown in the adjacent figure. Identify the correct statement(s). (1) domain of f(|x|)−1)is[−5,5] (2) range of f(|x|+1) is [0,2] (3) range of f(−|x|) is [-1,0] (4) domain of f(|x|)is[−3,3]
View SolutionThe graph of a function fx) which is defined in [-1, 4] is shown in the adjacent figure. Identify the correct statement(s). (1) domain of f(|x|)−1)is[−5,5] (2) range of f(|x|+1) is [0,2] (3) range of f(−|x|) is [-1,0] (4) domain of f(|x|)is[−3,3]
View Solution
Knowledge Check
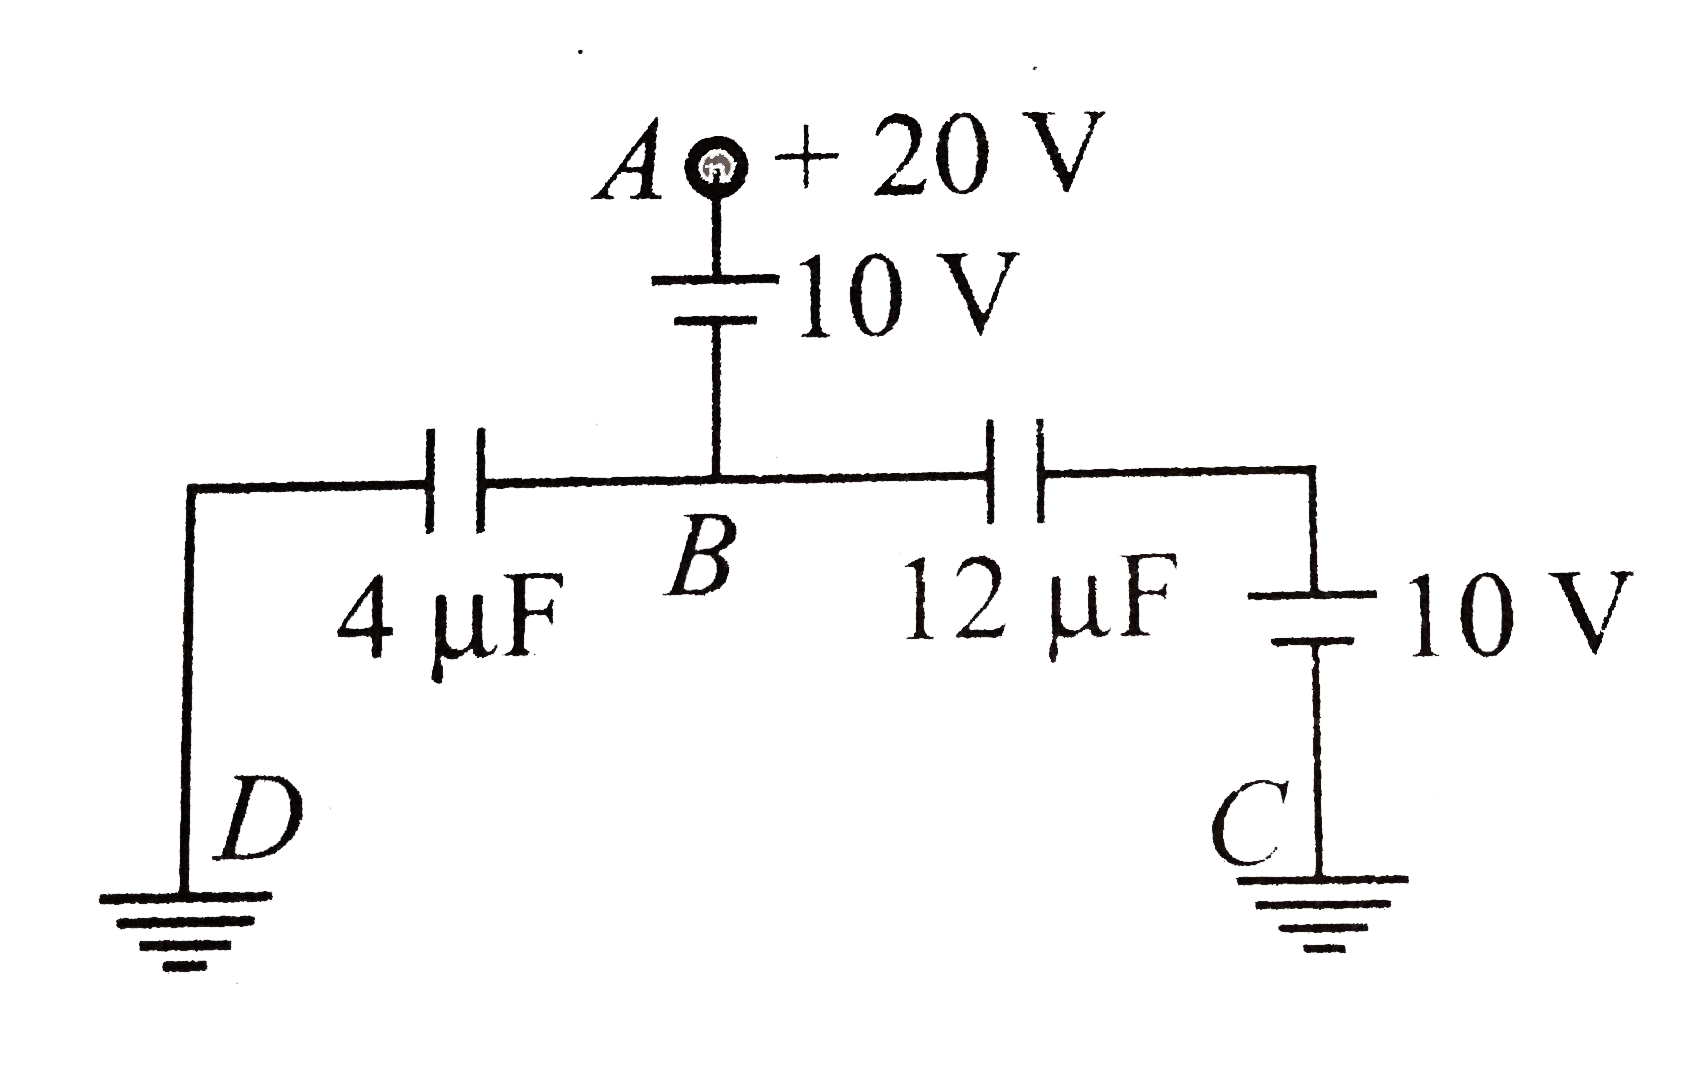
For the arrangement shown in figure identify the correct statement.
 AThe charge on the 12μF capacitor is zero.BThe charge on the 12μf capacitor is 30μC.CThe charge on the 4μF capacitor is 30μCDnone of these
A function f is defined by f(x)=2+(x−1)2/3 in [0,2]. Which of the following is not correct ?
Af is not derivable in (0, 2)Bf is continuous in [0,2]Cf(0)=f(2)DRolle's theorem is true in [0,2]A function f is defined by f(x)=xxsinx in [0,π]. Which of the following is not correct?
Af is continuous in [0,π]Bf is defferebtiable in (0,π)Cf(0)=f(π)DRolle's theorme is not applicable to f x on [0,π]
For the arrangement shown in figure identify the correct statement.

View SolutionThe graph of the function y=f(x) is shown in the adjacent figure then correct statement is

View SolutionThe graph of the function y=f(x) is shown in the adjacent figure then correct statement is

View SolutionGraph of y=f(x) is given as shown in the following figure. Draw the graph of y=sgn(f(x)).
View SolutionThe graph of y=f(x) is as shown in the following figure.

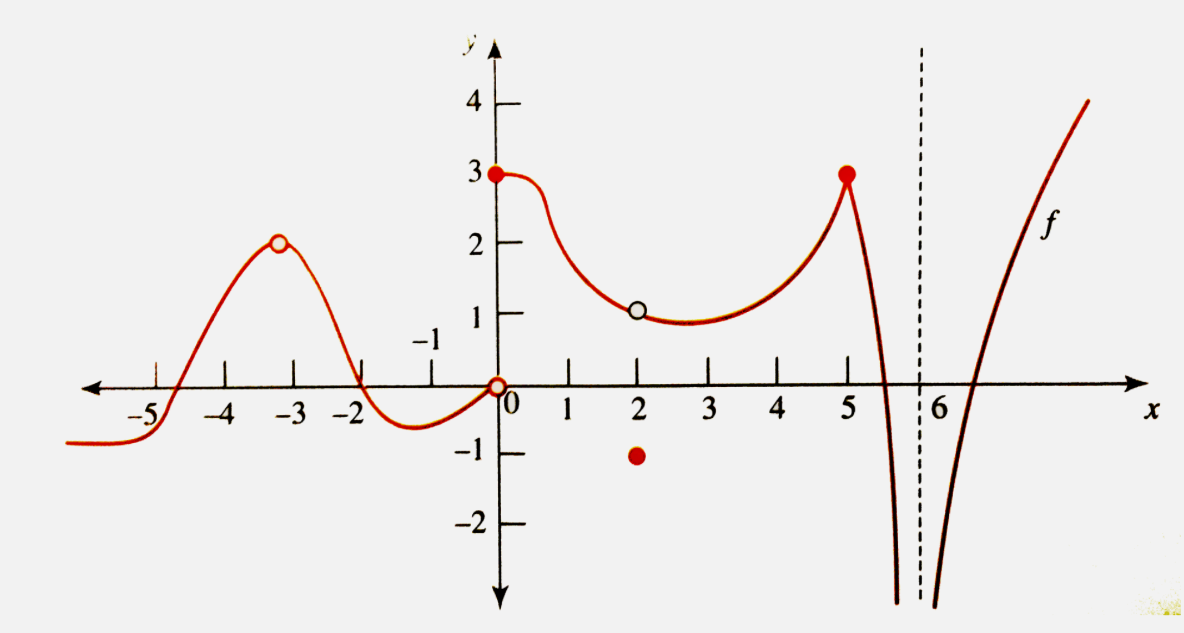
Identify the points of discontinuity and give the reason for the same.
View Solution
