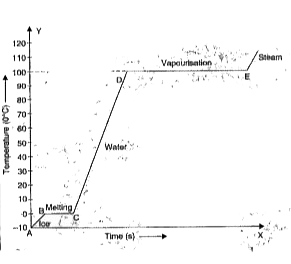
A certain quantity of ice at 0∘C is heated till it changes into steam at 100∘C. Draw a time-temperature heating curve to represent it. Label the two phase changes in your graph.
Similar Questions
Knowledge Check
A block of ice at −12∘C is slowly heated and converted into steam at 100∘C. Which of the following curves best represents the event ?
A B
B C
C D
D
A block of ice −10∘C is slowly heated and converted to steam at 100∘C. Which of the following curves represent the phenomenon qualitatively?
A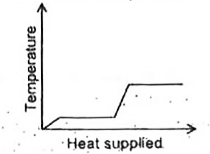 B
B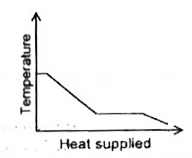 C
C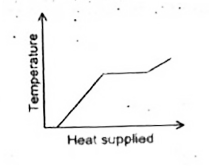 D
D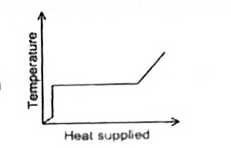
A block of ice at −10∘C is slowly heated and converted to steam at 100∘C. Which of the following curves represents the phenomenon qualitatively?
A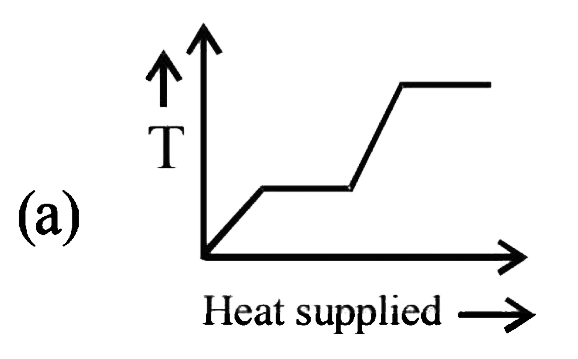 B
B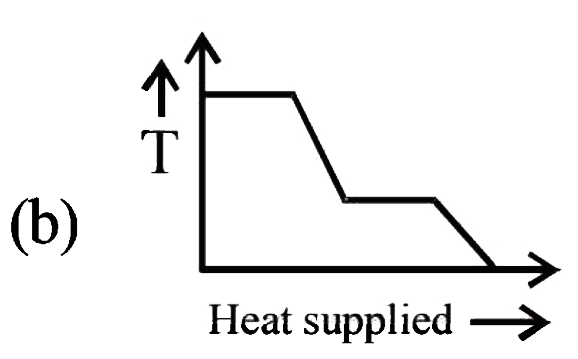 C
C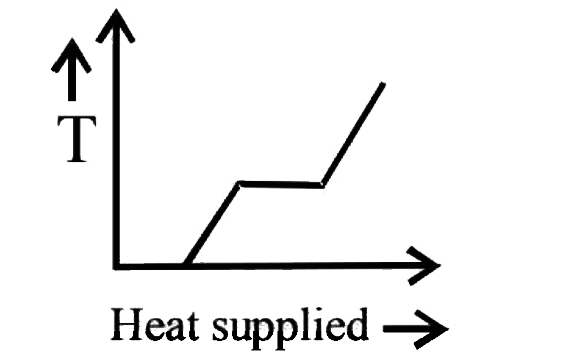 D\
D\
The ice at 0∘C is converted into steam at 100∘C . State the isothermal changes in the process.
View SolutionA certain mass of ice at 0∘C is converted to steam at 100∘C by constant heating, Draw temperature-time graph showing the change in phases.
View SolutionA certain mass of ice at 0∘C is converted to steam at 100∘C by constant heating, Draw temperature-time graph showing the change in phases.
View SolutionA piece of ice at 0∘C is heated at a constant rate and its temperature recorded at regular intervals till steam is formed at 100∘C. Draw a temperature-time graph to represent the change in phase. Label the different parts of your graph.
View SolutionA slab of ice at 0∘C is constantly heated till the steam is formed at 100∘C. Draw a graph showing the change in temperature with time. Label the various parts of the graph properly.
View Solution
