The following bar graph represents the number of cold drink bottles sold by a shopkeeper on six consecutive days.
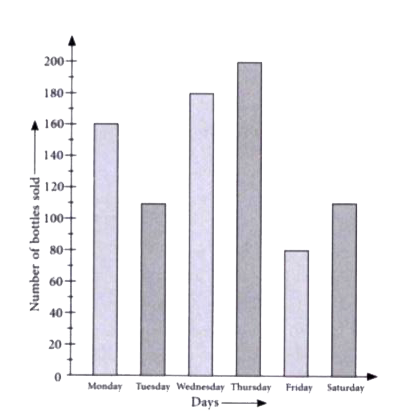
On which day minimum number of bottles were sold?
Step by step video & image solution for The following bar graph represents the number of cold drink bottles sold by a shopkeeper on six consecutive days. On which day minimum number of bottles were sold? by Maths experts to help you in doubts & scoring excellent marks in Class 6 exams.
Updated on:21/07/2023Topper's Solved these Questions
- PREP TEST BOOK - MTG IIT JEE FOUNDATIONCHAPTER - PREP TEST EXERCISE - SECTION-B
38 Videos
- PRACTICAL GEOMETRY BOOK - MTG IIT JEE FOUNDATIONCHAPTER - PRACTICAL GEOMETRY EXERCISE - EXERCISE (SUBJECTIVE PROBLEMS) (LONG ANSWER TYPE )
5 Videos
- PREP TEST -1BOOK - MTG IIT JEE FOUNDATIONCHAPTER - PREP TEST -1EXERCISE - SECTION-B
35 Videos
Similar Questions
The following bar graph represents the number of cold drink bottles sold by a shopkeeper on six consecutive days.
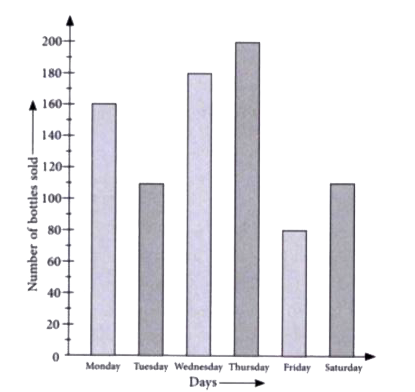
On which two days same number of bottles were sold?
View SolutionThe following bar graph represents the number of cold drink bottles sold by a shopkeeper on six consecutive days.
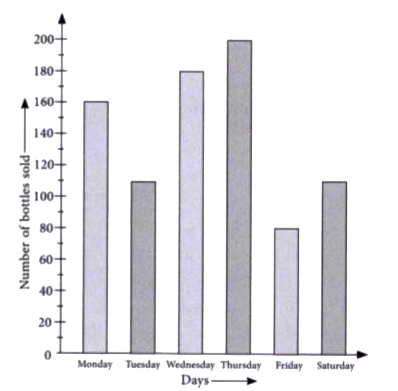
Find the total number of cold drink bottles sold in six days.
View Solution
Knowledge Check
The Bar graph given below presents the number of female employees working in two factories on six different days of a week.
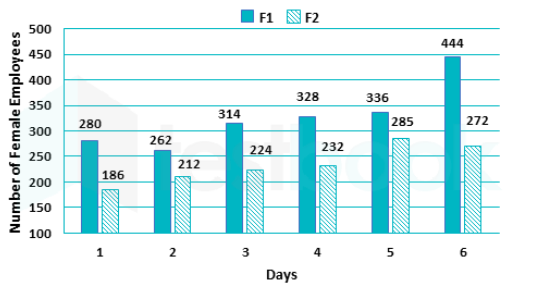
On which day the number of female workers in the factories Fl and F2, taken together, is the second highest?AA) D3BB) D6CC) D5DD) D4Study the following Pie chart showing the number of cold drinks of a shopkeeper sold in a year:
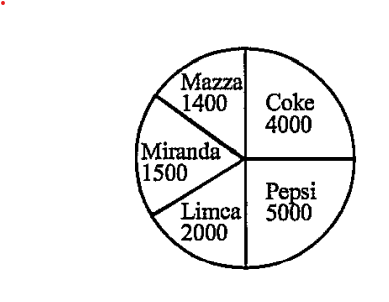
Which cold drink sale is twice as that of Limca?ACokeBMazzaCMirandaDPepsiThe Bar graph given below presents the number of books sold by a bookseller during different months of a year.
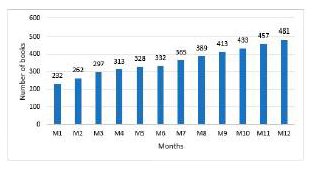
What is the total number of books sold by the bookseller in the year?A4032B4132C4302D4202
The number of bottles of cold drinks sold by a shopkeeper on six consecutive days is as follows:

Prepare a pictograph of the above data using an appropriate symbol
View SolutionDirection: Read the following Bar graph carefully and answer the following questions: The following bar graph shows the number of visitors to the Taj Mahal in the first week of January.
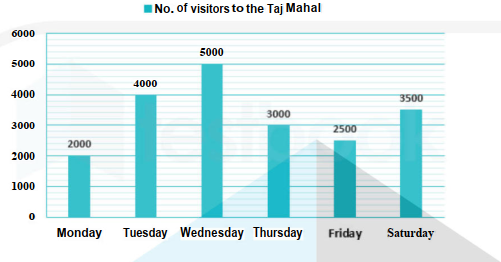
Find on which day the number of vistiros to the Taj Mahal is the highest?
View SolutionRead the bar graph which shows the number of books sold by a bookstore during five consecutive years and answer the following questions
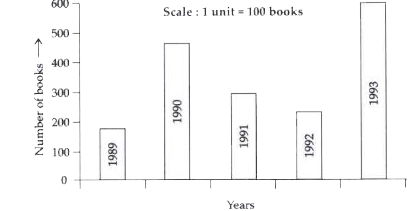
In which year lowest books were sold ?
View SolutionThe given bar graph represents the sale of cars in five different states in a month.
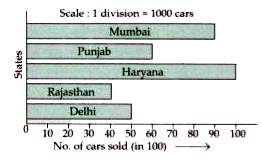
Which state sold 5000 cars ?
View SolutionThe following table presents the number of units of a product produced and sold by a company during six years.
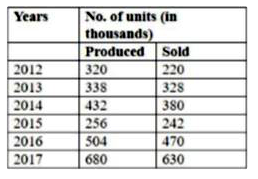
What is the ratio of the total number of units of the product sold in 2013 and 2015 to that prodcued in 2015 and 2016 ?
View Solution
