Which position versus time graph represents a stationary body?
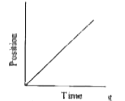


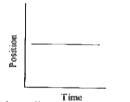
Step by step video & image solution for Which position versus time graph represents a stationary body? by Physics experts to help you in doubts & scoring excellent marks in Class 7 exams.
Updated on:21/07/2023Topper's Solved these Questions
- MOTIONBOOK - BEIITIANSCHAPTER - MOTIONEXERCISE - CONCEPTIVE WORKSHEET
20 Videos
- MOTIONBOOK - BEIITIANSCHAPTER - MOTIONEXERCISE - SUMMATIVE WORKSHEET
2 Videos
- MEASUREMENTBOOK - BEIITIANSCHAPTER - MEASUREMENTEXERCISE - IIT JEE WORKSHEET (IV INTEGER TYPE)
1 Videos
- SOUNDBOOK - BEIITIANSCHAPTER - SOUNDEXERCISE - IIT JEE Worksheet (V. Matrix Matching)
5 Videos
Similar Questions
Knowledge Check
The accompanying graph of position x versus time t represents the motion of a particle. If p and q are both positive constants, the expression that best describes the acceleration α of the particle is
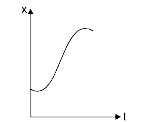 Aa = p qtBa = p + qtCa = p + qtDa = p qt
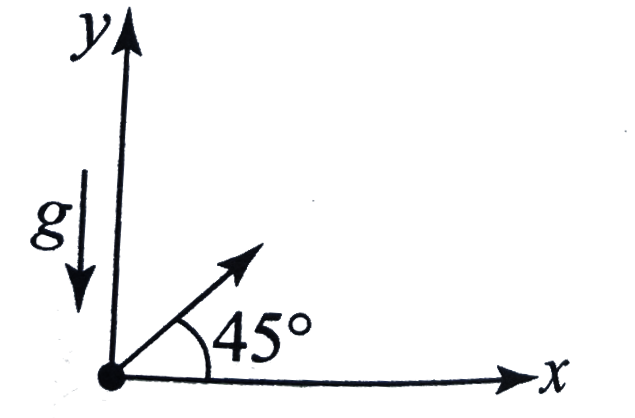
A stone is projected at an angle 45∘ with horizontal above horizontal x-axis as shown in figure (and y-axis is vertical). Four graphs representing the magnitude of horizontal (vx) or magnitude of vertical (vy) component of velocity of stone w.r.t. time t as shown. Then which of the following magnitude of velocity versus time graph best represents vx versus t and vy versus t respectively for the stone.A B
B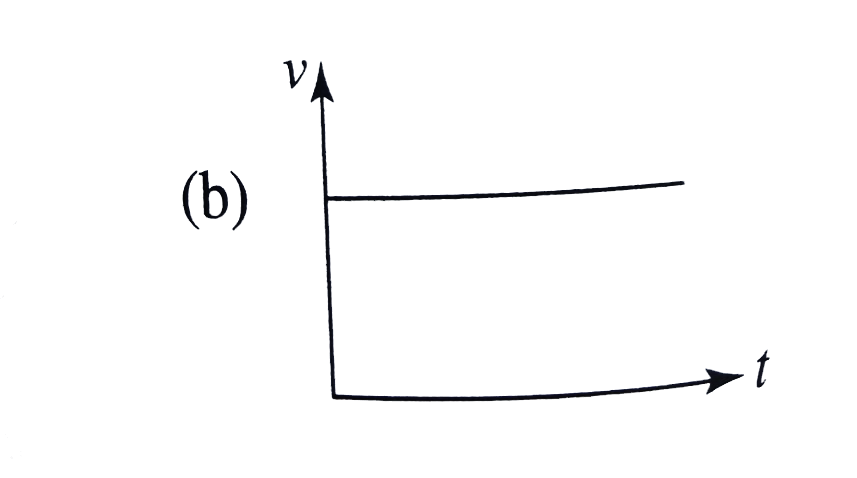 C
C D
D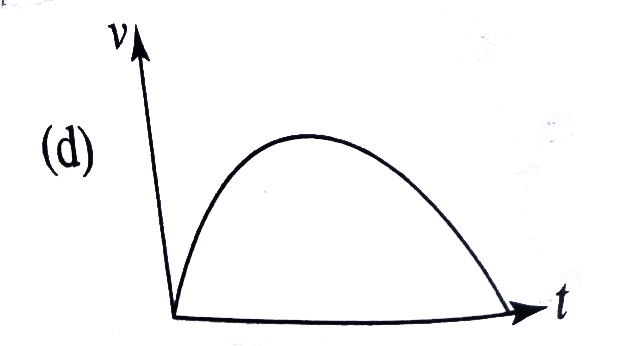
Which graph represents positive acceleration ?
A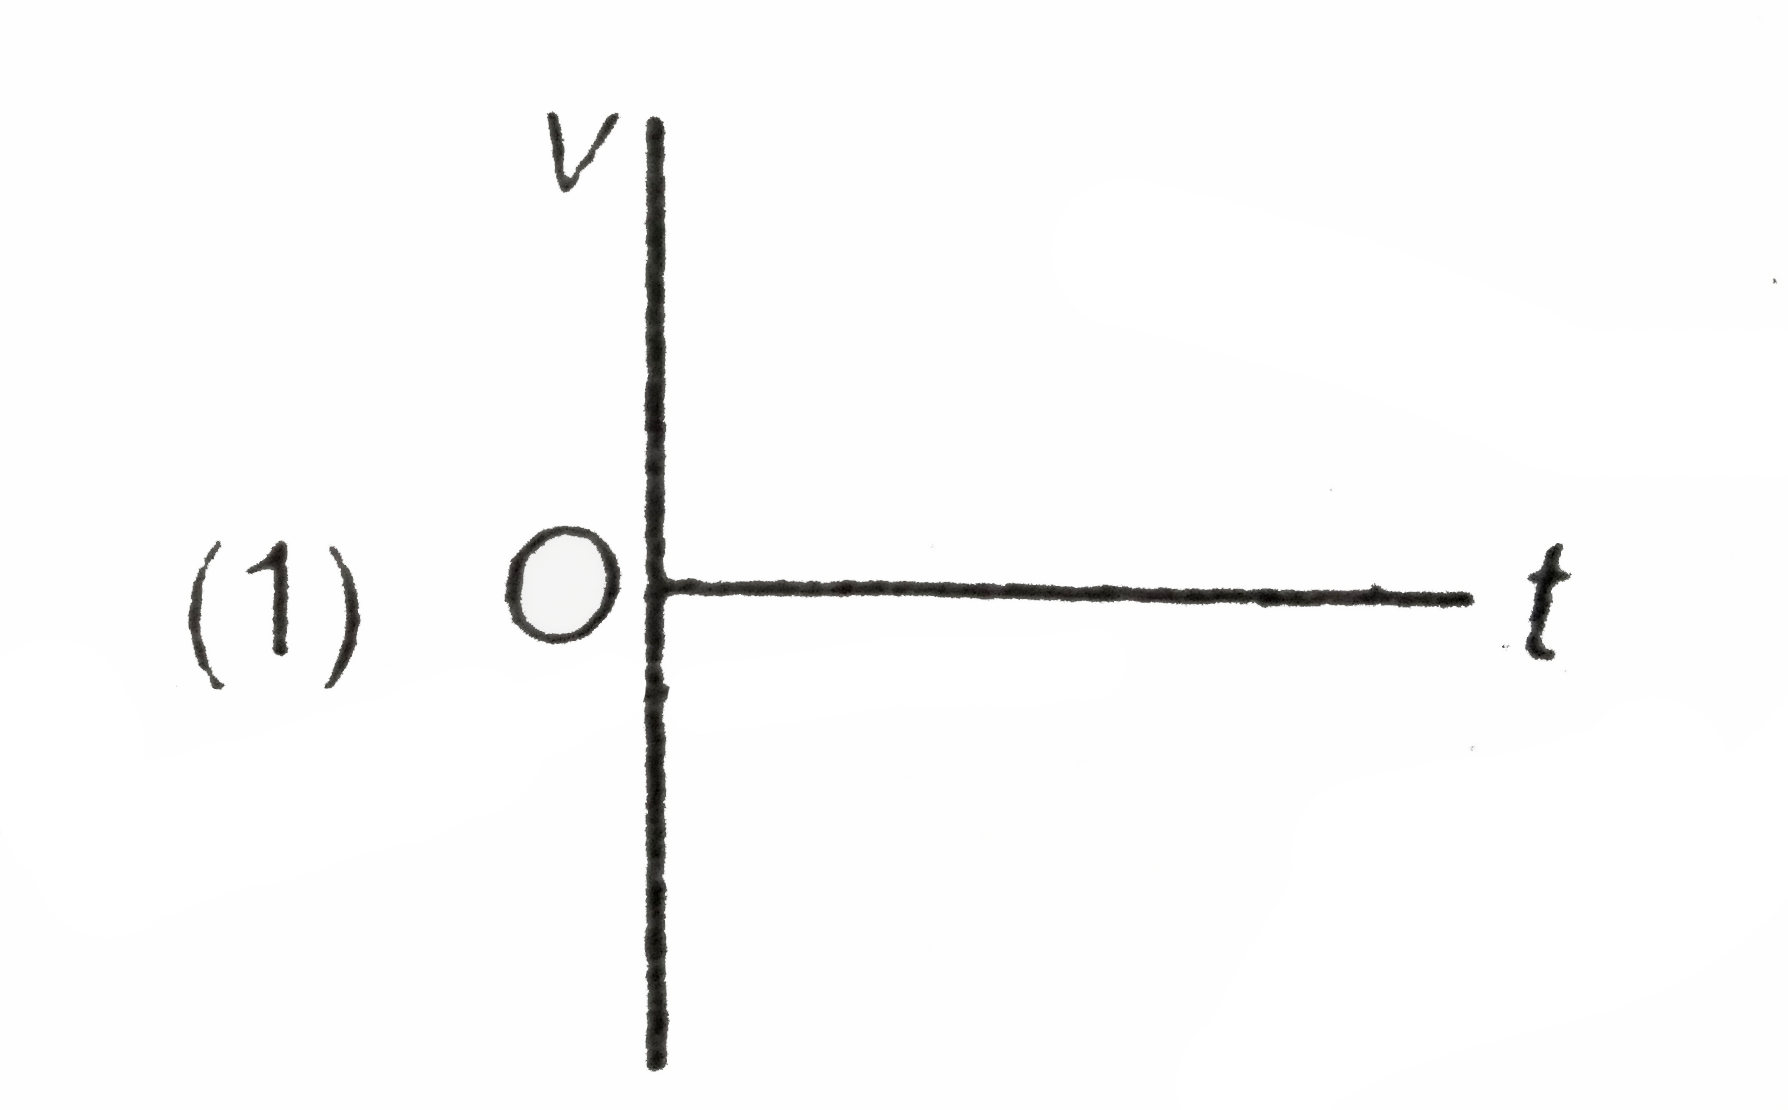 B
B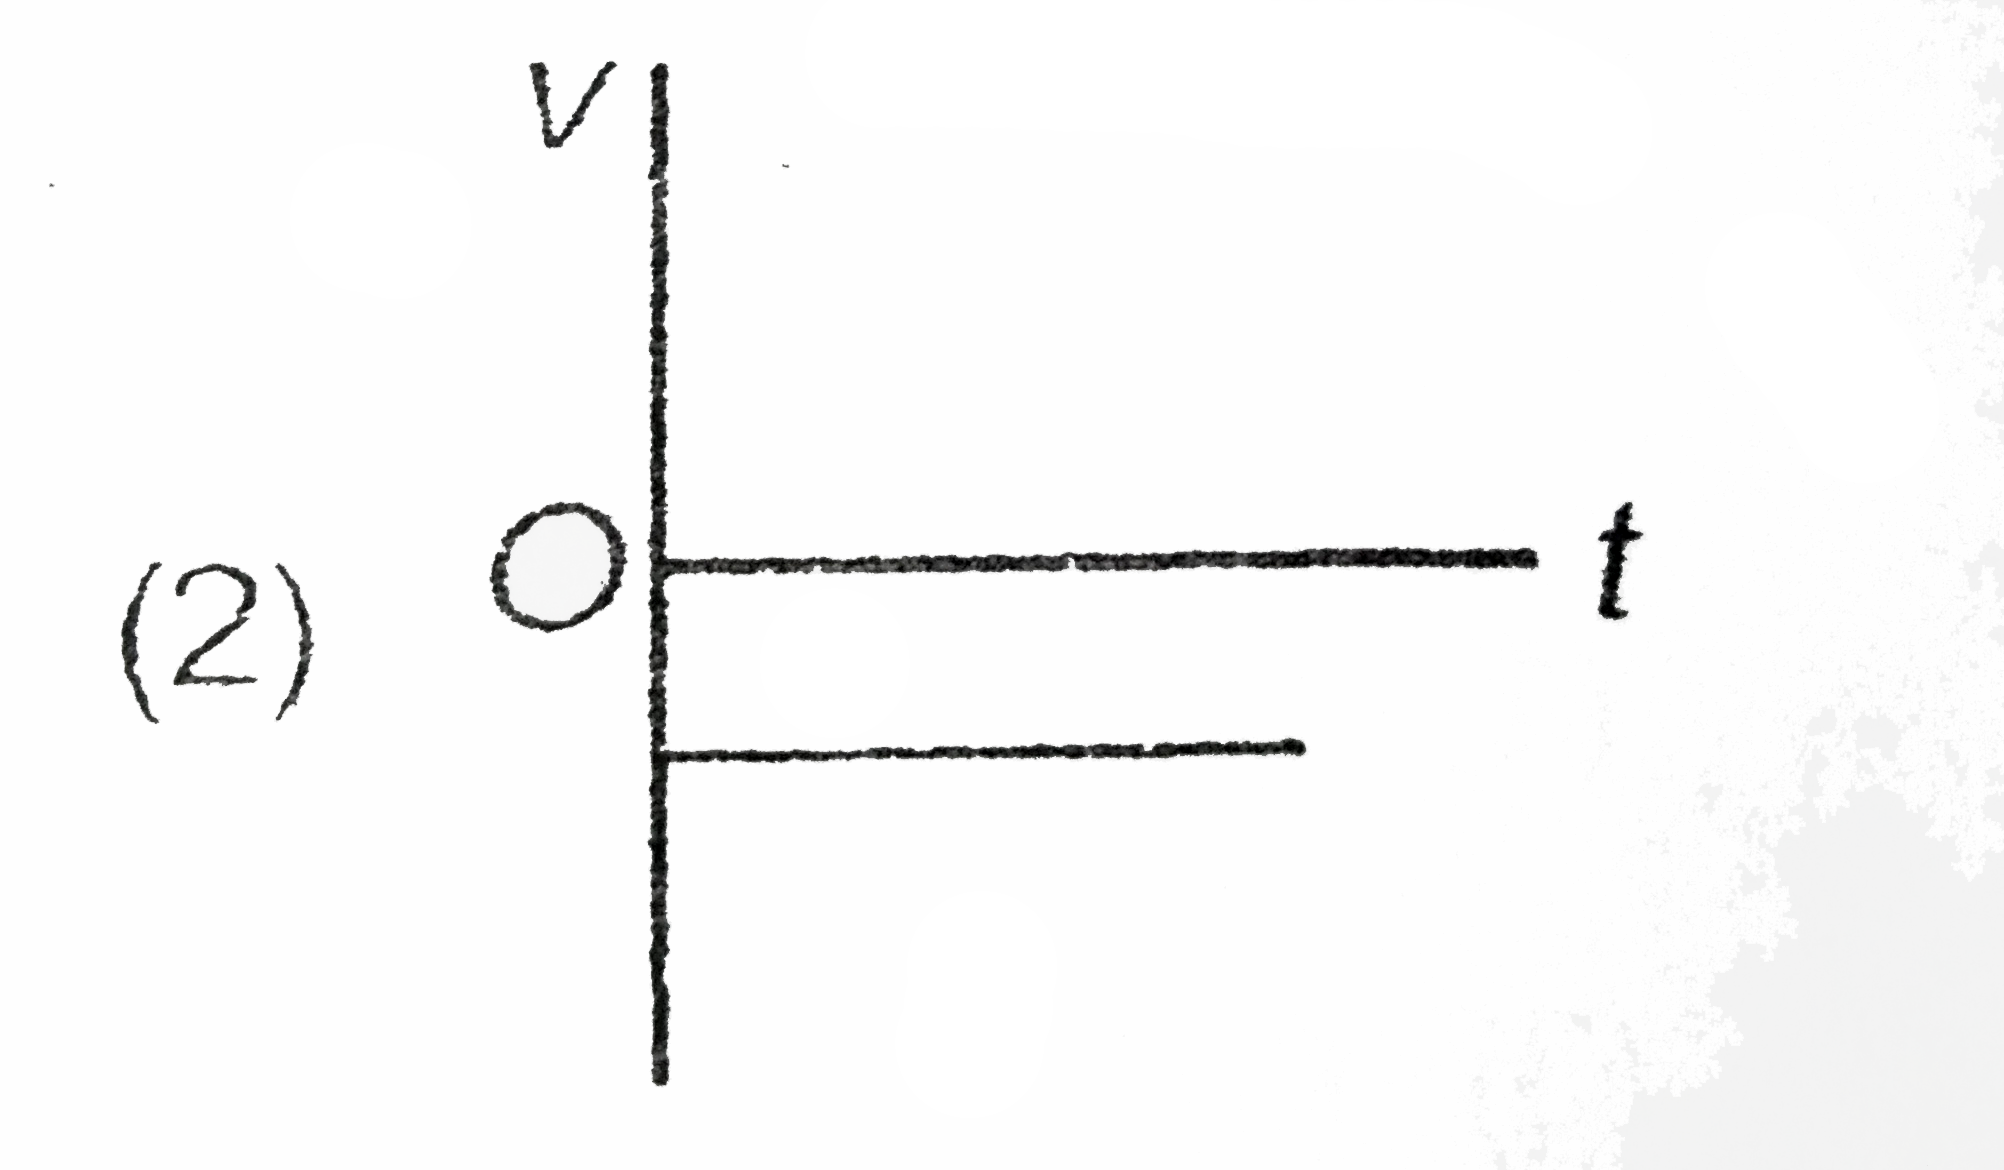 C
C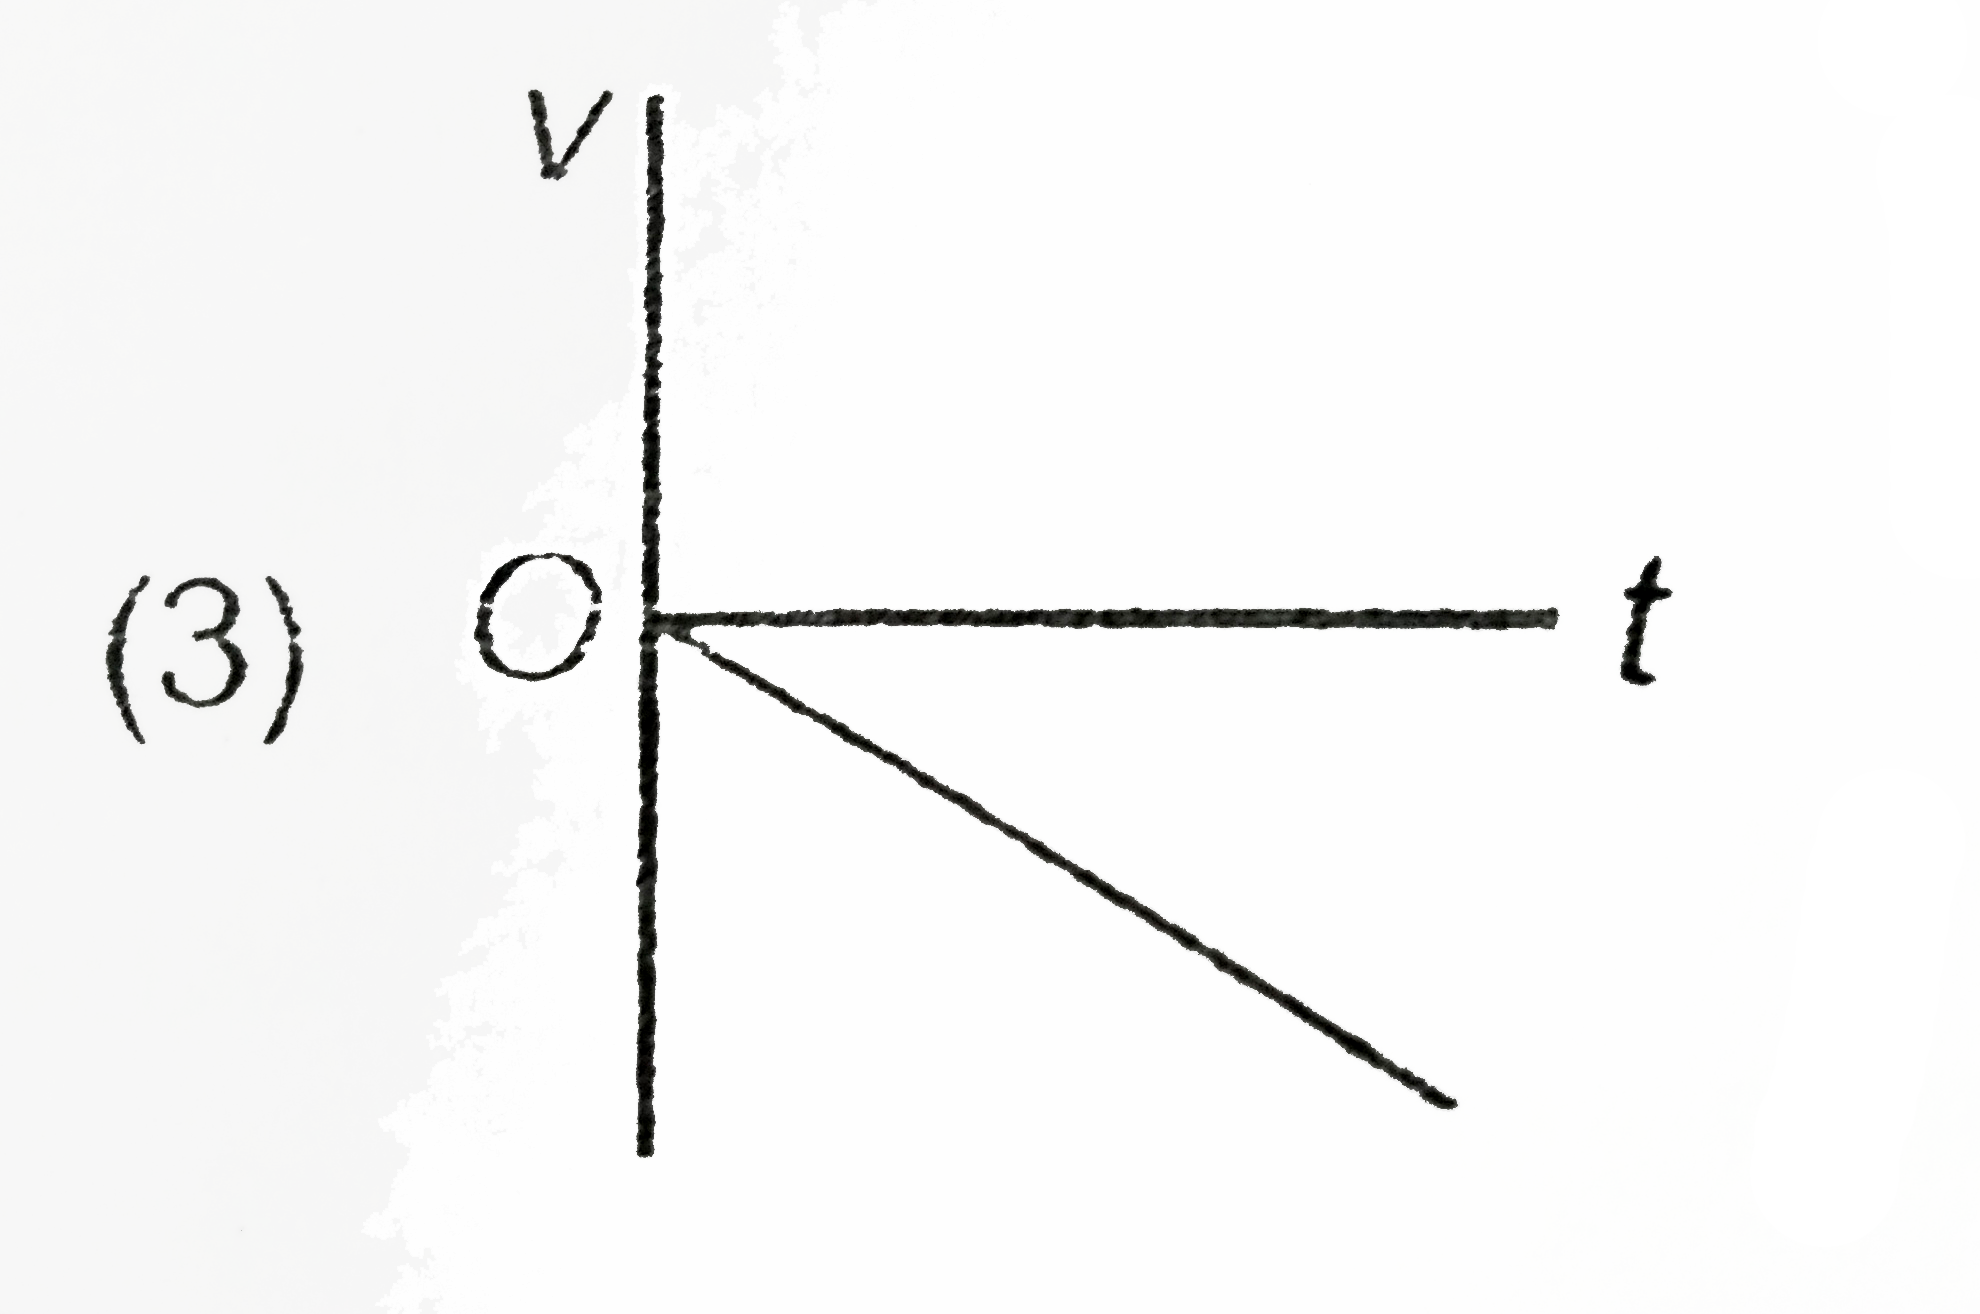 D
D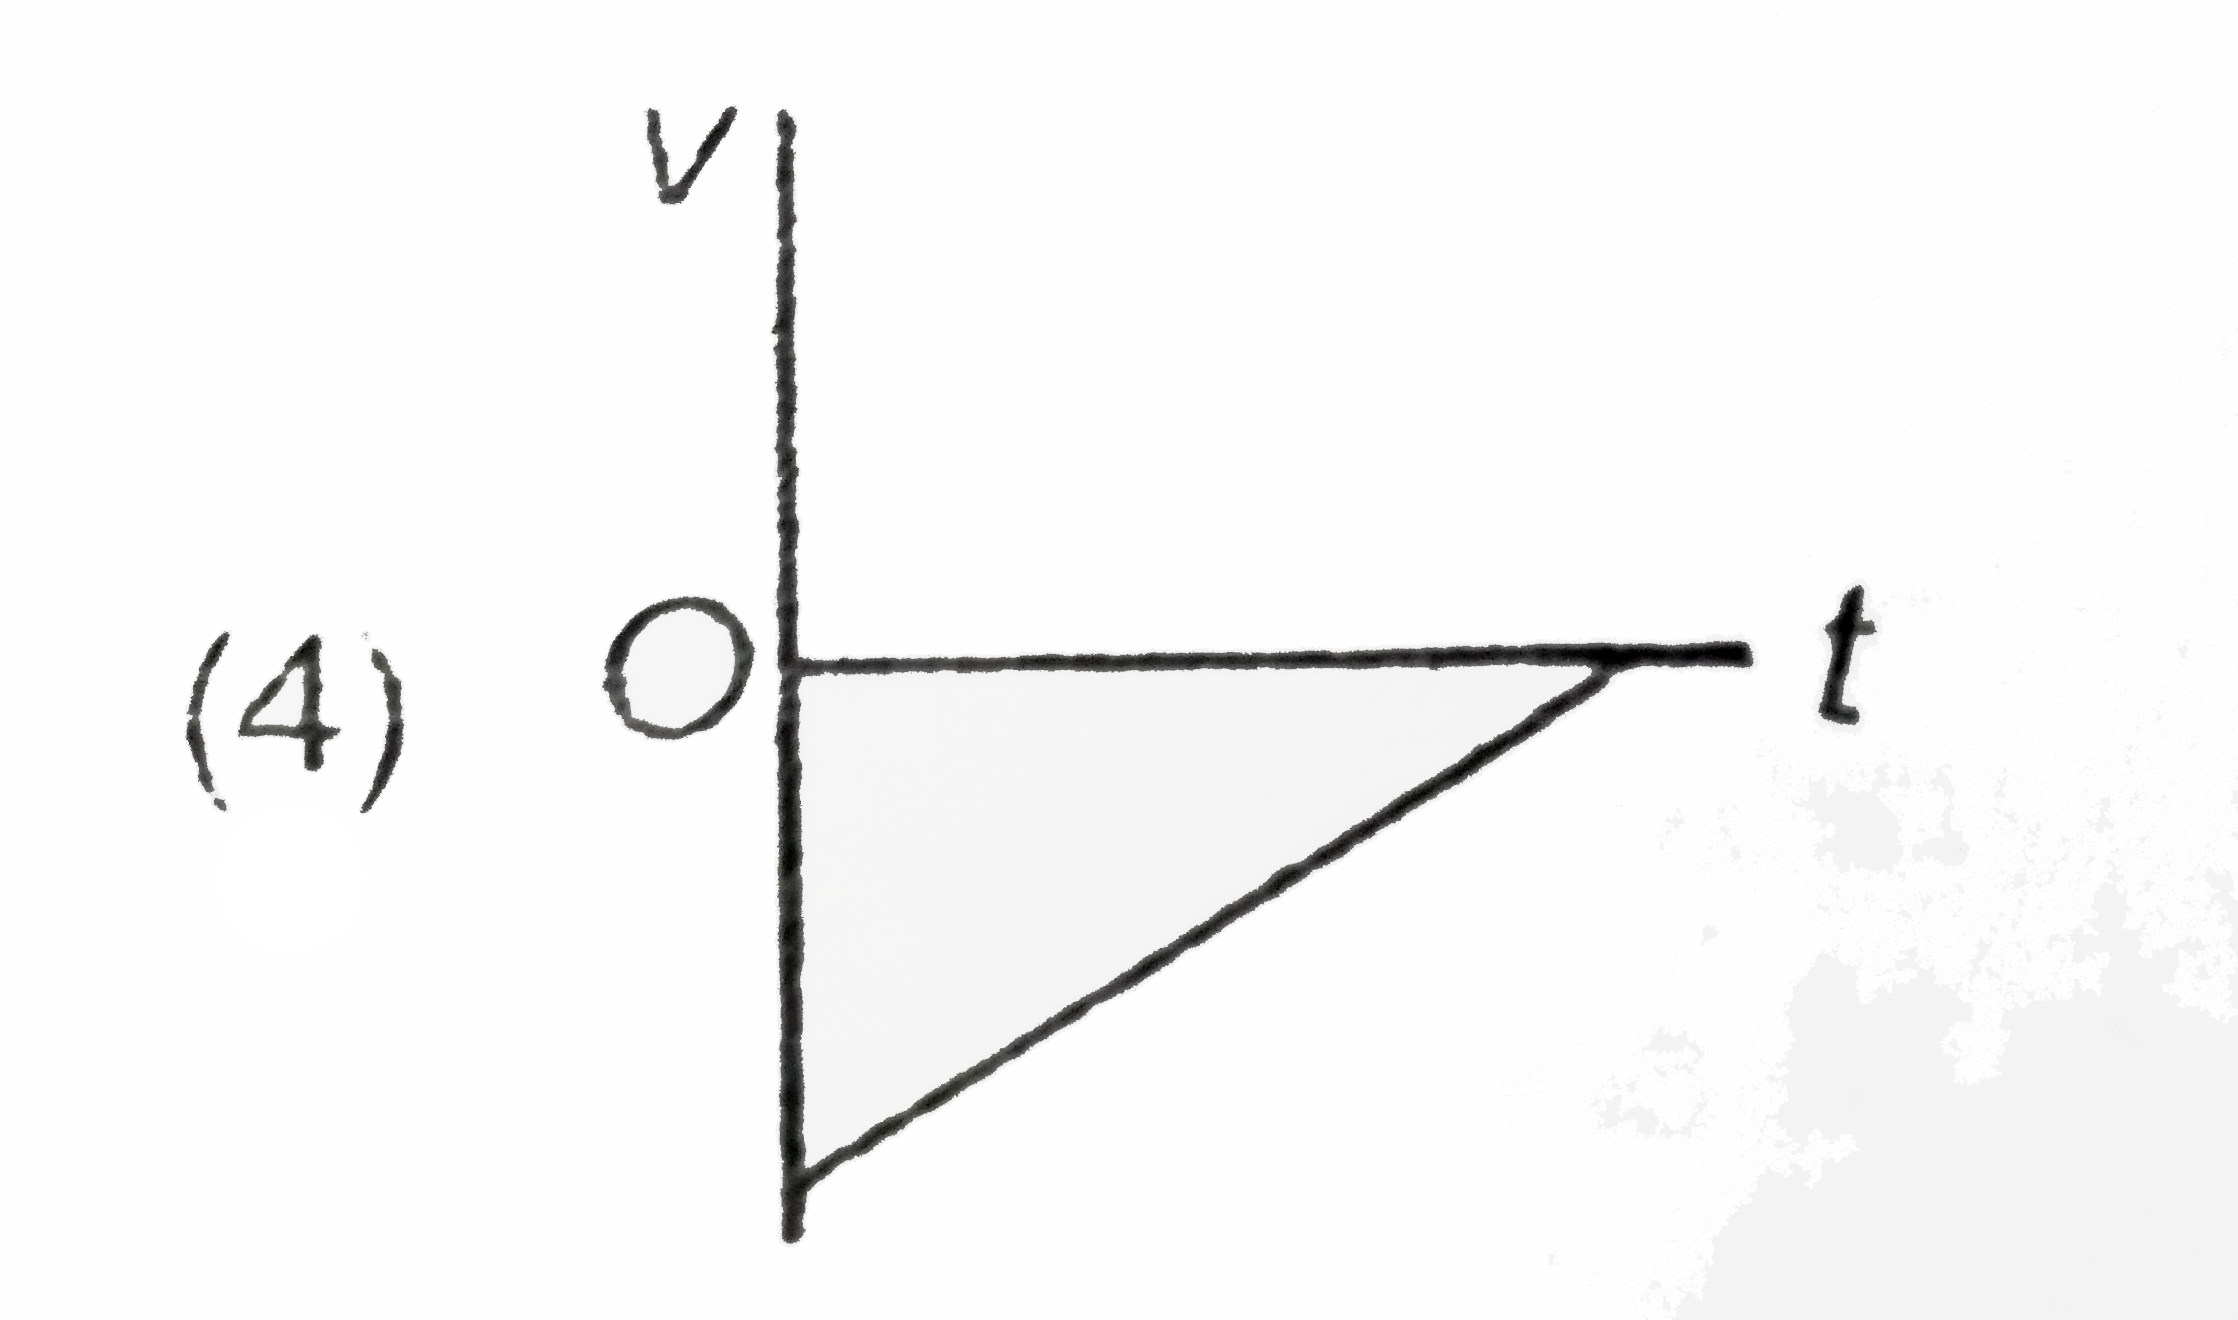
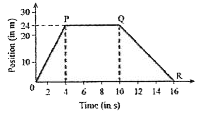
The position versus time graph of the motion of a boy along a straight path is shown in the given figure. The total time for which the boy remains in motion is
View SolutionThe following figure represents the velocity-time graph of a moving car on a road:
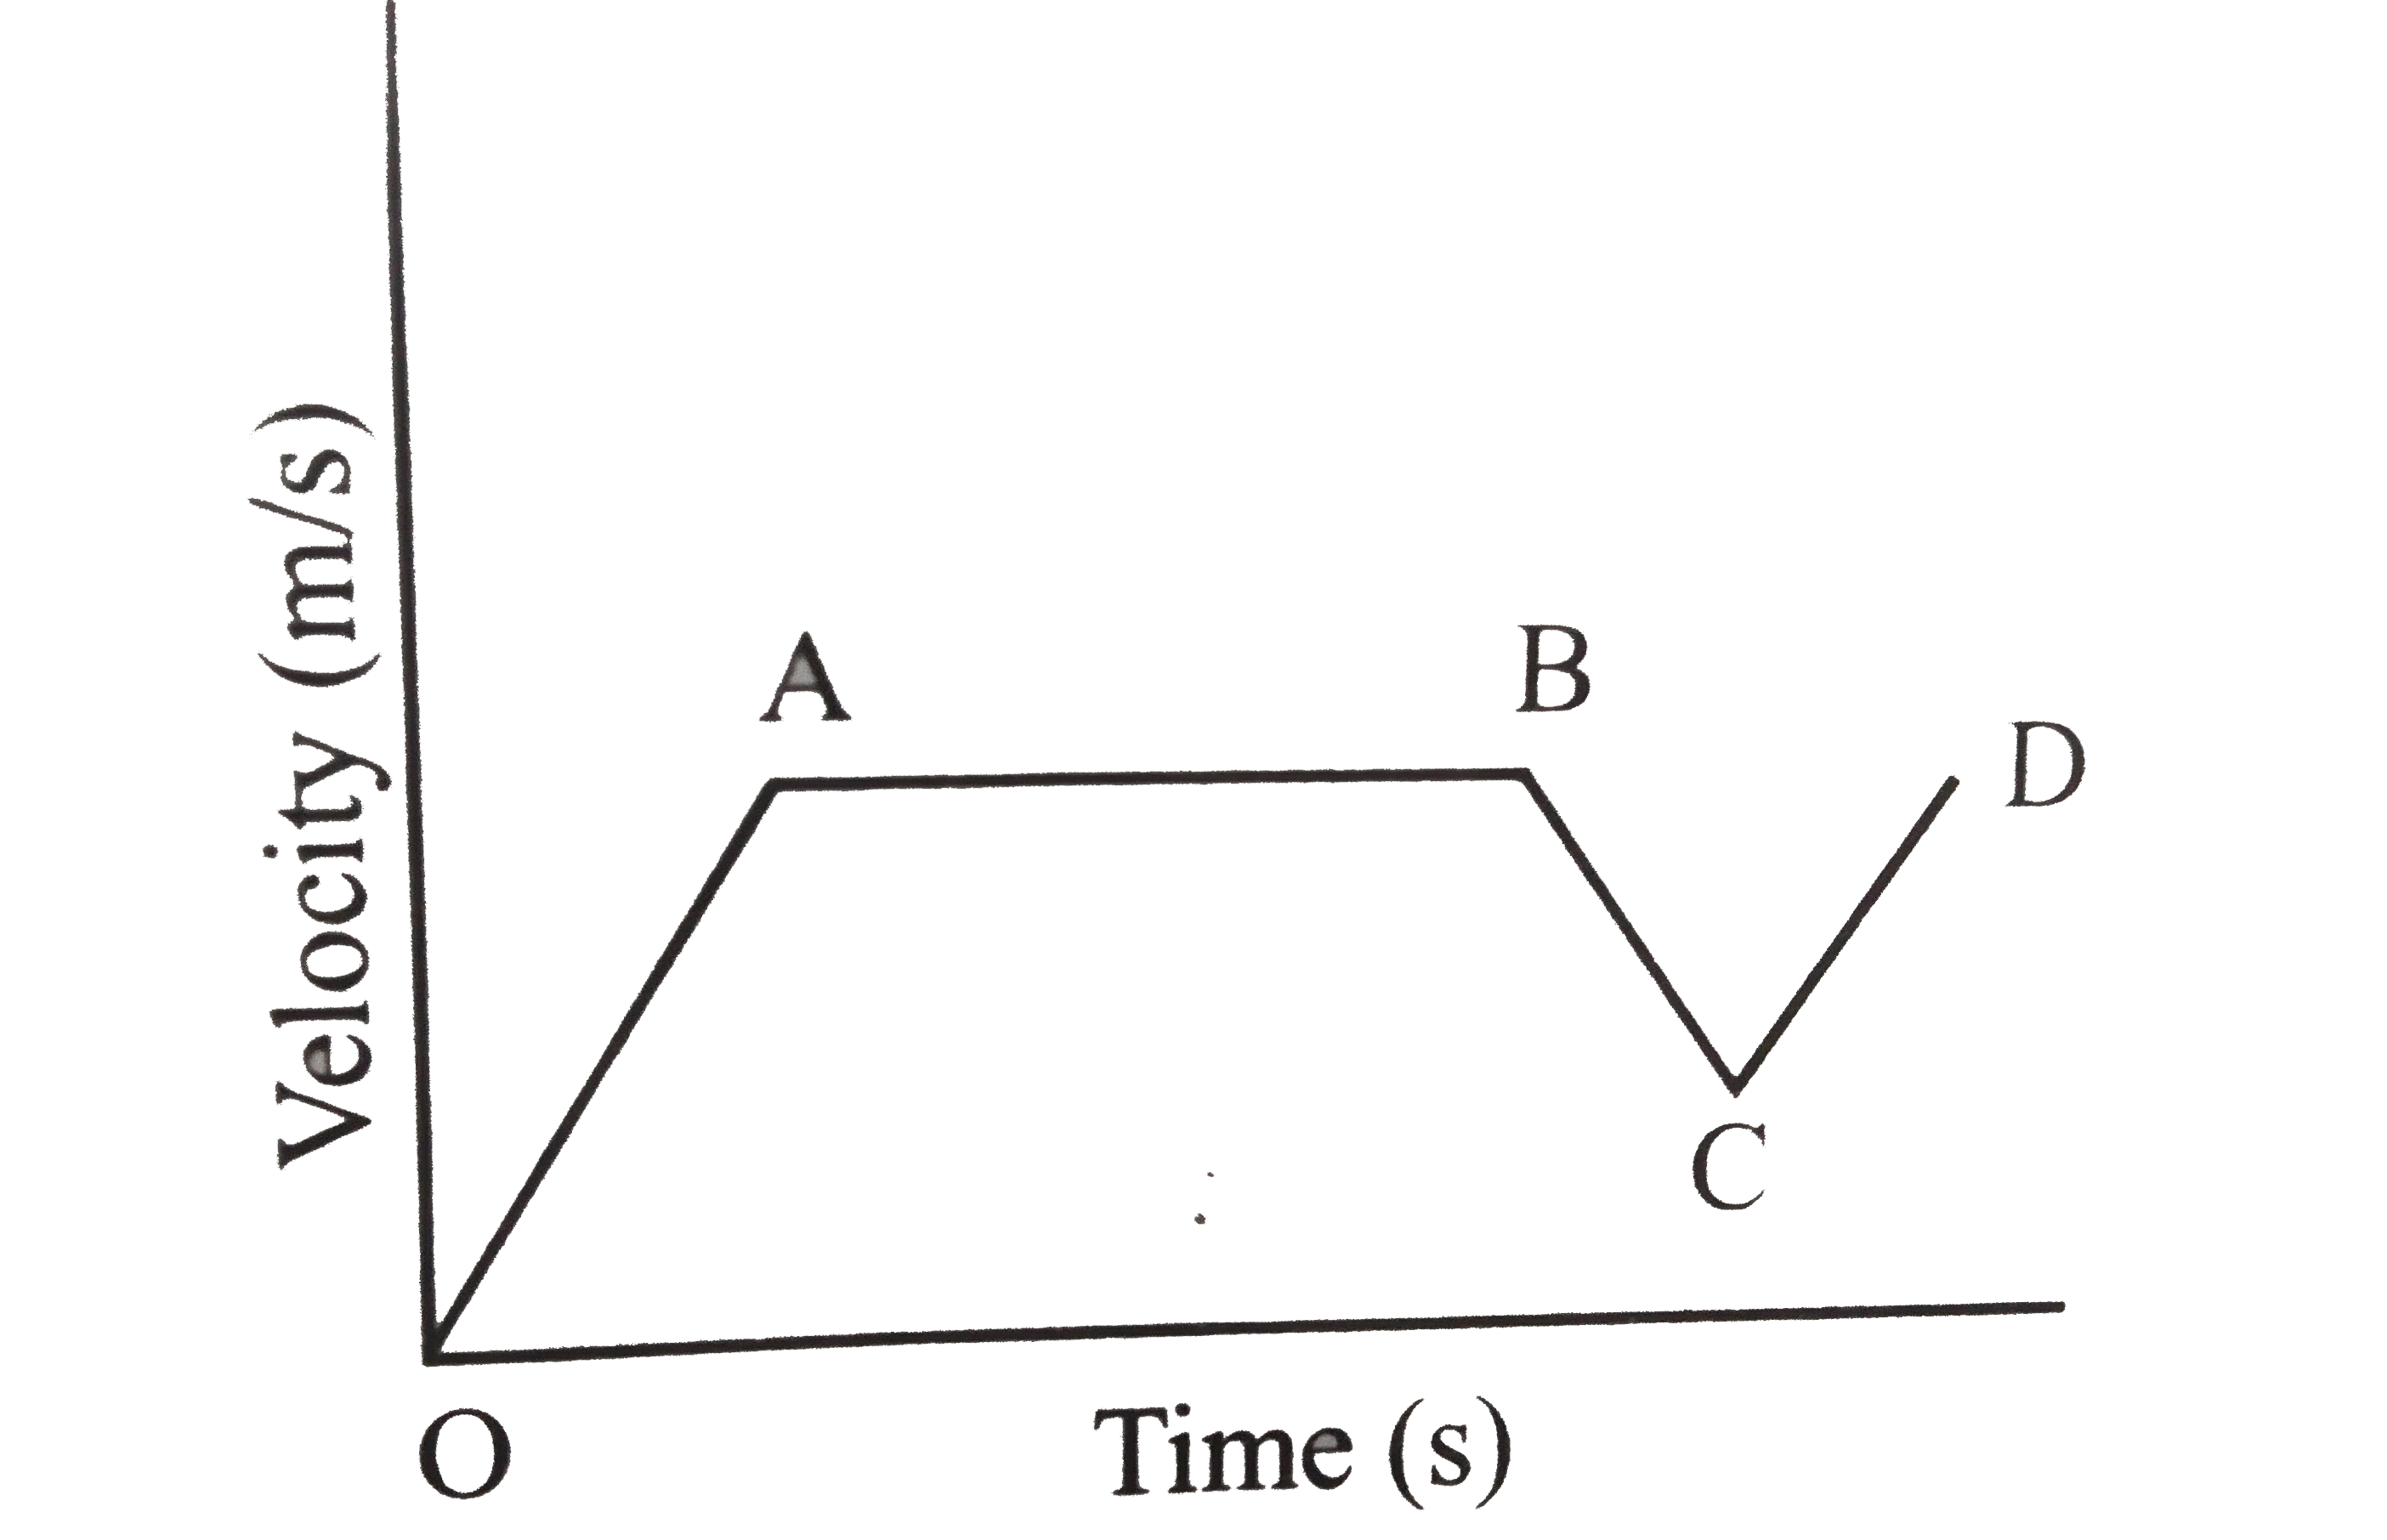
Which segment of the graph represents the retardation?
View SolutionPosition (x) versus time (t) graph of a particle is as shown. The velocity is zero at?
View SolutionSTATEMENT - 1 : The slope on a position-time graph is representative of the acceleration of the object.
STATEMENT - 2 : A straight, diagonal line on a position-time graph is representative of an onject with a constant velocity.
STATEMENT - 3 : I an object is at rest, then the position-time graph must be a horizontal line located on the time-axis.
View SolutionA body is thrown vertically upwards which graph represents variation of velocity w.r.t time
View Solution
