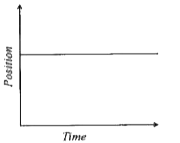
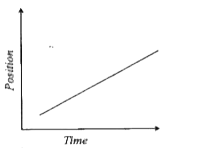
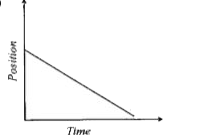
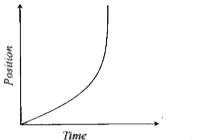
Which of the following position versus time graphs represents a a body at rest?
To determine which position versus time graph represents a body at rest, we need to analyze the characteristics of the graphs provided. Here’s a step-by-step solution:
Step 1: Understand the Relationship Between Position and Velocity
The position versus time graph shows how the position of an object changes over time. The slope of this graph represents the velocity of the object.
Step 2: Identify the Condition for a Body at Rest
A body is considered to be at rest if its velocity is zero. This means that the slope of the position versus time graph must be zero.
Step 3: Analyze the Slope of Each Graph
- Graph 1: If this graph is a horizontal line, the slope is zero, indicating that the object is at rest.
- Graph 2: If this graph shows a straight line with a positive slope, the object is moving away from the starting point, indicating it is not at rest.
- Graph 3: If this graph shows a straight line with a negative slope, the object is moving towards the starting point, indicating it is also not at rest.
- Graph 4: If this graph is a curve with a changing slope, the velocity is not constant, indicating the object is not at rest.
Step 4: Conclusion
Based on the analysis, the only graph that shows a slope of zero is Graph 1. Therefore, the position versus time graph that represents a body at rest is Graph 1.
Final Answer
Graph 1 represents a body at rest.
---
The position versus time graph shows how the position of an object changes over time. The slope of this graph represents the velocity of the object.
A body is considered to be at rest if its velocity is zero. This means that the slope of the position versus time graph must be zero.
- Graph 1: If this graph is a horizontal line, the slope is zero, indicating that the object is at rest.
- Graph 2: If this graph shows a straight line with a positive slope, the object is moving away from the starting point, indicating it is not at rest.
- Graph 3: If this graph shows a straight line with a negative slope, the object is moving towards the starting point, indicating it is also not at rest.
- Graph 4: If this graph is a curve with a changing slope, the velocity is not constant, indicating the object is not at rest.
Based on the analysis, the only graph that shows a slope of zero is Graph 1. Therefore, the position versus time graph that represents a body at rest is Graph 1.
Graph 1 represents a body at rest.
Topper's Solved these Questions
- MOTIONBOOK - BEIITIANSCHAPTER - MOTIONEXERCISE - CONCEPTIVE WORKSHEET
20 Videos
- MOTIONBOOK - BEIITIANSCHAPTER - MOTIONEXERCISE - SUMMATIVE WORKSHEET
2 Videos
- MEASUREMENTBOOK - BEIITIANSCHAPTER - MEASUREMENTEXERCISE - IIT JEE WORKSHEET (IV INTEGER TYPE)
1 Videos
- SOUNDBOOK - BEIITIANSCHAPTER - SOUNDEXERCISE - IIT JEE Worksheet (V. Matrix Matching)
5 Videos
Similar Questions
Knowledge Check
Which graph represents an objects at rest ?
A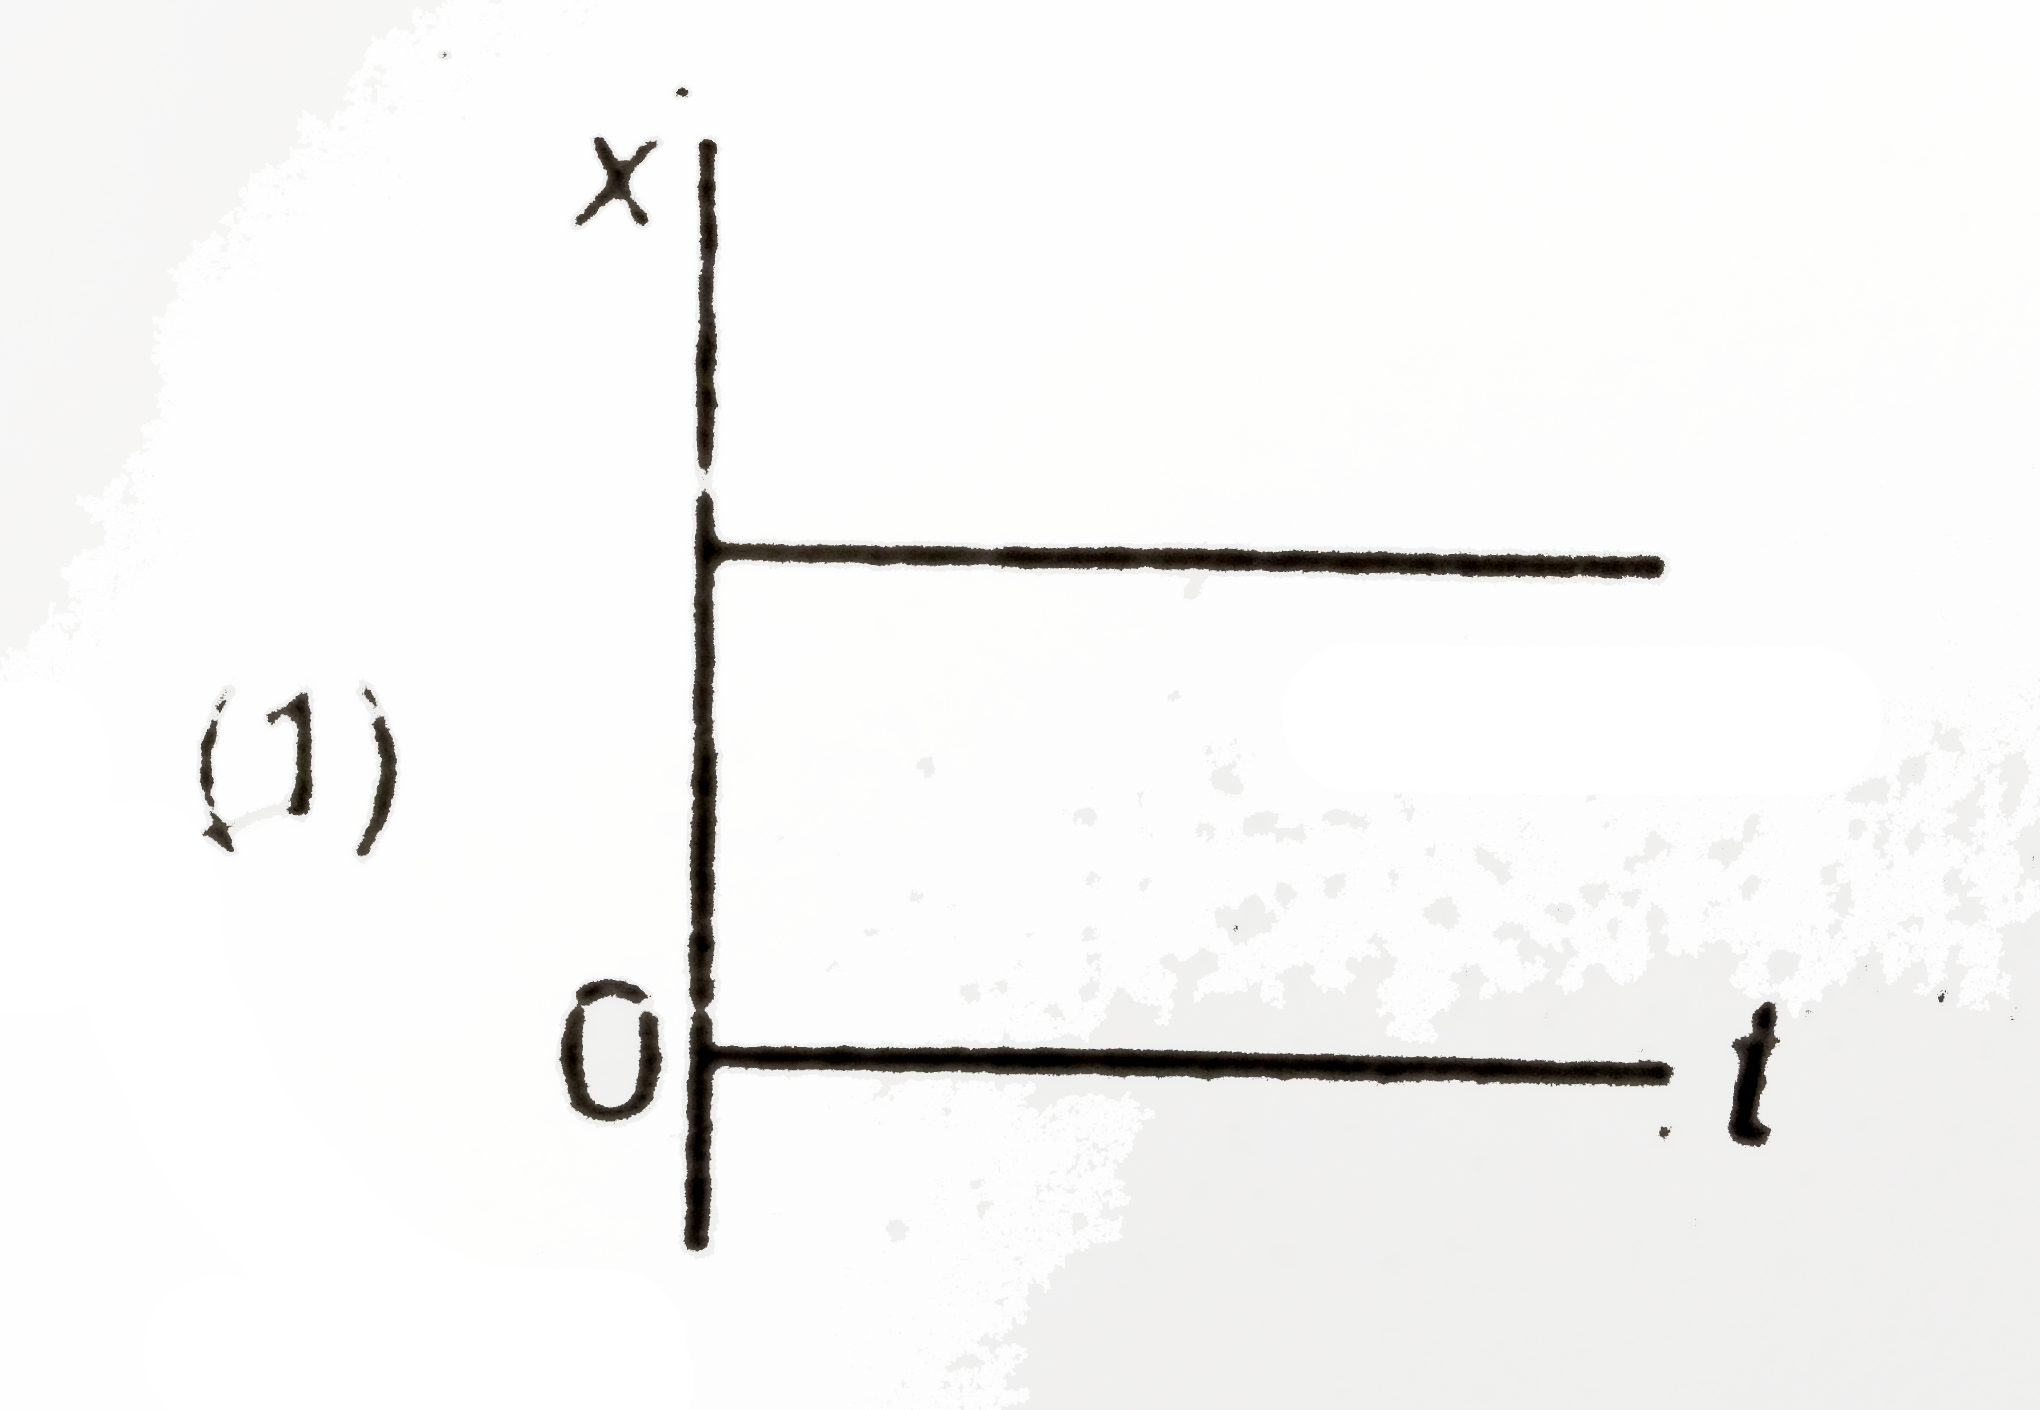 B
B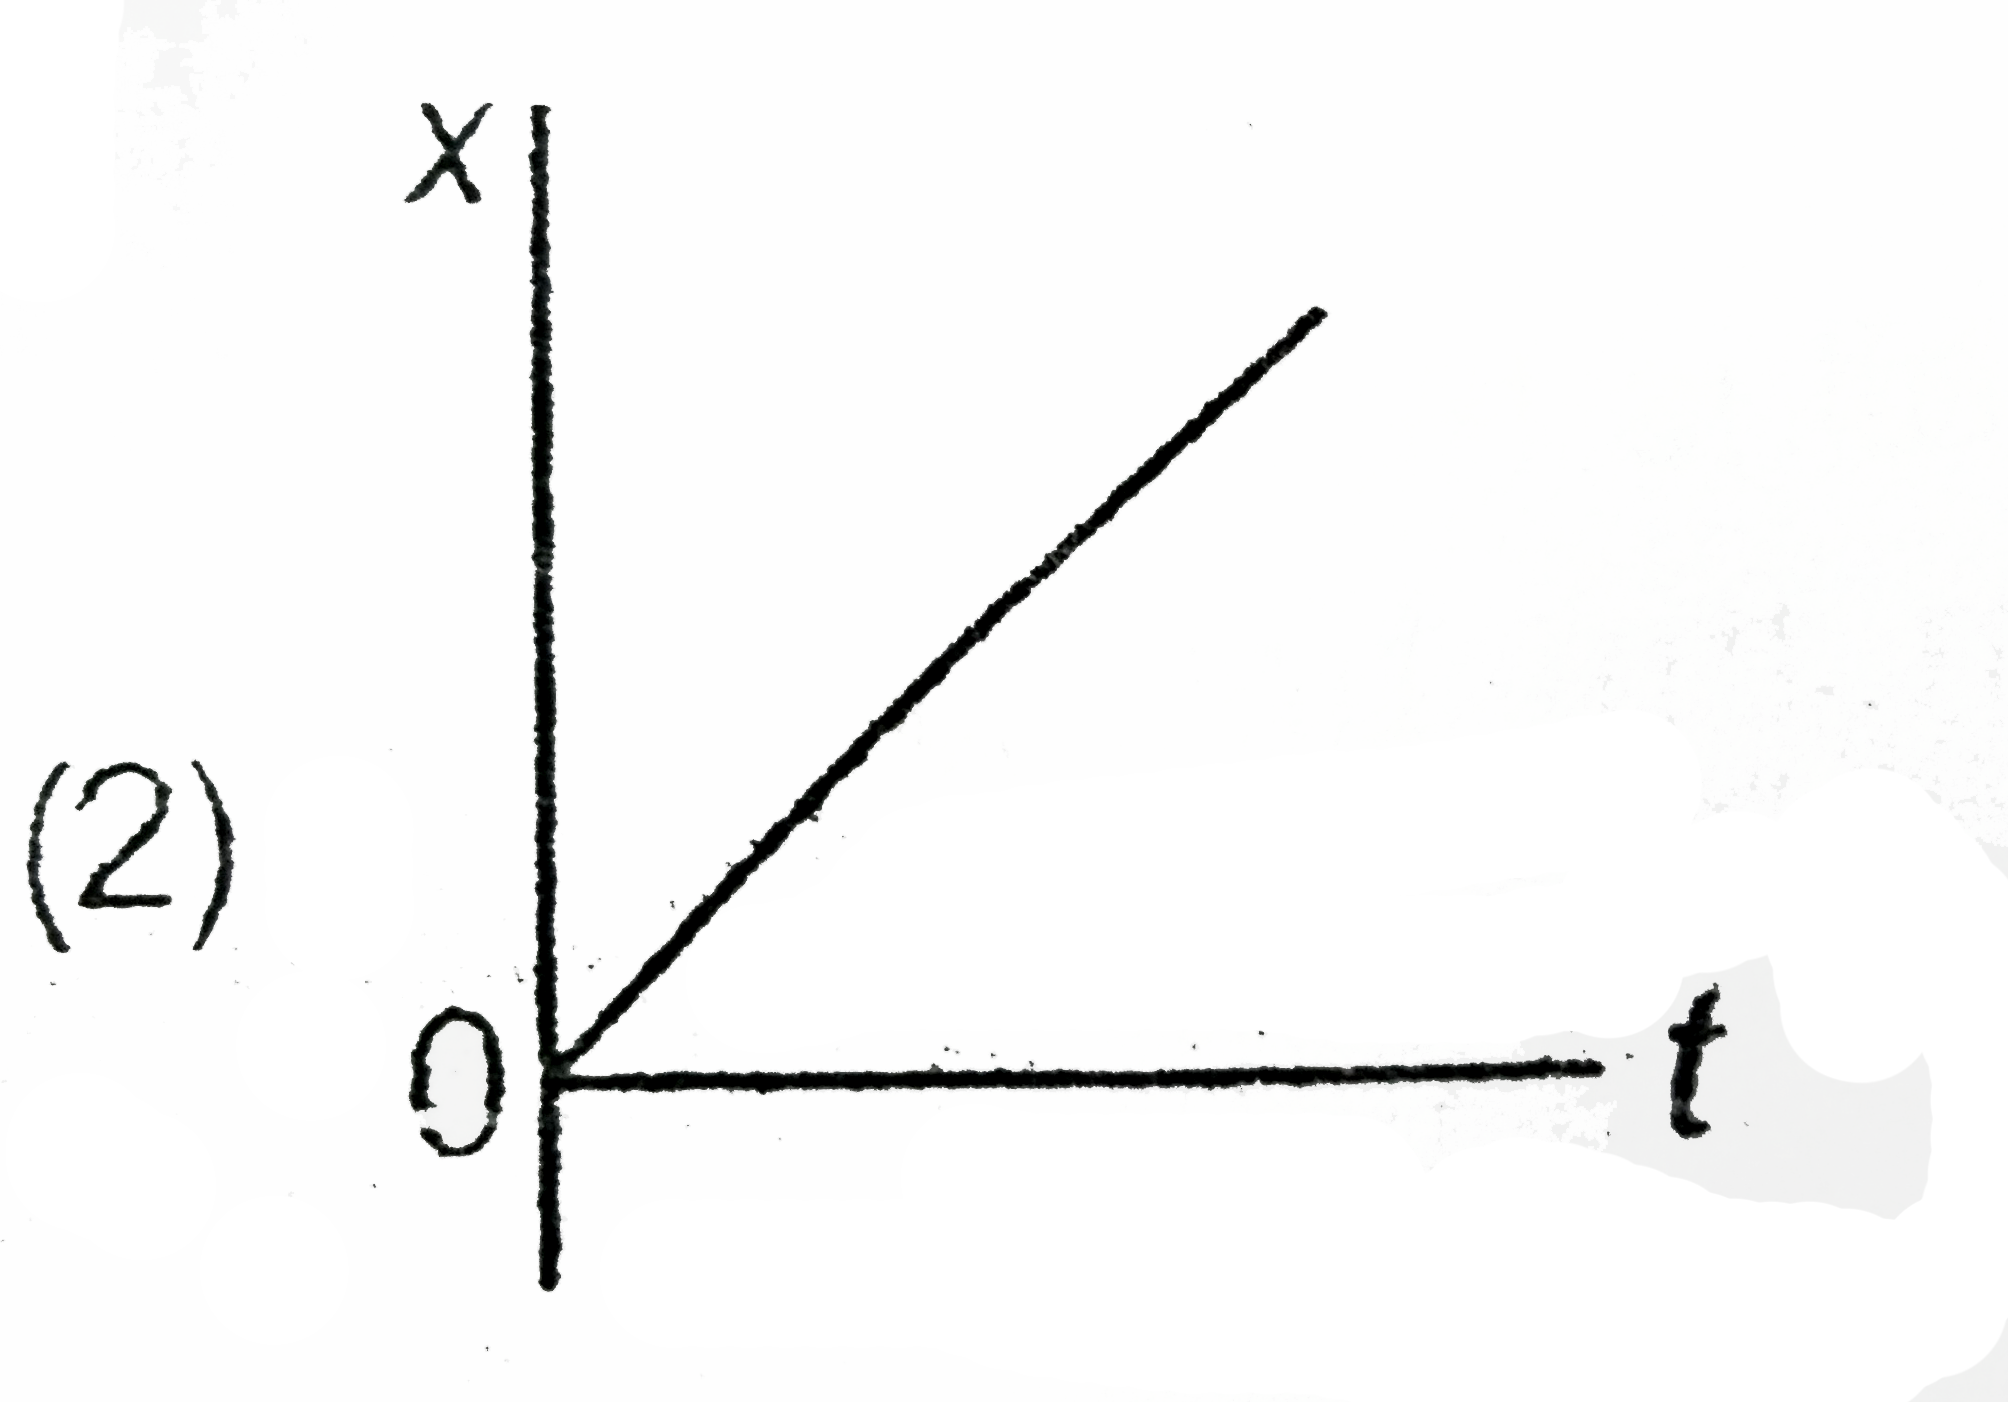 C
C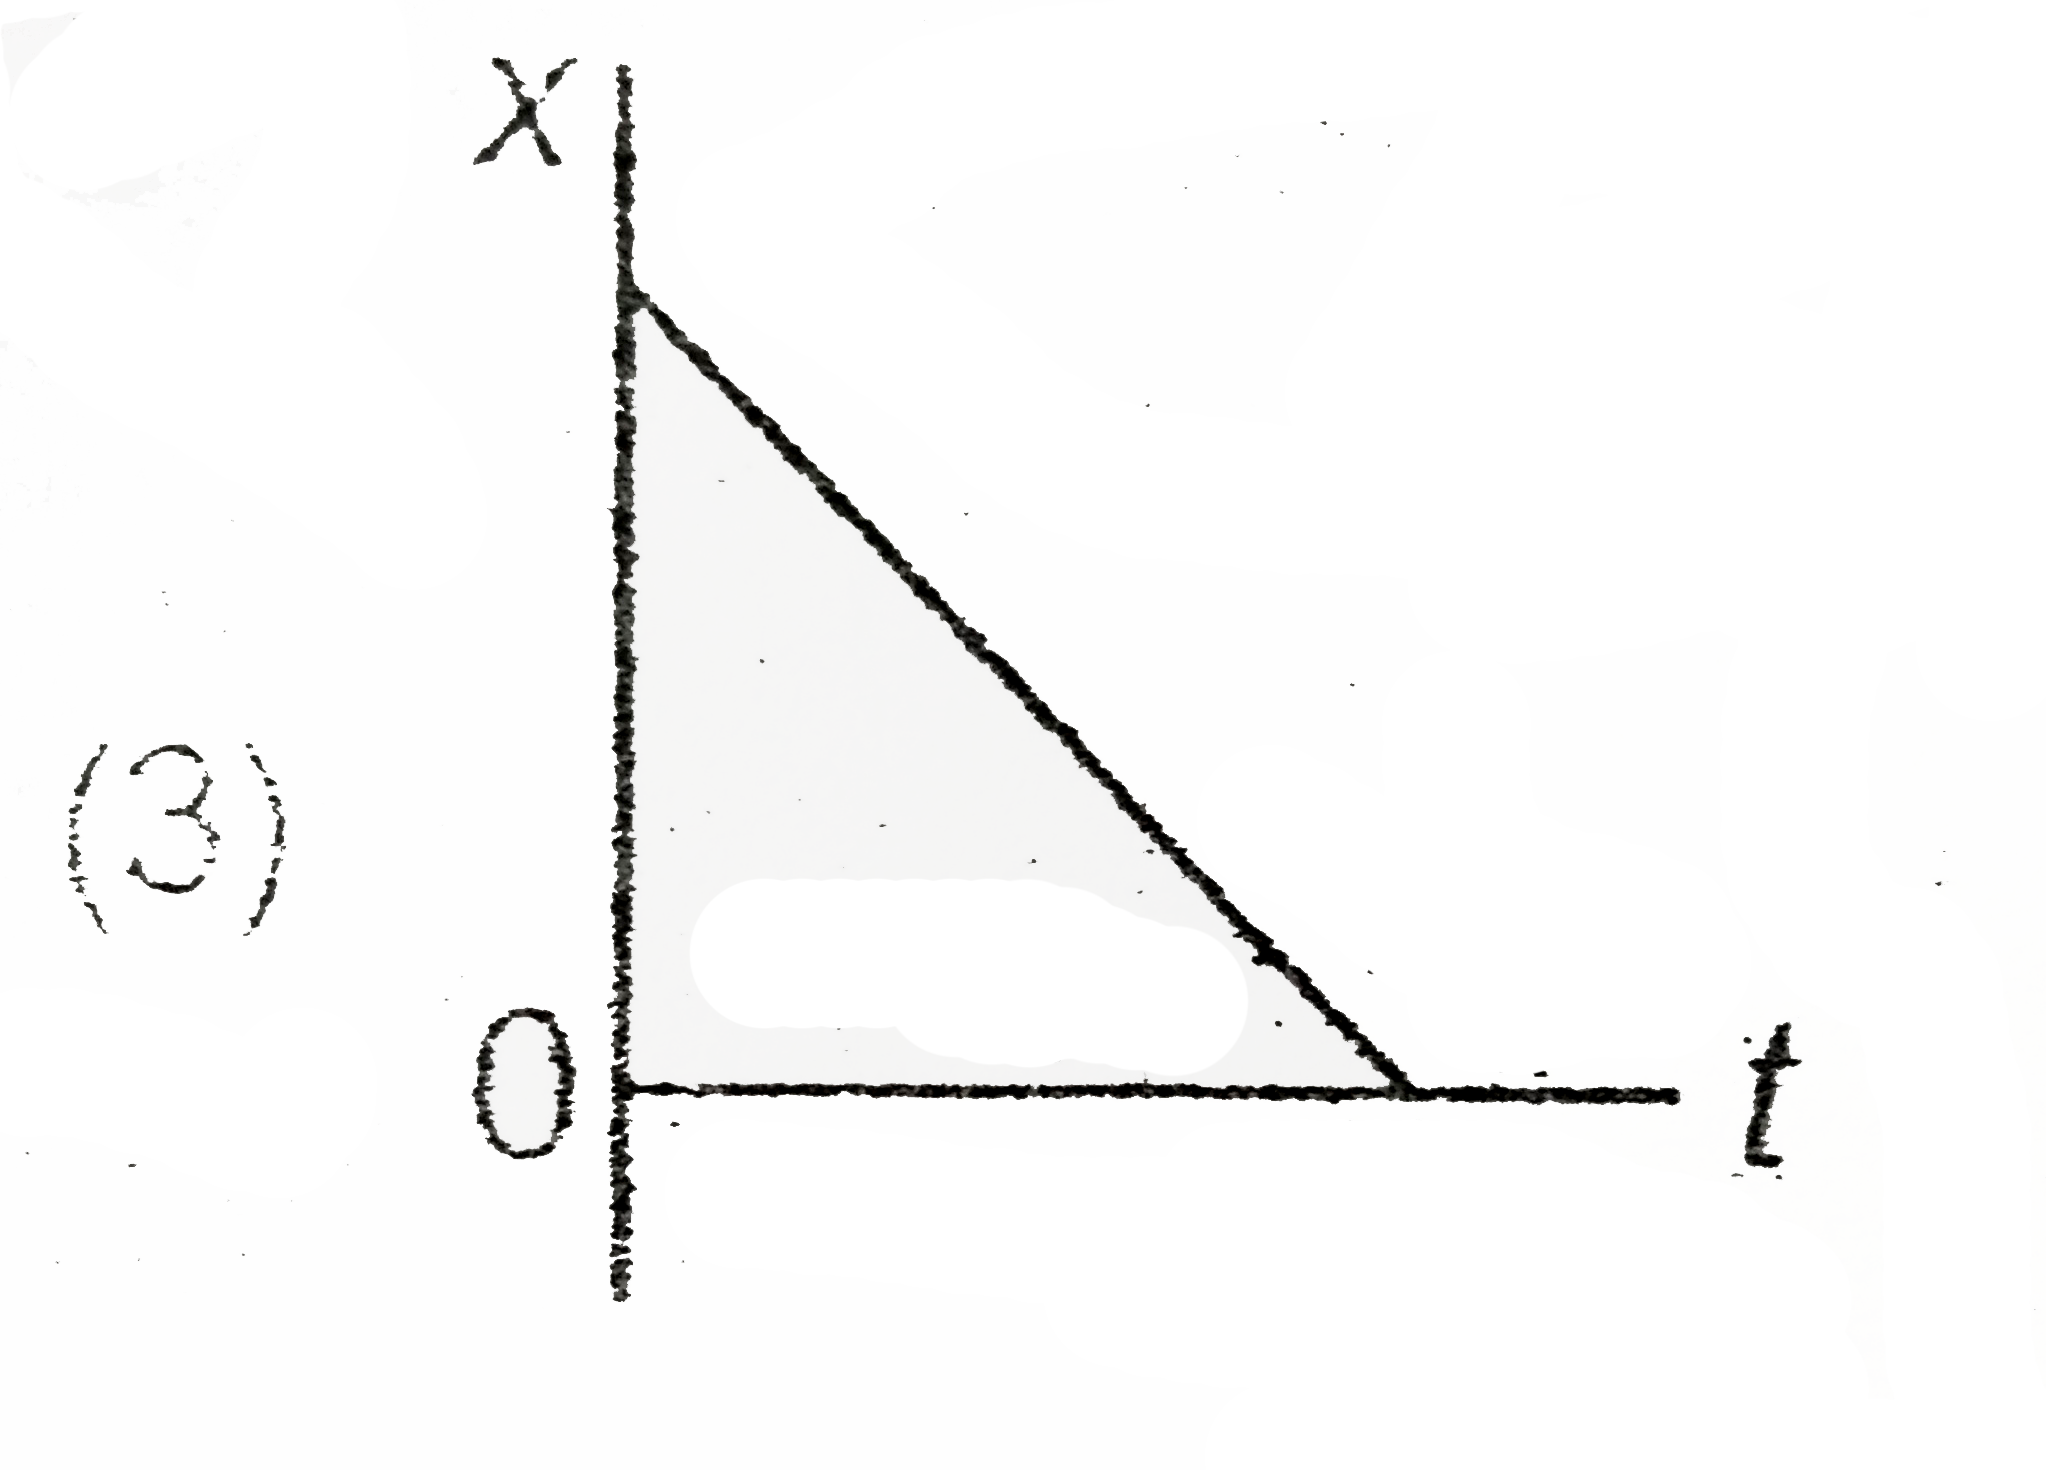 D
D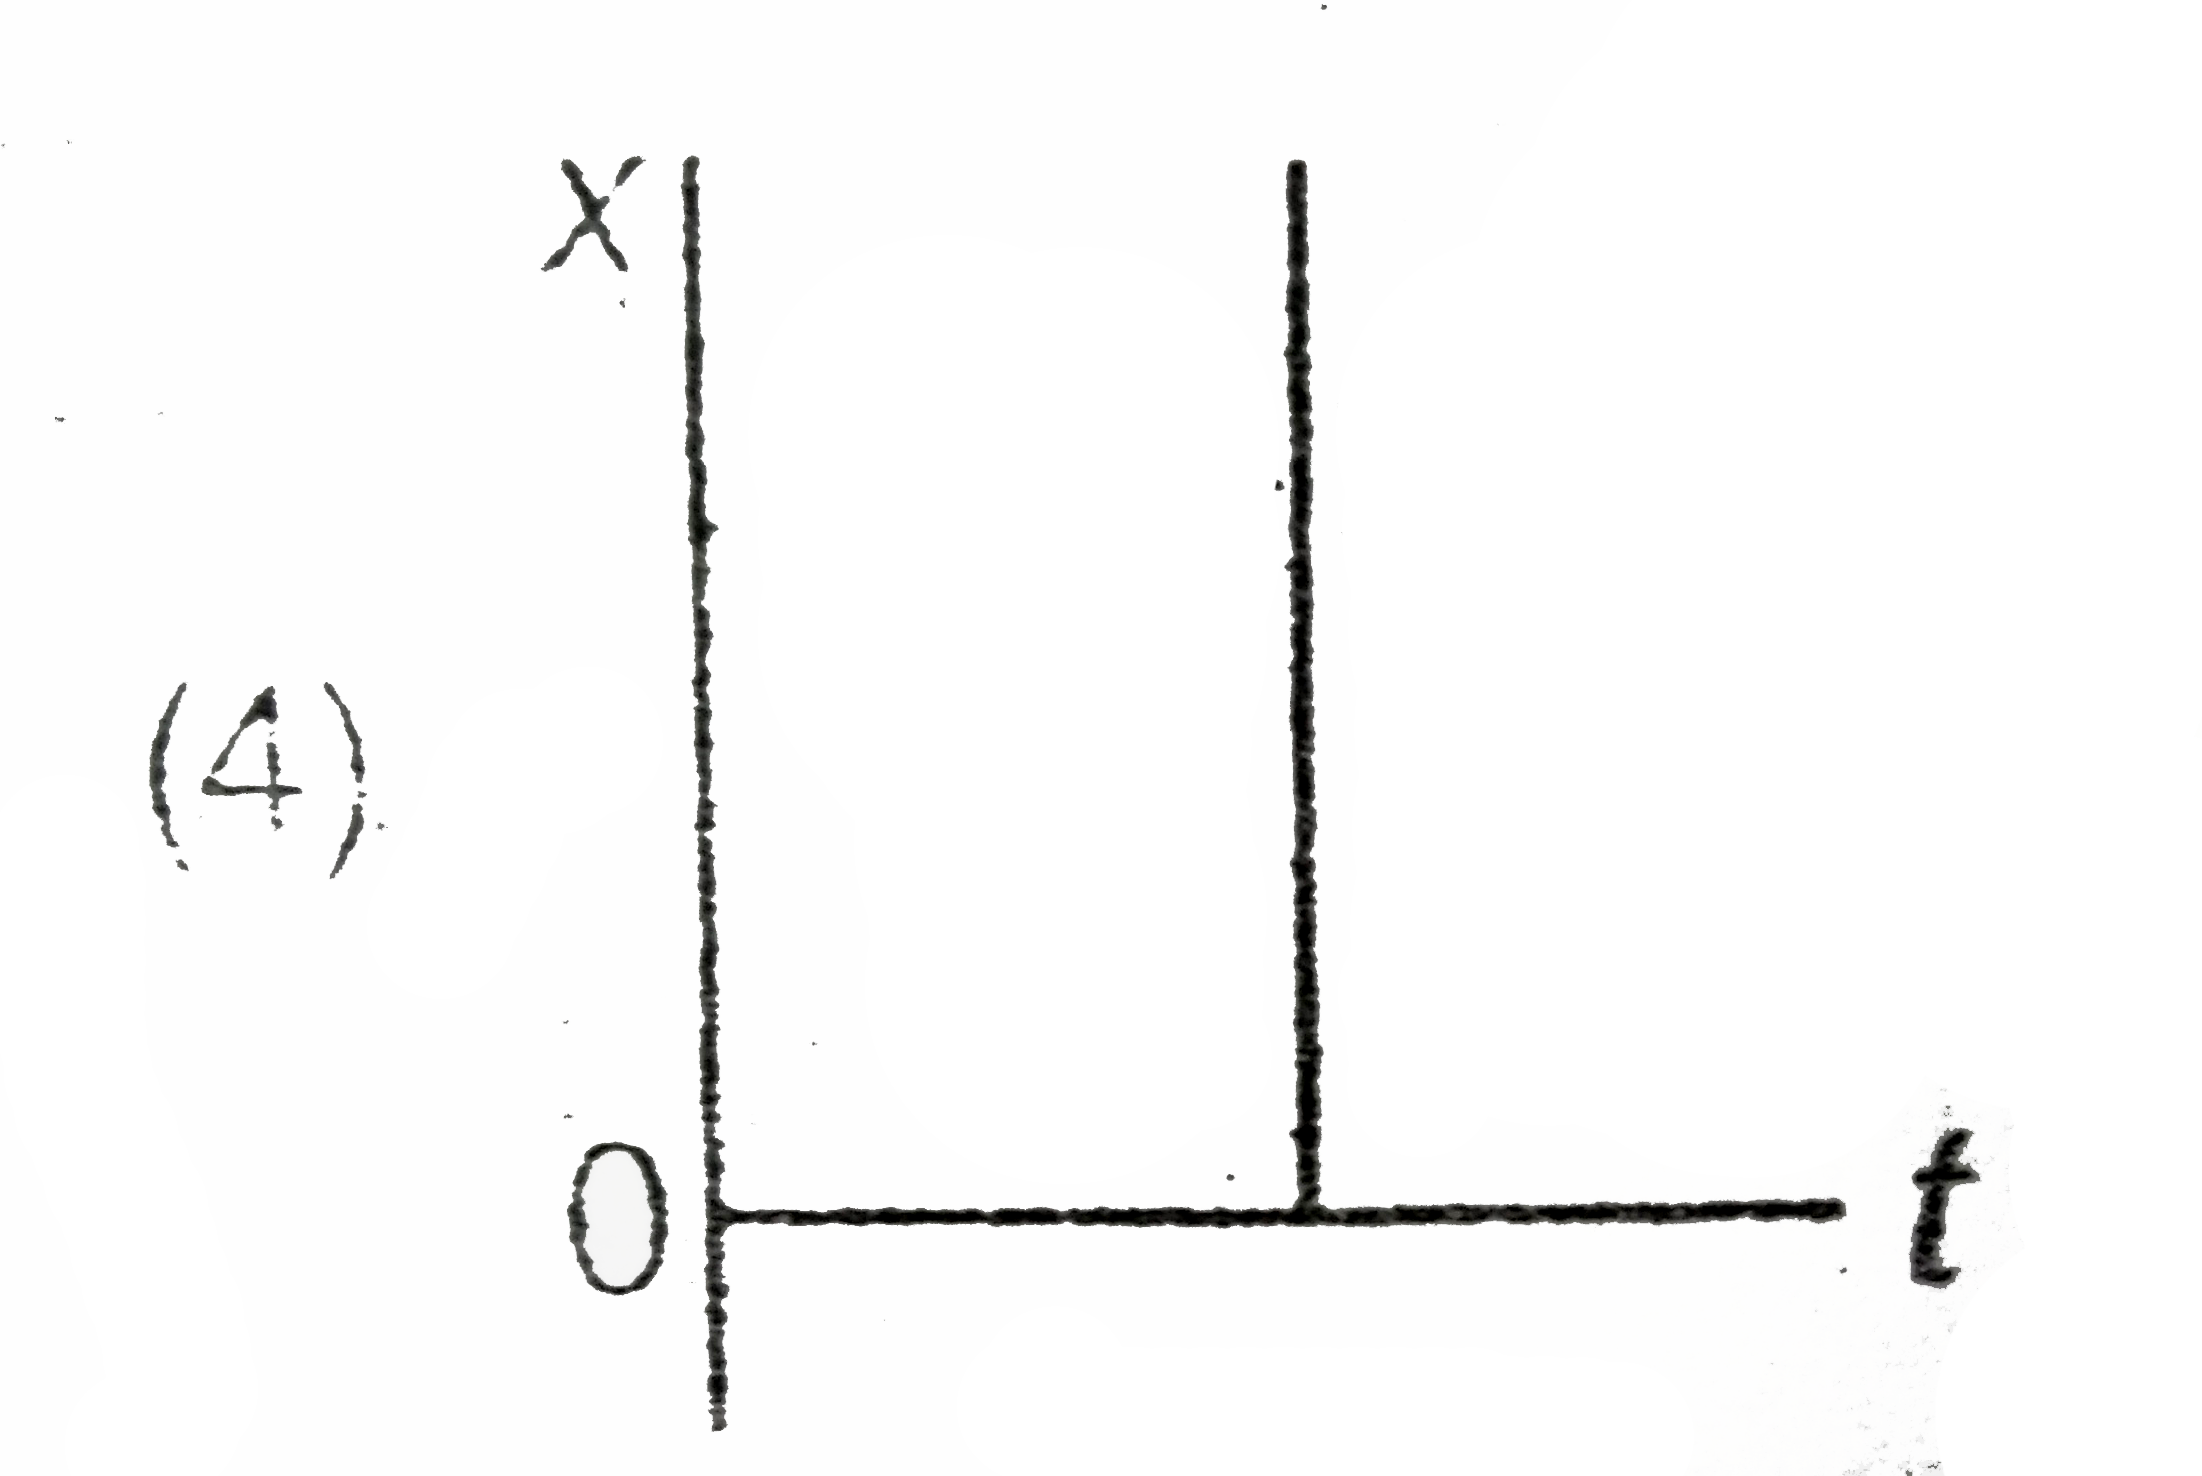
Which of the following velocity-time graphs (v−tgraph) represent uniform motion
A B
B C
C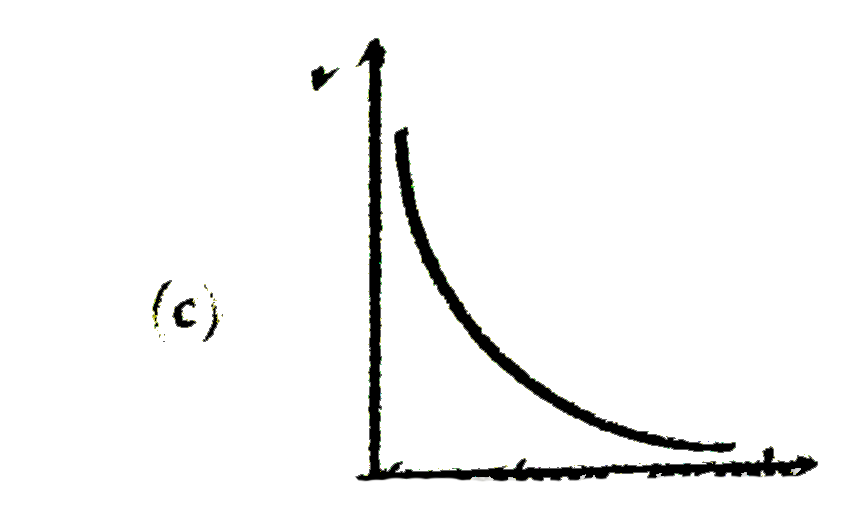 D
D
Which of the following position-time graphs correctly represents two moving objects A and B with zero relative velocity ?
A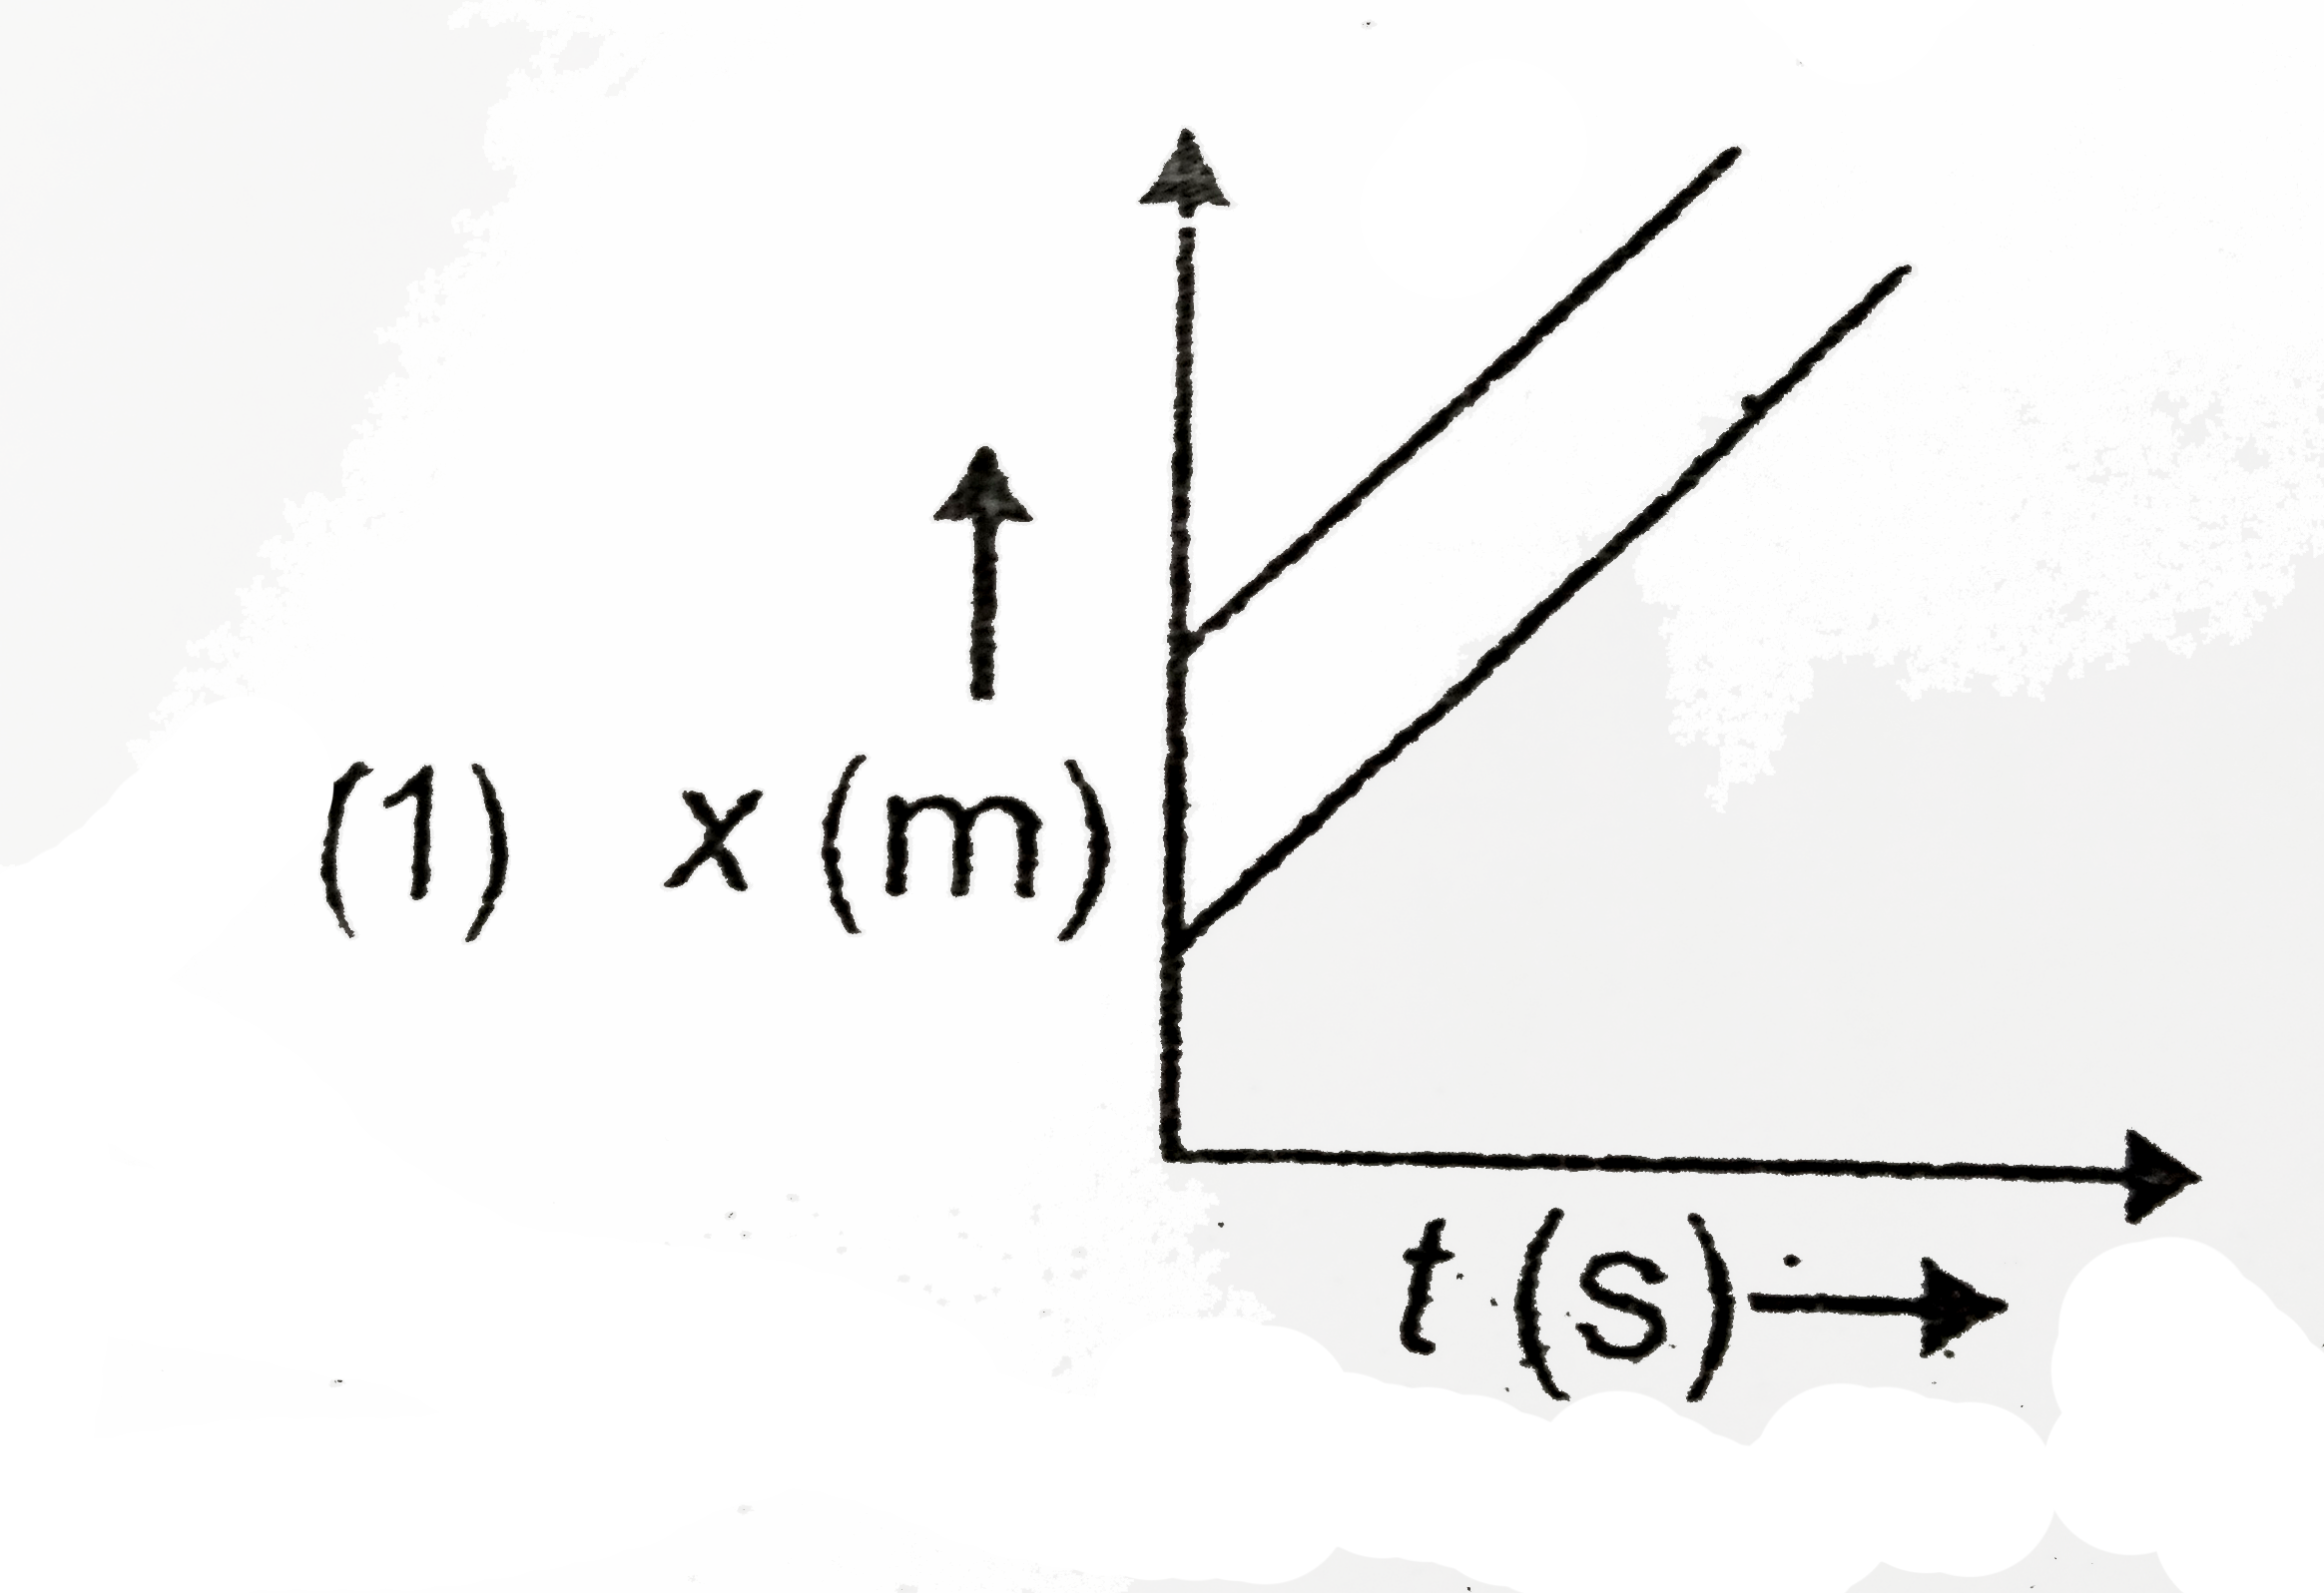 B
B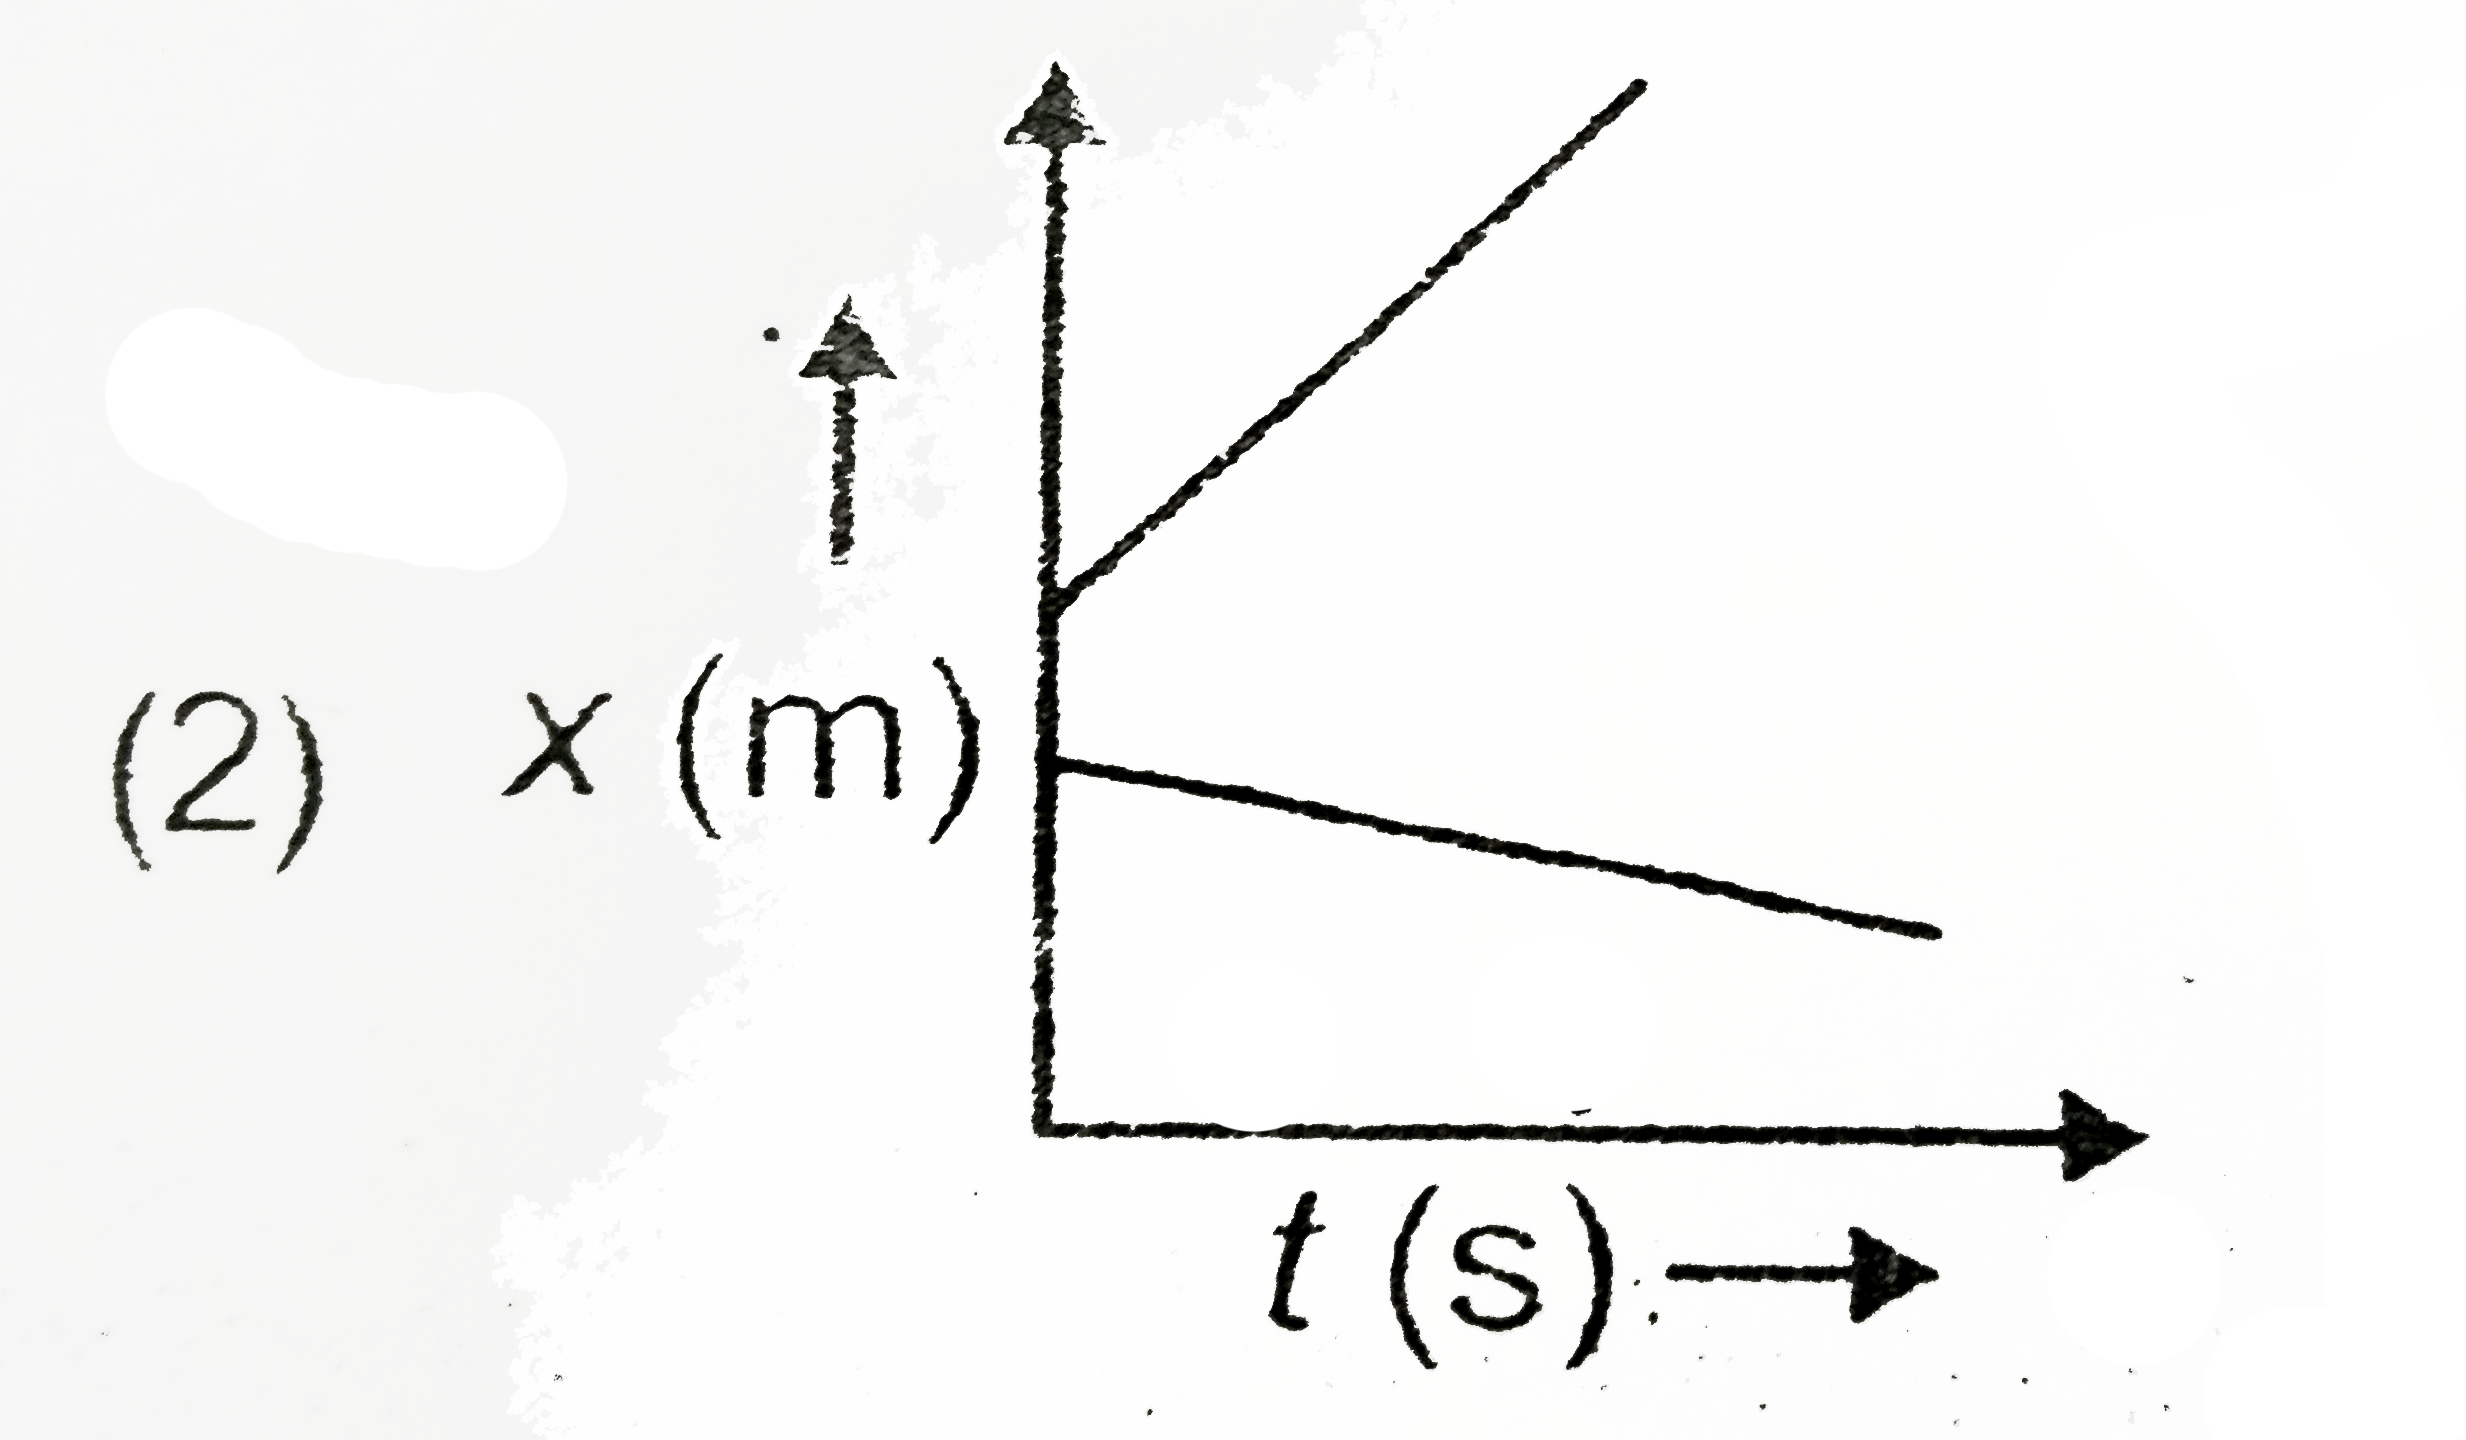 C
C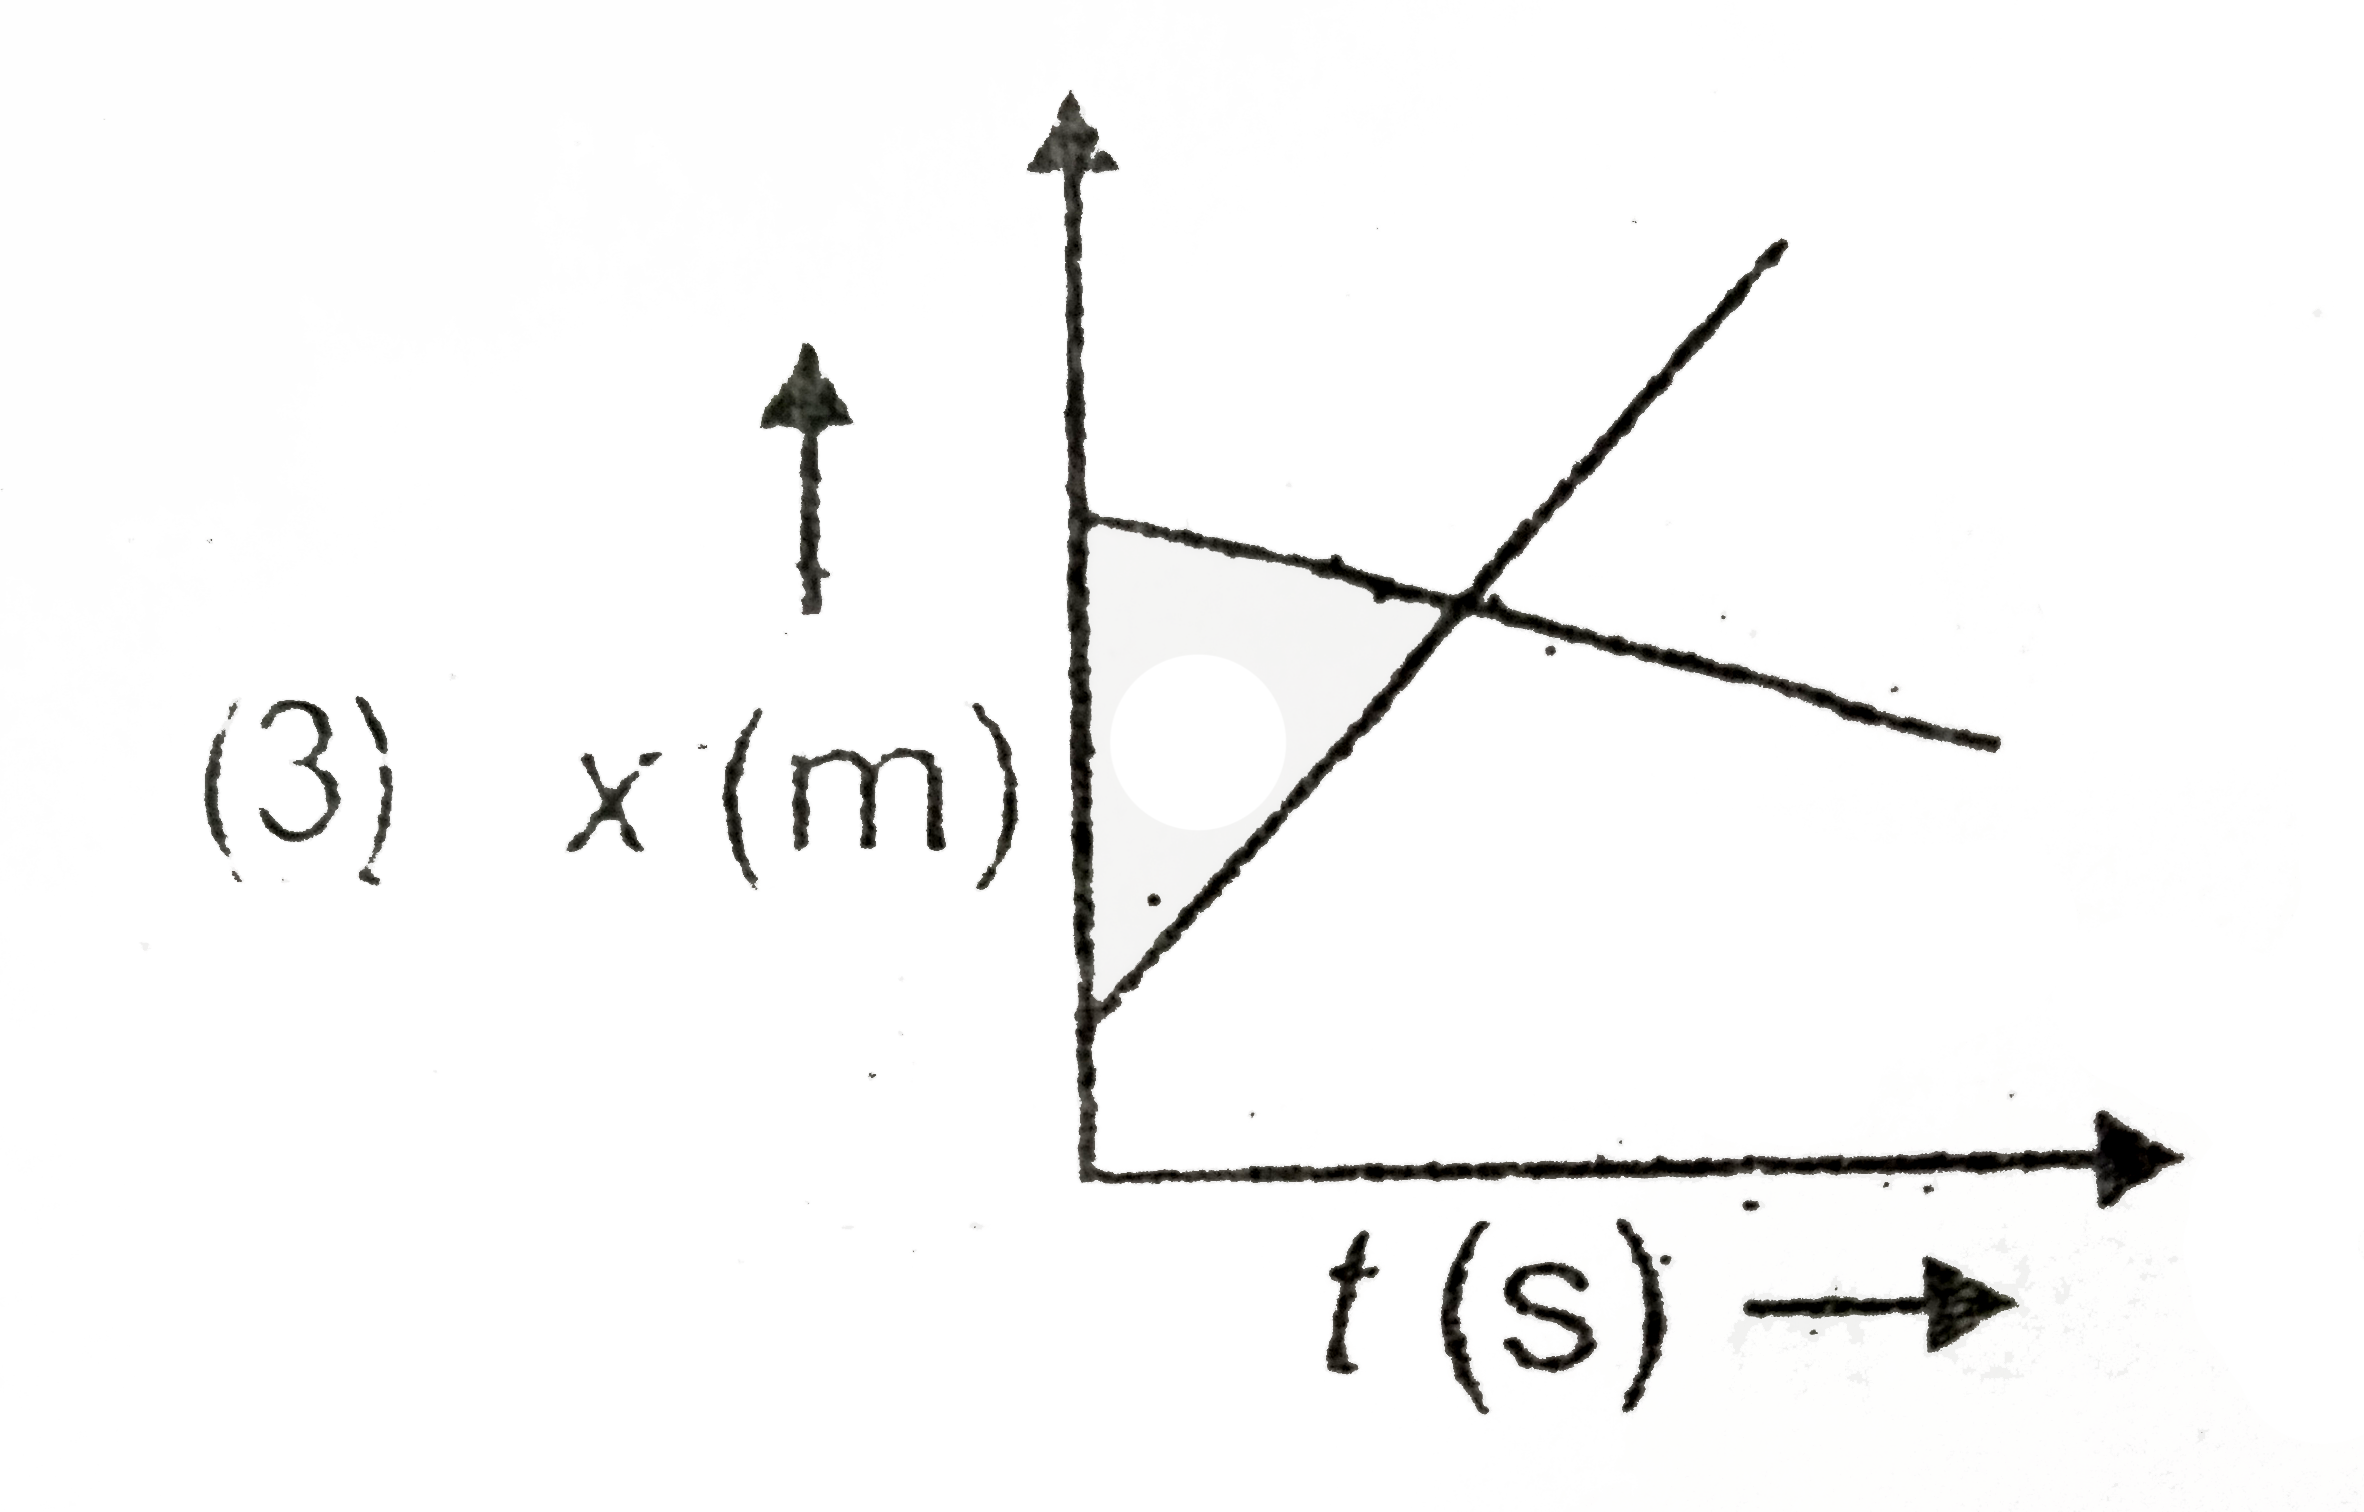 D
D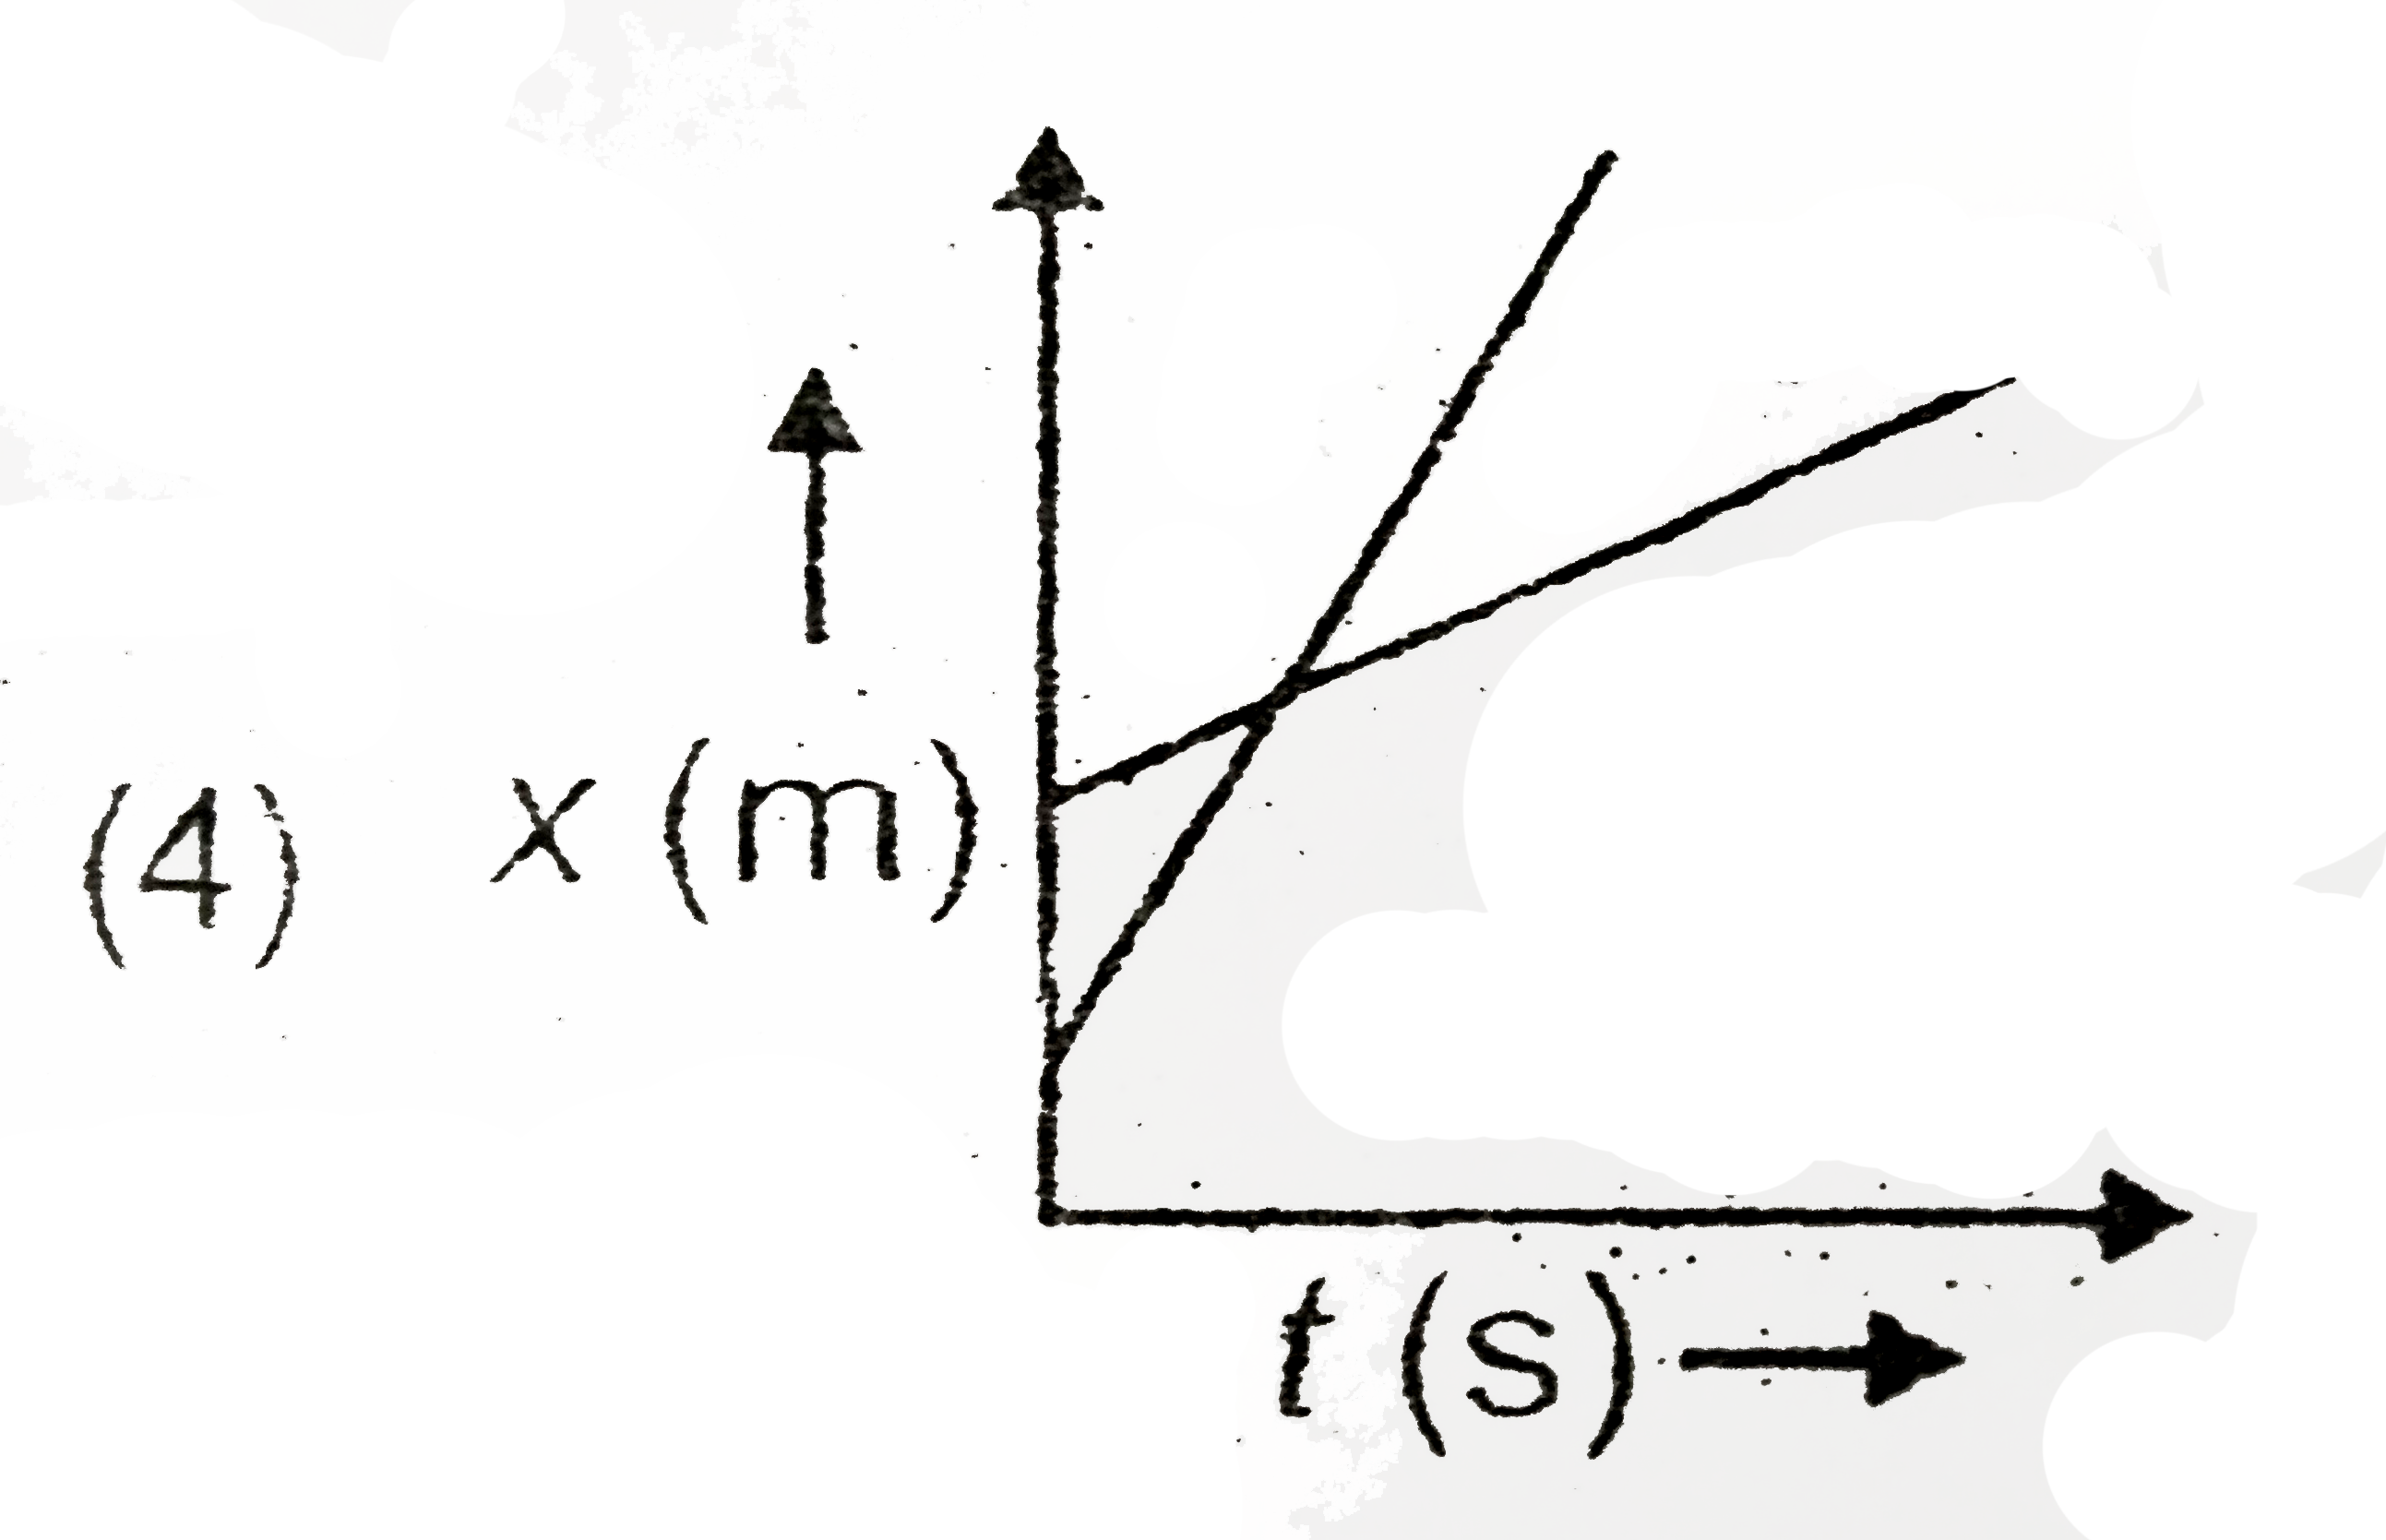
Which of the following graphs represent abody at rest ?
View SolutionWhich of the following velocity-time graphs does not represent motion in one dimension?
View SolutionWhich of the following displacement-time graphs represent damped harmonic oscillation?
View SolutionWhich of the following graphs represents the position time-graph of a particle moving with negative velocity?
View SolutionWhich of the following x-t graphs represents the distance-time variation of a body released from the top of a buiding?
View Solution
