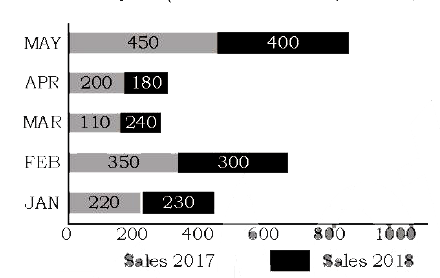
In the given bar chart, which month sale shows the maximum increase in 2018 as against 2017
April
March
January
May
The correct Answer is:B
To solve the question regarding which month's sales showed the maximum increase in 2018 compared to 2017, we will follow these steps:
Step 1: Identify the Sales Data
First, we need to extract the sales data for each month from the bar chart for both years (2017 and 2018).
- January 2017: 220
- January 2018: 230
- February 2017: (Assuming it is not given, we will skip this month)
- February 2018: (Assuming it is not given, we will skip this month)
- March 2017: 110
- March 2018: 240
- April 2017: (Assuming it is not given, we will skip this month)
- April 2018: (Assuming it is not given, we will skip this month)
- May 2017: (Assuming it is not given, we will skip this month)
- May 2018: (Assuming it is not given, we will skip this month)
Step 2: Calculate the Increase for Each Month
We will calculate the increase in sales for the months where data is available.
For January:
- Increase = Sales in January 2018 - Sales in January 2017
- Increase = 230 - 220 = 10
- Percentage Increase = (Increase / Sales in January 2017) × 100
- Percentage Increase = (10 / 220) × 100 = 4.54%
For March:
- Increase = Sales in March 2018 - Sales in March 2017
- Increase = 240 - 110 = 130
- Percentage Increase = (Increase / Sales in March 2017) × 100
- Percentage Increase = (130 / 110) × 100 = 118.18%
Step 3: Compare the Increases
Now we compare the percentage increases calculated for January and March.
- January: 4.54%
- March: 118.18%
Step 4: Identify the Maximum Increase
From the comparison, we can see that March has a higher percentage increase than January.
Conclusion
The month that shows the maximum increase in sales in 2018 as against 2017 is March with an increase of 118.18%.
---
First, we need to extract the sales data for each month from the bar chart for both years (2017 and 2018).
- January 2018: 230
- February 2017: (Assuming it is not given, we will skip this month)
- February 2018: (Assuming it is not given, we will skip this month)
- March 2017: 110
- March 2018: 240
- April 2017: (Assuming it is not given, we will skip this month)
- April 2018: (Assuming it is not given, we will skip this month)
- May 2017: (Assuming it is not given, we will skip this month)
- May 2018: (Assuming it is not given, we will skip this month)
We will calculate the increase in sales for the months where data is available.
- Increase = Sales in January 2018 - Sales in January 2017
- Increase = 230 - 220 = 10
- Percentage Increase = (Increase / Sales in January 2017) × 100
- Percentage Increase = (10 / 220) × 100 = 4.54%
- Increase = Sales in March 2018 - Sales in March 2017
- Increase = 240 - 110 = 130
- Percentage Increase = (Increase / Sales in March 2017) × 100
- Percentage Increase = (130 / 110) × 100 = 118.18%
Now we compare the percentage increases calculated for January and March.
- March: 118.18%
From the comparison, we can see that March has a higher percentage increase than January.
The month that shows the maximum increase in sales in 2018 as against 2017 is March with an increase of 118.18%.
Topper's Solved these Questions
Similar Questions
The given bar chart shows the details of cycle sales by a company between january and May for years 2017 and 2018
In the given bar chart, which month sales show the maximum decrease in 2018 as compared to 2017View SolutionThe given bar chart shows the details of cycle sales by a company between January and May for years 2017 and 2018.
दिया गया दंड आरेख वर्ष 2017 एवं 2018 में एक कंपनी के द्वारा जनवरी से लेकर मई तक साइकिल बिक्री की जानकारी देता है |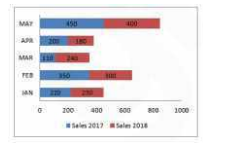 In the given bar-chart, which month sales show the maximum decrease in 2018 as compared to 2017?
दिए गए दंड आरेख में, किस माह की बिक्री 2017 की तुलना में 2018 में अधिकतम कमी को दर्शाती है ?View Solution
Knowledge Check
- Question 1 - Select One
The given bar chart shows the details of cycle sales by a company between January and May for years 2017 and 2018.
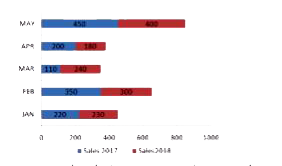
In the given bar-chart, what is the total increase or decrease in percentage sale in 2018?A3% increaseB1.5% increaseC1.5% decreaseD3% decrease
The given bar chart shows the details of cycle sales by a company between january and May for years 2017 and 2018
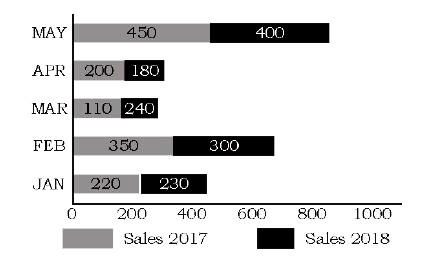
In the given bar chart, which month sales show the maximum decrease in 2018?View SolutionThe given bar chart shows the sales of books in four metro branches of a company for the years 2014 and 2015.
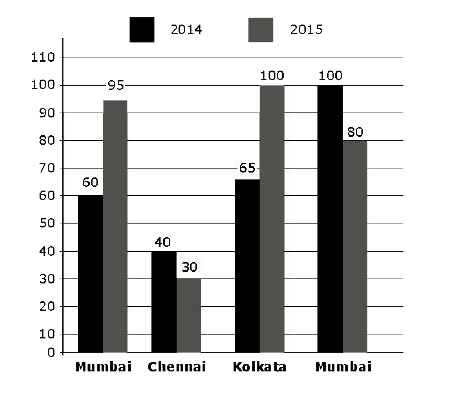
In the given bar chart, which branch has the highest increase in sale in 2015 as compared to 2014?View SolutionThe given bar chard shows population of 4 different states in 3 years
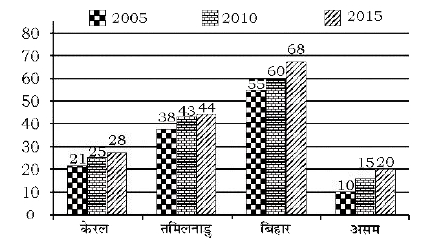
IN the given bar chart which state has had the maximum population growth in 2015 compared to 2005?View SolutionThe given bar chart shows population of 4 different states in 3 years (in crores).
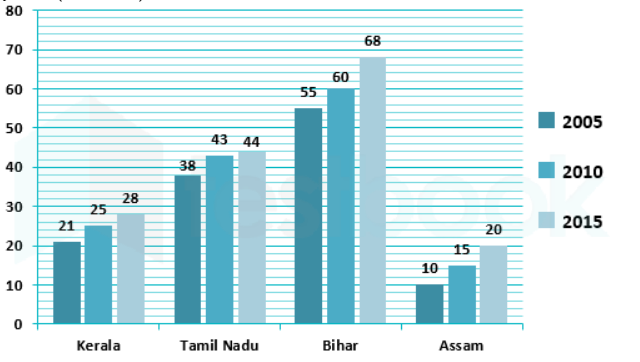
In the given bar-chart. which state has had the maximum population growth in 2015 compared to 2005.View SolutionThe given bar chart shows number of marks scored by a student in each subject in three years
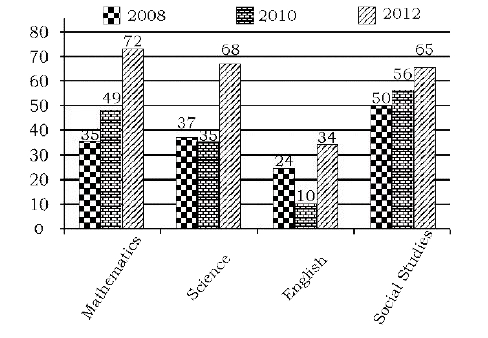
In the given bar chart what is the approximate percentage increase in marks in mathematics in 2012 compared to 2008?View SolutionThe given bar chart shows number of marks scored by a student in each subject in three years:
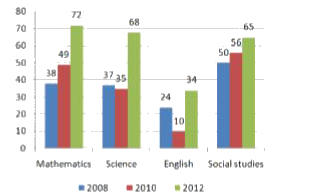
In the given bar-chart. what is the percentage increase in marks in Mathematics in 2012 compared to 2008?(round off)View SolutionThe given bar chart shows production of steel by companies A, B, C and D for years 2014, 2015, 2016 (in tonnes).
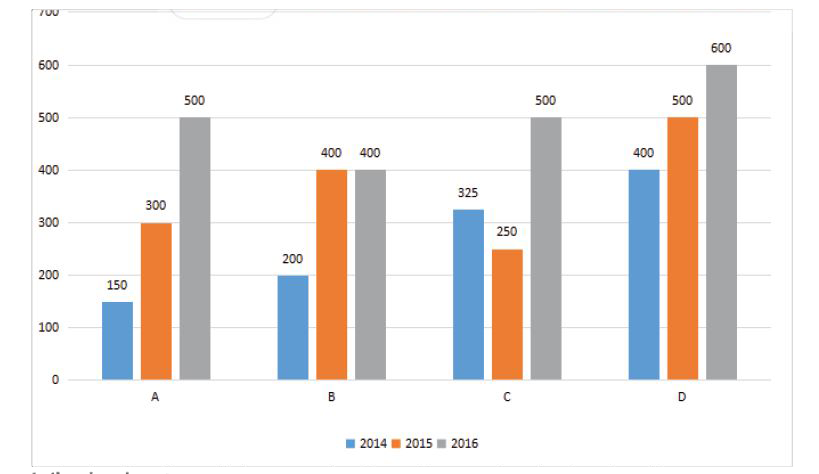
In the given bar-chart, which company has the maximum total production of steel?View Solution

