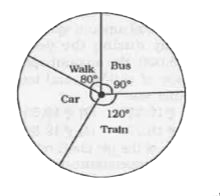
The given pie chart depicts the percentage of students coming to school using different modes of transport. Total number of students =1300
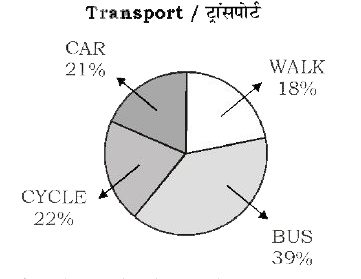
In the given pie chart the percentage difference between students coming by car and bus to coming by walking and cycling.
507
364
432
286
The correct Answer is:A
Step by step video & image solution for The given pie chart depicts the percentage of students coming to school using different modes of transport. Total number of students =1300 In the given pie chart the percentage difference between students coming by car and bus to coming by walking and cycling. by Maths experts to help you in doubts & scoring excellent marks in Class 14 exams.
Updated on:21/07/2023Topper's Solved these Questions
Similar Questions
The given pie-chart depicts the percentage of students coming to school using different modes of transport. Total number of students=1300
दिया गया पाई चार्ट परिवहन के विभिन्न साधनों का प्रयोग करके विद्यालय आने वाले छात्रों का प्रतिशत दर्शाता है | छात्रों की कुल संख्या =1300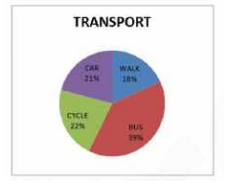 In the given pie-chart, if 234 students used to walk, then how many come by bus ? /
दिए गए पाई-चार्ट में, यदि 234 छात्र चलकर आते हैं, तो कितने छात्र बस से आते हैं?
View SolutionThe given pie-chart depicts the percentage of students coming to school using different modes of transport. Total number of students=1300
दिया गया पाई चार्ट परिवहन के विभिन्न साधनों का प्रयोग करके विद्यालय आने वाले छात्रों का प्रतिशत दर्शाता है | छात्रों की कुल संख्या =1300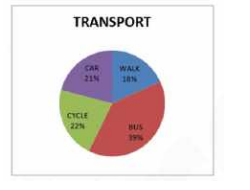 In the given pie-chart, the difference between the number of students travel by bus or walk to the number of students travel by car or cycle,
इस पाई चार्ट के अनुसार बस सेया पैदल यात्रा करने वाले छात्रों की संख्या एवं कार अथवा साइकिल से यात्रा करने वाले छात्रों की संख्या में क्या अंतर है ?
View Solution
Knowledge Check
The given pie-chart represents the percentage of students enrolled in five different sports. The total number of students is 2800.
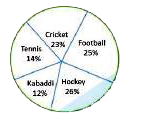
What is the average number of student enrolled in Hockey and Tennis together ?A560B580C540D460The given pie-chart represtns the percentage of students enrolled in five different sports. The total number of students is 2800.

What is the average number of students enrolled in Hockey and Tennis together?A560B580C540D460The given pie-chart depicts the percentage of students coming to school using different modes of transport. Total number of students=1300
दिया गया पाई चार्ट परिवहन के विभिन्न साधनों का प्रयोग करके विद्यालय आने वाले छात्रों का प्रतिशत दर्शाता है | छात्रों की कुल संख्या =1300 In the given pie-chart, the difference between the number of students travel by bus or walk to the number of students travel by car or cycle,
इस पाई चार्ट के अनुसार बस सेया पैदल यात्रा करने वाले छात्रों की संख्या एवं कार अथवा साइकिल से यात्रा करने वाले छात्रों की संख्या में क्या अंतर है ?A182B364C125D142
The given pie chart shows favorite shows of student of a school
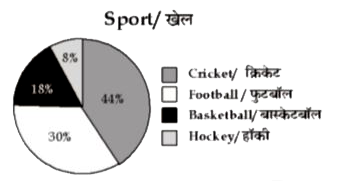
In the given pie chart, what is the difference in percentage between liking for football and basketball
View SolutionThe pie chart given below shows the number of students in 6 different sections. The total number of students is 1800.
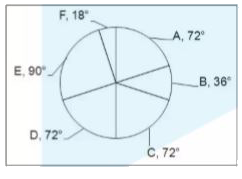
What is the difference between the number of students in section F to the number of students in section C?
View SolutionThe pie chart given below shows the number of students in 6 different sections. The total number of students is 1800.
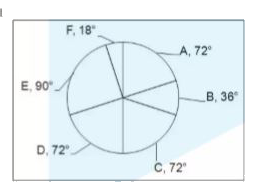
What is the total number of students in section E, C and F?
View SolutionThe given pie-chart represents the percentage of students enrolled in five different sports. The total number of students is 2800.
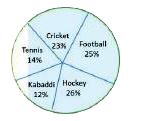
If 24 students playing cricket are shifted to Kabaddi, then find the new ratio of the number of students in Cricket to those in Kabaddi.
View SolutionThe pie-chart given below represents the number of students using different transport to a school in which total number of students is 2160.
Answer the questions based on the following diagram.
The total number of students coming to school either by walking or by bus is
View Solution
