यह तालिका छ वर्ष के दौरान विभिन्न शोरूमो में बेचीं गई कारो की संख्या को दर्शाती है।
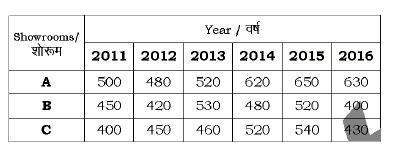
यदि तीनो शोरूमो द्वारा छ वर्ष में बेचीं गई कारो की कुल संख्या को वृत्त आरेख (पाई-चार्ट) के रूप में दर्शाया जाए, तो वर्ष 2013 में बेचीं गई कारो की कुल संख्या का प्रदर्शित करने वाले त्रिज्यखंड (सेक्टर) का केंद्रीय कोण क्या है ? (निकटतम पूर्ण संख्या में)
58∘
62∘
60∘
56∘
The correct Answer is:C
Step by step video, text & image solution for यह तालिका छ वर्ष के दौरान विभिन्न शोरूमो में बेचीं गई कारो की संख्या को दर्शाती है। यदि तीनो शोरूमो द्वारा छ वर्ष में बेचीं गई कारो की कुल संख्या को वृत्त आरेख (पाई-चार्ट) के रूप में दर्शाया जाए, तो वर्ष 2013 में बेचीं गई कारो की कुल संख्या का प्रदर्शित करने वाले त्रिज्यखंड (सेक्टर) का केंद्रीय कोण क्या है ? (निकटतम पूर्ण संख्या में) by Maths experts to help you in doubts & scoring excellent marks in Class 14 exams.
Topper's Solved these Questions
Similar Questions
यदि A:B=2:3 और B:C=3:7, तो A+B:B+C:C+A क्या होगा?
03:22View SolutionP और Q की वर्तमान आयु के बीच का क्रमशः अनुपात 3 : 4 है। चार वर्ष बाद Q, P से पाँच वर्ष बड़ा होगा।P की वर्तमान आयु कितनी है?
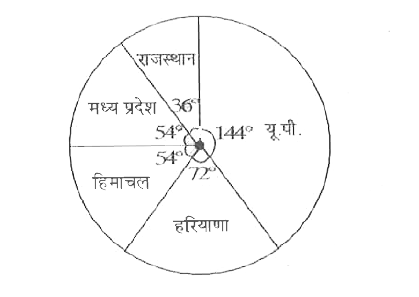
03:22View Solutionचित्र में दिया गया वृत्त चार्ट मई -जून 2013 के दौरान वाहनों का केन्द्र्य सर्कार द्वारा चल्या गये अभियान में कटे हुए चलानो की संख्या को डिग्री (∘ ) में दर्शाता है। इसे ध्यानपूर्वक पढ़िए व निम्न प्रशनो के उत्तर दीजिए।
यदि कुल वाहनों 72 लाख है तो मध्य प्रदेश में कटे चालानों की संख्या राजस्थान के कटे चालानों की संख्या से कितना अधिक है ?
 02:50View Solution
चित्र में दिया गया वृत्त चार्ट मई -जून 2013 के दौरान वाहनों का केन्द्र्य सर्कार द्वारा चल्या गये अभियान में कटे हुए चलानो की संख्या को डिग्री (∘ ) में दर्शाता है। इसे ध्यानपूर्वक पढ़िए व निम्न प्रशनो के उत्तर दीजिए।
यदि कुल वाहनों 72 लाख है तो मध्य प्रदेश में कटे चालानों की संख्या राजस्थान के कटे चालानों की संख्या से कितना अधिक है ?
 03:30View Solution
निम्नलिखित संख्याओं में प्रत्येक के लिए सबसे छोटी पूर्ण संख्या ज्ञात कीजिए जिससे इस संख्या को भाग देने पर वह एक पूर्ण संख्या बन जाए। इस तरह ज्ञात की गई संख्या का वर्गमूल भी ज्ञात कीजिए।2800
04:02View SolutionStudy the following pie chart and table to answer the question.Total number of students admitted in a university in various fields = 5000 Distribution of the number of students into various fields: The ratio of the number of boys in Economics to the number of students in Economics is: निम्नांकित पाई चार्ट का अध्ययन कीजिए और उसके बाद दिए गए प्रशन का उत्तर दीजिए। एक विश्वविद्यालय में विभिन्न संकायों में प्रवेश लेने वाले विद्यार्थियों की संख्या 5000 है। विभिन्न संकायों में विद्यार्थियों को संख्या का बंटनः इकोनॉमिक्स में लड़कों की संख्या का, इकोनॉमिक्स में कुल विद्यार्थियों की संख्या से क्या अनुपात हे?
01:34View SolutionThe table given below shows the number of applicants who have applied for exam at various centres as percentage of total number of applicants. The table also shows the number online applicants and absent applicants as a percentage of total applicants of each centre. Total number of applicants is 1200000.
नीचे दी गई तालिका में विभिन्न परीक्षा केन्द्रों में परीक्षा का नामांकन भरने वाले अभ्यर्थियों को संख्या को कुल अभ्यर्थियों की संख्या के प्रतिशत के रूप में दर्शाया गया है। यह तालिका प्रत्येक परीक्षा केन्द्र के ऑनलाइन अभ्यर्थियों तथा अनुपस्थित अभ्यर्थियों की संख्या को कुल अभ्यर्थियों की संख्या के प्रतिशत के रूप में दर्शाती है। अभ्यर्थियों की कुल संख्या 1200000 है।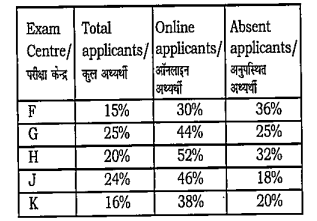 If A equals to 15% of total applicants who are present at exam centre F and B equals to
present applicants at exam centre K, then A is what percent of B?
यदि A परीक्षा केन्द्र F पर उपस्थित अभ्यर्थियों की कुल संख्या के 15% के बराबर है तथा B परीक्षा केन्द्र K पर उपस्थित अभ्यर्थियों के बराबर है, तो A, B का कितना प्रतिशत है?06:59View SolutionThe given table shows the number (in percent) of employees working in different depratments of an organization. The table also shows the ratio of males and females and the ratio of employees living in city Z and employees , living in city Y. The total number of employees in the organization 80,000.
दी गई तालिका में एक संगठन के विभिन्न विभागों में कार्य कर रहे कर्मचारियों की संख्या ( प्रतिशत में ) को दर्शाया गया है। यह तालिका पुरूषों तथा महिलाओं के अनुपाव को तथा शहर ,Z में रह रहे कर्मचारियों तथा शहर Y में रह रहे कर्मचारियों के अनुपात को भी दर्शाती है। संगठन रद में कुल कर्मचारियों की संख्या 80000 है।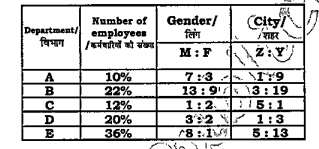 what are the total number of employee in department A and E together?
विभाग A तथा E में मिलाकर कुल कर्मचारियों की संख्या क्या है?01:49View SolutionThe table below indicates the percentage of students and the ratio of boys and girls in the various streams of a college. (Total students = 2600) नीचे दी गयी तालिका छात्रों का प्रतिशत तथा कॉलेज के विभिन्न विषयों में लड़कों तथा लड़कियों का अनुपात दर्शाती है | ( कुल छात्र = 2600 ) If the data about the number of girls enrolled in the various streams is represented by a pie-chart, what is the central angle of the sector representing the number of girls in the ME stream, to the nearest whole degree? यदि विभिन्न विषयों में नामांकन लेने वाली लड़कियों की संख्या से संबंधित आंकड़ों को एक पाई-चार्ट के द्वारा दर्शाया जाए, तो ME विषय में लड़कियों की संख्या को दर्शाने वाले खंड का केंद्रीय कोण ( निकटतम पूर्ण डिग्री में ) क्या होगा ?
03:01View SolutionThe given pie chart shows the quantity wise sales distribution of five products (A, B, C, D and E) of a company in 2016.
दिया गया पाई चार्ट 2016 में एक कंपनी के पाँच उत्पादों ( A, B, C, D और E ) की मात्रा वार बिक्री का वितरण दर्शाता है |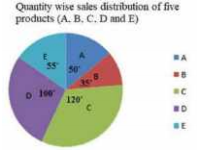 If 1500 units of product D were sold in 2016 and the total number of units sold by the company in
2017 was 18% more than that sold in 2016, then the total units sold by the company in 2017 is:
यदि 2016 में वस्तु D की 1500 इकाइयाँ बेचीं गयीं और 2017 में कंपनी द्वारा बेचीं गयी इकाइयों की कुल संख्या 2016 में बेचीं गयी इकाइयों की कुल संख्या से 18% अधिक थी, तो 2017 में कंपनी द्वारा बेची गयी कुल इकाइयों की संख्या है02:13View SolutionTable shows the production of rice (in million tonnes) of three states over six years. यह तालिका तीन राज्यों में छः वर्षों में दौरान चावल के उत्पादन ( मिलियन टन में ) को दर्शाती है | If the data related to the total production in all three states over these six years is represented in a pie chart, then what will be the central angle of the sector representing the year 2014 ? ( to the nearest whole number ) यदि सभी छ: वर्षों में तीनों राज्यों के कुल उत्पादन के आंकड़ों को वृत्त-आरेख (पाई-चार्ट) के रूप में दर्शाया जाए, तो वर्ष 2014 को दर्शाने वाले त्रिज्यखंड (सेक्टर) का केंद्रीय कोण क्या होगा ? (निकटतम पूर्ण संख्या में )
03:24View SolutionThe table shows the number of cars sold by three showrooms over a period of six years. यह तालिका तीन शोरूम द्वारा छः वर्षों की अवधि में बेची गयी कारों की संख्या दर्शाती है | If the total number of cars sold by all three showrooms over the years is represented as a pie-chart, what is the central angle of the sector representing the total number of cars sold in the year 2013 (to the nearest whole number)? यदि तीनों शोरुम द्वारा इन वर्षों के दौरान बेची गयी कारों की कुल संख्या को एक पाई-चार्ट में प्रस्तुत किया जाए, तो वर्ष 2013 में बेची गयी कारों की कुल संख्या को दर्शाने वाले त्रिज्यखंड का केंद्रीय कोण क्या होगा? ( निकटतम पूर्ण संख्या में )
02:31View SolutionThe table shows the number of cars sold by three showrooms over a period of six years. यह तालिका तीन शोरूम द्वारा छः वर्षों की अवधि में बेची गयी कारों की संख्या दर्शाती है | By what percent did the total number of cars sold by all three showrooms decrease during the year 2016, as compared to that in the year 2015 (nearest to one decimal place)? वर्ष 2015 की तुलना में वर्ष 2016 में तीनों शोरूम के द्वारा बेची गयी कारों की कुल संख्या में कितने प्रतिशत की कमी आयी है ? (एक दशमलव स्थान के निकटतम )
01:14View SolutionThe given Bar Graph presents the number of students of two schools for six years. दिया गया दंड आरेख छः वर्ष की अवधि में दो विद्यालयों में छात्रों की संख्या को दर्शाता है | In which year, the percentage increase in students in school B is the highest in comparison to its previous year? किस वर्ष में, विद्यालय B में छात्रों की संख्या में प्रतिशत वृद्धि इसके पिछले वर्ष की तुलना में सबसे अधिक रही है?
01:39View SolutionThe pie-chart given below shows the number of laptops in an office provided by six different companies in the percentage of total number of laptops. The central angles given in the pie chart are not accurate to any scale. नीचे दिया गया वृत्त-आरेख, छह अलग-अलग कम्पनियों द्वारा किसी कार्यालय में प्रदत्त लैपटॉप की संख्या को, लेपटॉपों की कुल संख्या के प्रतिशत के रूप में दर्शाता है | वृत्त-आरेख में प्रदर्शित केंद्रीय कोण किसी चयनित पैमाने के अनुसार नहीं है | If the total number of laptops in office is 3800, then find the difference between the laptops of company C2 and C5 ? कार्यालय में यदि लैपटॉपों की कुल संख्या 3800 है तो कंपनी C2 तथा C5 के लैपटॉपों की संख्या में अंतर कितना है ?
01:23View SolutionThe bar graph given below presents the number of books sold by a bookseller during different months of a year.
नीचे दिया गया दंड आरेख एक पुस्तक विक्रेता के द्वारा किसी वर्ष के अलग-अलग महीनों में बेची गयी पुस्तकों की संख्या को दर्शाता है |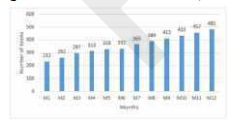 What is the total number of books sold by the bookseller in the year?
वर्ष में इस पुस्तक विक्रेता के द्वारा बेची गयी पुस्तकों की संख्या कुल कितनी है ?03:16View Solution

