The given pie chart shows the quantity wise sales distribution of five products (A, B, C, D and E) of a company in 2016.
दिया गया पाई चार्ट 2016 में एक कंपनी के पाँच उत्पादों ( A, B, C, D और E ) की मात्रा वार बिक्री का वितरण दर्शाता है |
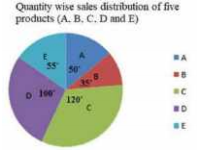 If 1500 units of product D were sold in 2016 and the total number of units sold by the company in
2017 was 18% more than that sold in 2016, then the total units sold by the company in 2017 is:
यदि 2016 में वस्तु D की 1500 इकाइयाँ बेचीं गयीं और 2017 में कंपनी द्वारा बेचीं गयी इकाइयों की कुल संख्या 2016 में बेचीं गयी इकाइयों की कुल संख्या से 18% अधिक थी, तो 2017 में कंपनी द्वारा बेची गयी कुल इकाइयों की संख्या है
6336
6390
6372
6354
Step by step video & image solution for The given pie chart shows the quantity wise sales distribution of five products (A, B, C, D and E) of a company in 2016. दिया गया पाई चार्ट 2016 में एक कंपनी के पाँच उत्पादों ( A, B, C, D और E ) की मात्रा वार बिक्री का वितरण दर्शाता है | If 1500 units of product D were sold in 2016 and the total number of units sold by the company in 2017 was 18% more than that sold in 2016, then the total units sold by the company in 2017 is: यदि 2016 में वस्तु D की 1500 इकाइयाँ बेचीं गयीं और 2017 में कंपनी द्वारा बेचीं गयी इकाइयों की कुल संख्या 2016 में बेचीं गयी इकाइयों की कुल संख्या से 18% अधिक थी, तो 2017 में कंपनी द्वारा बेची गयी कुल इकाइयों की संख्या है by Maths experts to help you in doubts & scoring excellent marks in Class 14 exams.
Updated on:21/07/2023Topper's Solved these Questions
Similar Questions
The graphs of the equations 3x+y-5=0 and 2x-y-5=0 intersect at the point P(α,β). What is the value of (3α+β) ?
समीकरण 3x+y-5=0 तथा 2x-y-5=0 के आरेख एक बिंदु P(α,β) पर एक-दूसरे को काटते है (3α+β) का मान क्या है ?
View SolutionAfter giving two successive discounts, each of x%, on the marked price of an article, total discount is Rs. 259.20. If the marked price of the article is Rs. 720, then the value of x is :
View SolutionFollowing information is available for the year 2016-17, calculate gross profit ratio:
View SolutionMatch the following Column A to Column B

View SolutionThe inequation represented by the graph given below is :
View SolutionThe inequation that best describes the graph given below is _________
View SolutionThe given pie chart shows the quantity wise sales distribution of five products (A, B, C, D and E) of a company in 2016.
दिया गया पाई चार्ट 2016 में एक कंपनी के पाँच उत्पादों ( A, B, C, D और E ) की मात्रा वार बिक्री का वितरण दर्शाता है |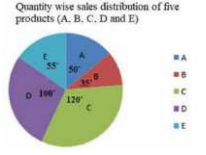 If 320 units of product A were sold by the company, then how many units of products B and E together were sold by the company?
यदि कंपनी के द्वारा वस्तु A की 320 इकाइयाँ बेची गयीं , तो कंपनी के द्वारा बेची गयी वस्तु B और E की कुल इकाइयों की संख्या ज्ञात करें |
View SolutionThe given pie chart shows the quantity wise sales distribution of five products (A, B, C, D and E) of a company in 2016.
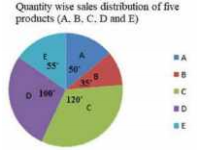 In 2016, if a total of 14616 units were sold, then the number of units of products D sold was:
View SolutionThe given bar graph shows the production and sale of mobile handsets of six different companies A, B, C, D, E, & F during the period of one month. With respect to production, the sale percentage of which company is highest ? दंड आरेख विभिन्न कंपनियों A, B, C, D, E & F की एक माह में मोबाइल हैंडसेट के उत्पादन और बिक्री को दर्शाता है | किस कंपनी की बिक्री का प्रतिशत, उसके उत्पादन के संदर्भ में, सबसे अधिक है ?
View SolutionThe given pie chart shows the quantity wise sales distribution of five products (A, B, C, D and E) of a company in 2016.
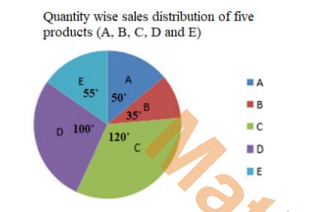 In 2016, if a total of 14616 units were sold, then the number of units of products D sold was:
View SolutionThe given pie chart shows the quantity wise sales distribution of five products (A, B, C. D and E) of a company in 2016.
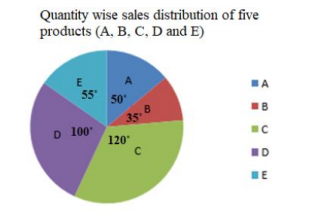 If 320 units of product A were sold by the company, then how many units of products B and E together were sold by the company”?
View SolutionThe given pie chart shows the quantity wise sales distribution of five products (A, B, C, D and E) of a company in 2016.
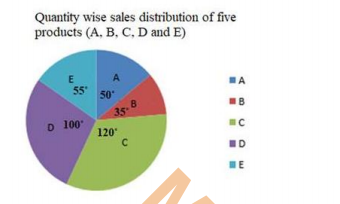 If 1500 units of product D were sold in 2016 and the total number of units sold by the company in 2017 was 18% more than that sold in 2016, then the total units sold by the company in 2017 is:
View SolutionThe given pie chart shows the quantity wise sales distribution of five products (A B C D E) of a company in 2016
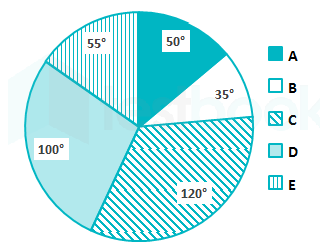
If 1500 units of products D were sold in 2016 and the total number of units sold by the company in 2017 was 18% more than that sold in 2016, then the total units sold by the company in 2017 is:
View SolutionThe given bar chart shows production of steel by companies A , B , C and D for years 2014 ,2015, 2016 In the given pie chart, the average production of steel at C for the year 2014-2016 is:
View SolutionThe given bar chart shows production of steel by companies A , B , C and D for years 2014 ,2015, 2016 In the given pie chart,what is the percentage production of B in 2014 to the total production of 2014.
View Solution
