पांच वित्त वर्षो के दौरान कुल आयत और निर्यात (टन में) का औसत क्या है ?
2279.5
2508.8
2552.4
2325.9
The correct Answer is:B
Step by step video, text & image solution for पांच वित्त वर्षो के दौरान कुल आयत और निर्यात (टन में) का औसत क्या है ? by Maths experts to help you in doubts & scoring excellent marks in Class 14 exams.
Updated on:21/07/2023Topper's Solved these Questions
Similar Questions
यदि A:B=2:3 और B:C=3:7, तो A+B:B+C:C+A क्या होगा?
View SolutionP और Q की वर्तमान आयु के बीच का क्रमशः अनुपात 3 : 4 है। चार वर्ष बाद Q, P से पाँच वर्ष बड़ा होगा।P की वर्तमान आयु कितनी है?
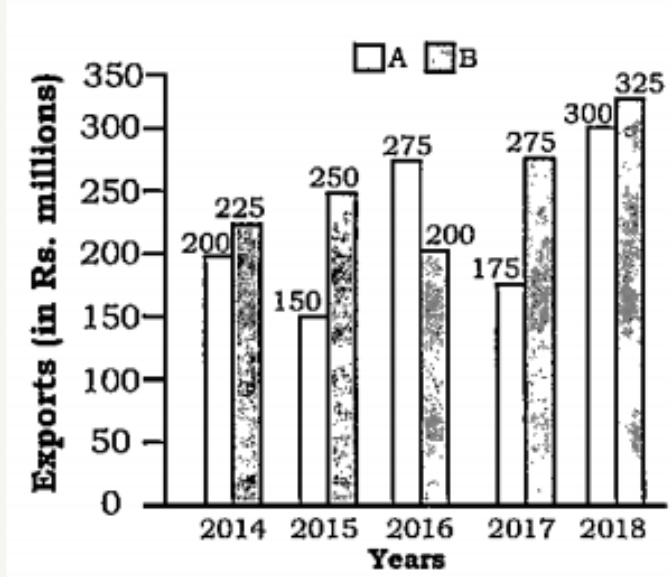
View SolutionThe bar graph shows the exports of Cars of Type A and B (in Rs. million).
दिए गए दंड आरेख में टाइप A और B कारो के निर्यात को दर्शाया गया है (मिलियन रु. में) What is the ratio of the exports of cars of Type A in 2014 and 2018 to the total exports of cars of type B in 2015 and 2016?
2014 और 2018 में टाइप A कारो के कुल निर्यात और 2015 और 2016 में टाइप B कारो के कुल निर्यात का अनुपात क्या हे?
View SolutionIf the breadth and perimeter of a rectangle are in the ratio 1:8 and the area of rectangle is 363 cm^3 , then the breadth of the rectangle is: यदि आयत की चौड़ाई और परिधि 1:8 के अनुपात में है और आयत का क्षेत्रफल 363 cm^3 है, तो आयत की चौड़ाई है
View SolutionThe table shows the production of different types of cars (in thousands). यह तालिका एक कंपनी द्वारा अलग-अलग कारों के उत्पादन (हज़ार में ) को दर्शाती है | The average production of type A cars during the five years is what percent of the total production of type C cars during the five years? पांच वर्षों के दौरान A प्रकार की कारों का औसत उत्पादन पांच वर्षों के दौरान C प्रकार की कारों के कुल उत्पादन का कितना प्रतिशत है ?
View SolutionThe given Bar Graph presents the Imports and Exports of an item (in tonnes) manufactured by a company for the five financial years, 2013-2014 to 2017-2018. दिया गया दंड आरेख पांच वित्तीय वर्षो अर्थत 2013-2014 से 2017-2018 तक एक कंपनी के द्वारा निर्मित किसी वस्तु के आयात और निर्यात ( टन में ) को दर्शाता है | In which financial year the absolute difference between the Exports and the Imports is the highest? किस वित्तीय वर्ष में, निर्यात तथा आयत के बीच पूर्ण अंतर सबसे अधिक है ?
View SolutionThe given Bar Graph presents the Imports and Exports of an item (in tonnes) manufactured by a company for the five financial years, 2013-2014 to 2017-2018. दिया गया दंड आरेख पांच वित्तीय वर्षो अर्थत 2013-2014 से 2017-2018 तक एक कंपनी के द्वारा निर्मित किसी वस्तु के आयात और निर्यात ( टन में ) को दर्शाता है | What is the average of Exports (in tonnes) during the five financial years? पांच वित्तीय वर्षों के दौरान निर्यात (टन ) का औसत कया रहा है ?
View SolutionThe given Bar Graph presents the Imports and Exports of an item (in tonnes) manufactured by a company for the five financial years, 2013-2014 to 2017-2018. दिया गया दंड आरेख पांच वित्तीय वर्षो अर्थत 2013-2014 से 2017-2018 तक एक कंपनी के द्वारा निर्मित किसी वस्तु के आयात और निर्यात ( टन में ) को दर्शाता है | What is the average of total Import and Export (in tonnes) during the five financial year? पांच वित्तीय वर्षों के दौरान कुल आयात एवं निर्यात का औसत ( टन में)क्या है ?
View SolutionThe given Bar Graph presents the Imports and Exports of an item (in tonnes) manufactured by a company for the five financial years, 2013-2014 to 2017-2018. दिया गया दंड आरेख पांच वित्तीय वर्षो अर्थत 2013-2014 से 2017-2018 तक एक कंपनी के द्वारा निर्मित किसी वस्तु के आयात और निर्यात ( टन में ) को दर्शाता है | What is the ratio of total Imports to total Exports during 2014-2015,2015-2016 and 2016-2017? 2014-2015, 2015-2016 और 2016-2017 के दौरान कुल आयात तथा कुल निर्यात के बीच अनुपात ज्ञात करें |
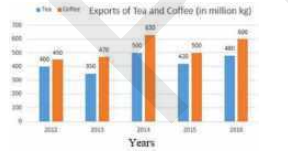
View SolutionThe given Bar Graph presents the Export of Tea and Coffee (in million kg) for the years 2012 to 2016. What is the ratio of total export of tea in 2012, 2014 and 2015 to the total export of coffee in 2013 and 2014?
दिया गया दंड आरेख वर्ष 2012 से 2016 के दौरान चाय और कॉफ़ी के निर्यात ( मिलियन किलो ग्राम में ) को दर्शाता है |
2012, 2014 और 2015 में चाय के कुल निर्यात का 2013 और 2014 में कॉफ़ी के कुल निर्यात के साथ अनुपात ज्ञात करें |
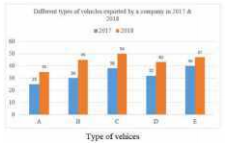
View SolutionThe given Bar Graph presents the number of different types of vehicles exported by a company in 2017 and 2018.The average export of vehicles in 2018 is what percent more than the export of vehicle A in 2017?
दिया गया दंड आरेख एक कंपनी के द्वारा 2017 और 2018 में निर्यात किये गए अलग-अलग प्रकार के वाहनों की संख्या को दर्शाता है |
2018 में वाहनों का औसत निर्यात 2017 में वाहन A के निर्यात से कितना प्रतिशत अधिक है ?
View SolutionThe following bar graph shows the data of the production of an item (in thousand tonnes) from four different companies A, B, C and D during the year mentioned.
निम्नलिखित दंड आरेख में उल्लिखित वर्षों के दौरान चार अलग-अलग कंपनियों A, B, C और D के द्वारा एक वस्तु (हजार टन में) के उत्पादन का आंकड़ा दिखाया गया है। In the five years given, the average production is highest in company _______ and lowest in company _______, respectively.
दिए गए पांच वर्षों में, औसत उत्पादन कंपनी______में सबसे अधिक है और कंपनी________ में सबसे कम है।
View SolutionThe given Bar Graph presents the Imports and Exports of an items (in tonnes) manufactured by a company for the five financial Years, 2013-2014 to 2017-2018. दिया गया दंड आरेख (बार ग्राफ) 5 वित्त वर्षों, 2013-2014 से 2011-2018, के दौरान किसी कंपनी द्वारा निर्मित किसी वस्तु के आयात और निर्यात (टन में) को दर्शाता है| What is the average of Import (in tonnes) during the five financial Years? 5 वित्तीय वर्ष के दौरान आयात का औसत (टन में) क्या है?
View SolutionThe given Bar Graph presents the Imports and Exports of an items (in tonnes) manufactured by a company for the five financial Years, 2013-2014 to 2017-2018. दिया गया दंड आरेख (बार ग्राफ) 5 वित्त वर्षों, 2013-2014 से 2011-2018, के दौरान किसी कंपनी द्वारा निर्मित किसी वस्तु के आयात और निर्यात (टन में) को दर्शाता है| What is the ratio of total Exports to total Imports during the five financial Years? 5 वित्त वर्षों के दौरान कुल निर्यात और कुल आयात का अनुपात क्या है?
View SolutionThe given Bar Graph presents the Imports and Exports of an item (in tonnes) manufactured by a company for the five financial years, 2013-2014 to 2017-2018. दिया गया दंड आरेख (बार ग्राफ) 5 वित्त वर्षों, 2013-2014 से 2011-2018 के दौरान एक कंपनी द्वारा निर्मित किसी वस्तु (टन में) के आयात और निर्यात को दर्शाता है | What is the ratio of total Imports to total Exports during the five financial years? पांचों वित्त वर्षों के दौरान कुल आयात और कुल निर्यात का अनुपात क्या है?
View SolutionThe given Bar Graph presents the Imports and Exports of an item (in tonnes) manufactured by a company for the five financial years, 2013-2014 to 2017-2018. दिया गया दंड आरेख (बार ग्राफ) 5 वित्त वर्षों, 2013-2014 से 2011-2018 के दौरान एक कंपनी द्वारा निर्मित किसी वस्तु (टन में) के आयात और निर्यात को दर्शाता है | In which financial year, total of Exports and Imports is the highest? किस वित्त वर्ष में नियात और आयात का योगफल सर्वाधिक है?
View Solution
