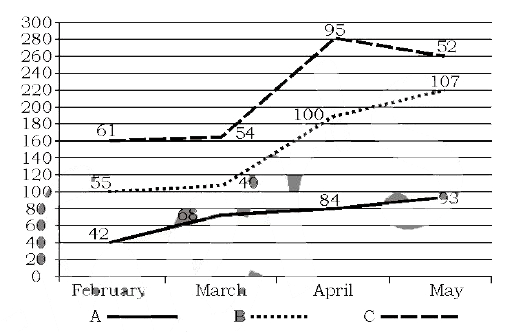
रेखा ग्राफ फरवरी से मई तक तीन घरो A, B और C के लिए बिजली की खपत (इकाइयो में) दिखाता है।

दी गई रेखा ग्राफ में, फरवरी और अप्रैल के महीनो के बीच कुल बिजली की खपत का अंतर है:
97
74
121
15
The correct Answer is:C
Step by step video, text & image solution for रेखा ग्राफ फरवरी से मई तक तीन घरो A, B और C के लिए बिजली की खपत (इकाइयो में) दिखाता है। दी गई रेखा ग्राफ में, फरवरी और अप्रैल के महीनो के बीच कुल बिजली की खपत का अंतर है: by Maths experts to help you in doubts & scoring excellent marks in Class 14 exams.
Updated on:21/07/2023Topper's Solved these Questions
Similar Questions
यदि A:B=2:3 और B:C=3:7, तो A+B:B+C:C+A क्या होगा?
View SolutionP और Q की वर्तमान आयु के बीच का क्रमशः अनुपात 3 : 4 है। चार वर्ष बाद Q, P से पाँच वर्ष बड़ा होगा।P की वर्तमान आयु कितनी है?
View SolutionDetermine the point of symmetry of a regular hexagon.
View SolutionMatch the following Column A to Column B

View SolutionMatch the following Column A to Column B

View SolutionMatch the following Column A to Column B

View SolutionThe inequation represented by the graph given below is :
View Solutionउस सरल रेखा का समीकरण ज्ञात कीजिए जो मूलबिंदु से होकर जाती है और निर्देशाओं के बीच सरल रेखा 3x+y=12 के भाग को 1:2 के अनुपात में विभाजित करती है।
View Solutionएक सरल रेखा बिन्दु (-1,5) से होकर जाती है और रेखा द्वारा अक्षो के बीच काटे हुए भाग को यह बिन्दु 3:2 के अनुपात में विभाजित करता है। रेखा का समीकरण ज्ञात कीजिए|
View Solutionवृत्त की छेदन रेखा PQ है। छेदन रेखा PQ के स्पर्श रेखा बनने का प्रतिबन्ध किखिये।
View Solutionवृत्त की छेदन रेखा PQ है। छेदन रेखा PQ के स्पर्श रेखा बनने का प्रतिबन्ध किखिये।
View SolutionThe monthly incomes of Abhinav and Rekha are in the ratio of 6 : 5, while their monthly expenditures are in the ratio of 9 :8. If the income of Abhinav is twice the expenditure of Rekha, then what is the ratio between the savings of Abhinav and Rekha ?
अभिनव और रेखा की मासिक आय 6:5 के अनुपात में है, जबकि मासिक व्यय 9:8 के अनुपात में है | यदि अभिनव की आय, रेखा के व्यय से दोगुनी है, तब अभिनव और रेखा की बचत का अनुपात है:
View SolutionThe given table represents the number of computers sold by four dealers A,B, C and D during the first six months of 2016. Study the table carefully and answer the questions that follows: दी गयी तालिका चार विक्रेताओं A, B, C और D के द्वारा 2016 के पहले छः महीनों में बेचे गए कंप्यूटरों की संख्या दर्शाती है | इस तालिका का ध्यानपूर्वक अध्ययन करें तथा पूछे गए प्रश्नों का उत्तर दें | What is the ratio of the total number of computers sold by dealer A in February, April and May to the total number of computers sold by dealer D in March, May and June? / विक्रेता A के द्वारा फरवरी, अप्रैल और मई में बेचे गए कंप्यूटरों की कुल संख्या तथा विक्रेता D के द्वारा मार्च, मई और जून में बेचे गए कंप्यूटरों की कुल संख्या के बीच क्या अनुपात है ?
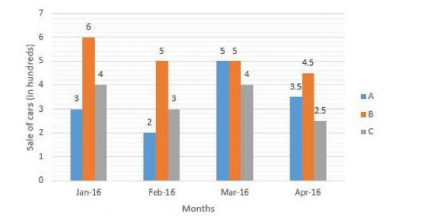
View SolutionThe given bar graph presents the sale of a particular brand of car by three showrooms, A, B and C( in multiples of 100) during the months of Jan, Feb, Mar and Apr, 2016
दिया गया दंड आरेख (बार ग्राफ) तीन शो-रूम- A, B और C के द्वारा जनवरी, फरवरी, मार्च और अप्रैल, 2016 के दौरान कार के एक खास ब्रांड की (100 के गुणक में) बिक्री को दर्शाता है| What is the ratio of the number of cars sold by A in Jan-Feb, 2016 to that of cars sold by B during Mar-Apr, 2016?
जनवरी-फरवरी, 2016 में A के द्वारा और मार्च-अप्रैल, 2016 के दौरान B के द्वारा बेची गई कारों की संख्या का अनुपात क्या है?
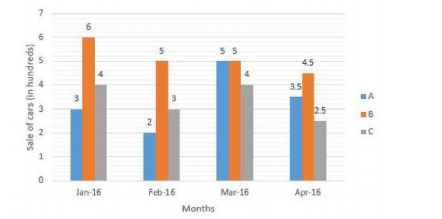
View SolutionThe given bar graph presents the sale of a particular brand of car by three showrooms, A, B and C( in multiples of 100) during the months of Jan, Feb, Mar and Apr, 2016
दिया गया दंड आरेख (बार ग्राफ) तीन शो-रूम- A, B और C के द्वारा जनवरी, फरवरी, मार्च और अप्रैल, 2016 के दौरान कार के एक खास ब्रांड की (100 के गुणक में) बिक्री को दर्शाता है| What was the average number of cars sold by A during Feb-Apr, 2016?
फरवरी-अप्रैल 2016 के दौरान, A के दवारा बेची गई कारों की औसत संख्या क्या थी?
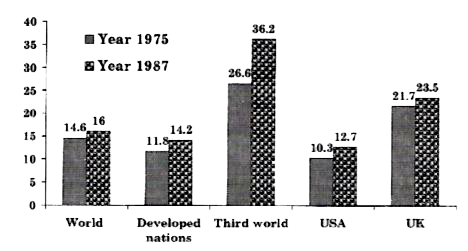
View SolutionStudy the following Bar graph and answer the question. The Bar graph gives the annual rates of inflation in percentages for 1975 and 1987:
निम्नलिखित बार-ग्राफ का अध्ययन करें और प्रश्नों का उत्तर दें। बार-ग्राफ में वर्ष 1975 से 1987 तक प्रतिशत में मुद्रा स्फीति की वार्षिक दर प्रतिशत में दी गई है :

The change in rate of inflation was least in which of the following.
मुद्रास्फीति के परिवर्तन की निम्नतम दर इन में से कहाँ थी?
View Solution
