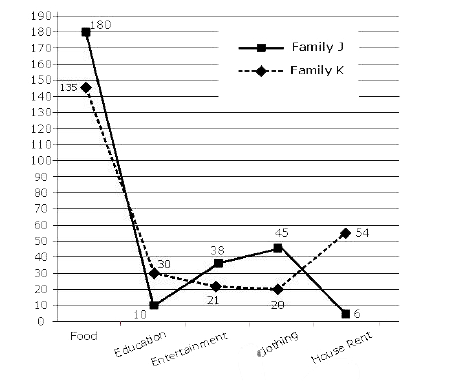
नीचे दिए गया ग्राफ दो परिवारों के मासिक व्यय (सेकड़ो में) को दर्शाता है:

दिए गए ग्राफ में, यदि परिवार K की मासिक आय Rs 37,200 में की वृद्धि होती है, तो मनोरंजन पर व्यय में कितनी वृद्धि होगी ? (यह मानते हुए की वे पहले के अनुपात में ही व्यय करेंगे), एक दशमलव में पूर्णांकित करें ?
43.8
51.9
50.7
46.2
The correct Answer is:C
Topper's Solved these Questions
Similar Questions
यदि A:B=2:3 और B:C=3:7, तो A+B:B+C:C+A क्या होगा?
View SolutionP और Q की वर्तमान आयु के बीच का क्रमशः अनुपात 3 : 4 है। चार वर्ष बाद Q, P से पाँच वर्ष बड़ा होगा।P की वर्तमान आयु कितनी है?
View Solutionयदि 10 संख्याओं के आंकड़ों को आरोही क्रम में रखा जाए और 7वें प्रेक्षेण में 4 की वृद्धि का जाए तो बताइए कि माध्यिका में कितनी वृद्धि होगी?
View Solution"बेटी की आँखें मंदिर में दीवट पर जलते घी के दो दिए है" में कौन-सा अलंकार है?
View SolutionIncomes of A and B are in the ratio of 5 : 3 and their expenditures are in the ratio of 9 : 5. If the income of B is equal to the expenditure of A, then what is the ratio of the savings of A and B?
View SolutionThe monthly incomes of Abhinav and Rekha are in the ratio of 6 : 5, while their monthly expenditures are in the ratio of 9 :8. If the income of Abhinav is twice the expenditure of Rekha, then what is the ratio between the savings of Abhinav and Rekha ?
अभिनव और रेखा की मासिक आय 6:5 के अनुपात में है, जबकि मासिक व्यय 9:8 के अनुपात में है | यदि अभिनव की आय, रेखा के व्यय से दोगुनी है, तब अभिनव और रेखा की बचत का अनुपात है:
View SolutionThe ratio of incomes of A and B is 3:8 and the ratio of their savings is 9:25. If the income of A equals the expenditure of B, then the ratio of expenditures of A and B is:
A और B की आय में 3 : 8 का अनुपात है तथा उनकी बचत में 9 :25 का अनुपात है | यदि A की आय B के व्यय के बराबर है, तो A और B के व्यय में क्या अनुपात है ?
View SolutionThe income of Raju is 20% more than his expenditure. If his income increases by 60% and his expenditure increases by 70% then by what percent does his savings increase or decrease?
राजू की आय उसके व्यय से 20% अधिक है | यदि उसकी आय 60% बढ़ जाती है और उसके व्यय में 70% की वृद्धि हो जाती है, तो उसकी बचत में कितने प्रतिशत की कमी या वृद्धि होगी ?
View SolutionA man spends 75% of his income. If his income increases by 28% and his expenditure increases by 20%, then what is the increase or decrease percentage in his saving ?
एक आदमी अपनी आय का 75% खर्च करता है। यदि उसकी आय में 28% की वृद्धि होती है और उसके व्यय में 20% की वृद्धि होती है, तो उसकी बचत में वृद्धि या कमी का प्रतिशत कया है?
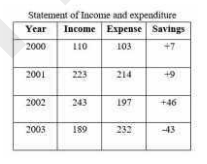
View SolutionThe table shows Income and expenditure of a person for 3 years (in thousands)
यह तालिका 3 वर्षों के दौरान किसी व्यक्ति के आय एवं व्यय (हज़ार में ) को दर्शाती है | In the given table, if a person reduced his expenditure by 10% by how much would his total
savings increased?
दी गयी तालिका के अनुसार यदि व्यक्ति अपने व्यय में 10% की कमी कर ले, तो उसकी बचत में कुल कितनी वृद्धि होगी ?
View SolutionThe given Bar Graph presents Income and Expenditure (in crores of Rupees) of a company for the five years, 2014 to 2018. दिया गया दंड आरेख पांच वर्षों अर्थात 2014 से 2018 तक एक कंपनी के आय एवं व्यय ( करोड़ रुपये में ) को दर्शाता है | In which year is the Expenditure more than 40% as compared to the Expenditure in the previous year? किस वर्ष में व्यय पिछले वर्ष के व्यय की तुलना में 40% अधिक है ?
View SolutionThe graph below shows two families. monthly expenditure (in hundreds) नीचे दिया गया ग्राफ दो परिवारों के मासिक व्यय (सेकेंड में) को दर्शाता है In the given graph, what is the ratio of the difference between food and education for families J and K ? दिए गए ग्राफ में, परिवार J और K के लिए भोजन तथा शिक्षा के बीच के व्यय में अंतर का अनुपात क्या है ?
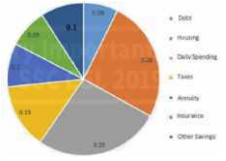
View SolutionThe Pie-chart given below shows the figures of various heads of expenditure incurred by Anurag in a year. In how many heads is his expenditure less than the expenditure he incurred on tax?
नीचे दिया गया वृत्त आरेख अनुराग द्वारा किसी वर्ष में किए गए व्यय के विभिन्न शीर्षों के आंकड़ों को दर्शाता है | उसके द्वारा टैक्स पर किए गए व्यय की तुलना में कितने शीर्षों में उसके व्यय कम हैं ?
View SolutionThe given Bar Graph presents Income and Expenditure (in crores of Rupees) of a company for five years, 2014 to 2018. In which year is the Expenditure more than 40% as compared to the Expenditure in the previous year? दिया गया दंड आरेख (बार ग्राफ) 5 वर्षो, 2014 से 2018 के दौरान किसी कंपनी की आय और व्यय (करोड़ रुपए में) को दर्शाता है| पिछले वर्ष के व्यय की तुलना में किस वर्ष में वह 40% अधिक है?
View SolutionThe given Bar Graph presents Income and Expenditure (in crores of Rupees) of a company for five years, 2014 to 2018. What is the ratio of total Expenditure to total Income of the company in 2014,2016 and 2017? दिया गया दंड आरेख (बार ग्राफ) 5 वर्षों, 2014 से 2018 के दौरान किसी कंपनी की आय और व्यय (करोड़ रुपए में) को दर्शाता है| 2014, 2016 और 2017 में कंपनी के कुल व्यय और कुल आय का अनुपात क्या है?
View SolutionThe ratio of monthly incomes of A, B is 6:5 and their monthly expenditures are in the ratio 4:3. If each of the saves 400 per months, find the sum of their monthly incomes. A एवं B की मासिक आय का अनुपात 6:5 है और उनका मासिक व्यय 4:3 के अनुपात में है। यदि प्रत्येक प्रति माह 400 की बचत करता है तो उनकी मासिक आय की राशि ज्ञात कीजिए।
View Solution
