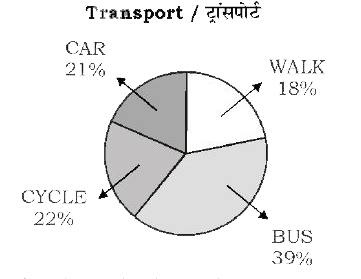
दिए गए पाई-चार्ट में परिवहन के विभिन्न तरीको का उपयोग करके स्कूल आने वाले छात्रों के प्रतिशत की दर्शाया गया है। छात्रों की कुल संख्या= 1300

दिए गए पाई-चार्ट में, कार और बस से आने वाले छात्रों और पैदल और साइकिल से आने के बीच का प्रतिशत अंतर है ?
15%
25%
20%
30%
The correct Answer is:C
Step by step video, text & image solution for दिए गए पाई-चार्ट में परिवहन के विभिन्न तरीको का उपयोग करके स्कूल आने वाले छात्रों के प्रतिशत की दर्शाया गया है। छात्रों की कुल संख्या= 1300 दिए गए पाई-चार्ट में, कार और बस से आने वाले छात्रों और पैदल और साइकिल से आने के बीच का प्रतिशत अंतर है ? by Maths experts to help you in doubts & scoring excellent marks in Class 14 exams.
Topper's Solved these Questions
Similar Questions
यदि A:B=2:3 और B:C=3:7, तो A+B:B+C:C+A क्या होगा?
06:14View SolutionP और Q की वर्तमान आयु के बीच का क्रमशः अनुपात 3 : 4 है। चार वर्ष बाद Q, P से पाँच वर्ष बड़ा होगा।P की वर्तमान आयु कितनी है?
04:15View Solutionयह ज्ञात है की महाविद्यालय के छात्रों में से 60 % छात्रावास में रहते है और 40 % छात्रावास में नहीं रहते है । पूर्ववर्ती वर्ष से परिणाम सूचित करते है की छात्रावास में रहने वाले छात्रों में से30 % छात्रों में से 20 % छात्रों ने A ग्रेड लिए। वर्ष के अंत में महाविद्यालय के एक छात्र को यादृच्छया चुना गया और पाया गया की उसे A ग्रेड मिला है । इस बात की क्या प्रायिकता है की वह छात्रावास में रहने वाला है ?
02:34View Solutionदो कक्षाओं की एक ही तरह की परीक्षा ली गई। 120 छात्रों की पहली कक्षा के छात्रों के प्राप्तांकों का माध्य 80% और तीस छात्रों की दूसरी कक्षा के छात्रों के प्राप्तांकों का माध्य 70% आया। दोनों कक्षाओं के सभी छात्रों के प्रतिशत प्राप्तांकों का माध्य होगा
02:56View SolutionStudy the pie-chart and answer the questions: Break up (degree wise) of students in terms of specialization in different areas(A, B, C, D & E) in an MBA program. The total number of students specialising in A and B exceeds the total number of students specialising in C and D by x, which lies between: पाई-चार्ट का अध्ययन करें और प्रश्नों के उत्तर दें: एमबीए प्रोग्राम में विभिन्न क्षेत्रों (ए, बी, सी, डी एंड ई) में विशेषज्ञता के मामले में छात्रों का ब्रेक अप (डिग्री वार)। ए और बी में विशेषज्ञता वाले छात्रों की कुल संख्या सी और डी में विशेषज्ञता वाले छात्रों की कुल संख्या से अधिक है।
03:58View SolutionStudy the pie-chart and answer the questions: Break up (degree wise) of students in terms of specialization in different areas(A, B, C, D & E) in an MBA program. The number of students specialising in E is what percent more than that of students specialising in C? पाई-चार्ट का अध्ययन करें और प्रश्नों के उत्तर दें: एमबीए प्रोग्राम में विभिन्न क्षेत्रों (ए, बी, सी, डी एंड ई) में विशेषज्ञता के मामले में छात्रों का ब्रेक अप (डिग्री वार)। E में विशेषज्ञता प्राप्त छात्रों की संख्या C में विशेषज्ञता वाले छात्रों से कितने प्रतिशत अधिक है?
03:07View SolutionThe following table shows the number of students of 7 college participating in extra curricular activities: निम्न सारणी उन कॉलेजों के छात्रों की संख्या दर्शाती है, जो पाठ्येत्तर क्रियाकलापों में भाग लेते हैं। Read the table and answer the following question. तालिका पढ़ें और निम्नलिखित प्रश्नों के उत्तर दें। Percentage of the number of students in activity II to that of IV is क्रियाकलाप II में छात्रों की संख्या का क्रियाकलाप IV में छात्रों की संख्या के साथ प्रतिशत है-
03:52View SolutionThe total number of students in section A and B of a class is 110. The number of students in section A is 10 more than that of section B. The average score of the students in B, in a test, is 20% more than that of students in A. If the average score of all the students in the class is 72, then what is the average score of the students in A?
किसी कक्षा के खंड A और खंड B के छात्रों की कुल संख्या 110 है | खंड A में छात्रों की संख्या खंड 9 के छात्रों की संख्या से 10 अधिक है| किसी परीक्षा में B के छात्रों का औसत प्राप्तंक A के छात्रों के औसत प्राप्तंक से 20% अधिक है | यदि सभी छात्रों का औसत प्राप्तांक 72 है, तो A के छात्रों का औसत प्राप्तांक ज्ञात करें |02:03View SolutionThe number of students in classes A and B are 60 and 70, respectively. The average score in mathematics of students in B is 57 and that of all students in A and B is 63. What is the average score of students in A?
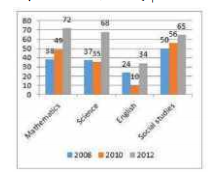
कक्षा A और B में छात्रों की संख्या क्रमश: 60 और 10 है | B में गणित में छात्रों का औसत अंक 57 तथा A और B के सभी छात्रों का गणित में औसत अंक 63 है |A के छात्रों का औसत अंक ज्ञात करें |02:20View SolutionThe given bar graph shows the number of marks scored by a student in each subject in three years.
दिया गया दंड आरेख एक छात्र के द्वारा तीन वर्षो में प्रत्येक विषय में लाये गए अंकों को दर्शाता है | In the given chart, the number of marks in social studies in 2012 is 13% of the school strength. The number of students is:
दिए गए चार्ट में, यदि वर्ष 2012 में सामाजिक अध्ययन में अंकों की संख्या स्कूल की के छात्रों की संख्या का 13% है। छात्रों की संख्या कितनी है?01:48View SolutionThis table shows the number of students studying in various streams in different colleges. निम्नलिखित तालिका पांच कॉलेजों के तीन विषयों में पढ़ने वाले छात्रों की संख्या दर्शाती है | The number of students in the science stream of college C is approximately what percentage of students studying in that college? कॉलेज C में विज्ञान विषय में छात्रों की संख्या उस कॉलेज में पढ़ने वाले छात्रों की संख्या का लगभग कितना प्रतिशत है ?
01:38View SolutionIn the given bar graph, the percentage decrease in the number of students in Institute A in 2016 is what percent of students in 2015. इस दंड आरेख में संस्थान A में 2016 में छात्रों की संख्या में प्रतिशत कमी 2015 के छात्रों की संख्या का क्या प्रतिशत है ?
01:52View SolutionThe given pie-chart depicts the percentage of students coming to school using different modes of transport. Total number of students=1300 दिया गया पाई चार्ट परिवहन के विभिन्न साधनों का प्रयोग करके विद्यालय आने वाले छात्रों का प्रतिशत दर्शाता है | छात्रों की कुल संख्या =1300 In the given pie-chart, if 234 students used to walk, then how many come by bus ? / दिए गए पाई-चार्ट में, यदि 234 छात्र चलकर आते हैं, तो कितने छात्र बस से आते हैं?
01:15View SolutionThe given pie-chart depicts the percentage of students coming to school using different modes of transport. Total number of students=1300 दिया गया पाई चार्ट परिवहन के विभिन्न साधनों का प्रयोग करके विद्यालय आने वाले छात्रों का प्रतिशत दर्शाता है | छात्रों की कुल संख्या =1300 In the given pie-chart, the difference between the number of students travel by bus or walk to the number of students travel by car or cycle, इस पाई चार्ट के अनुसार बस सेया पैदल यात्रा करने वाले छात्रों की संख्या एवं कार अथवा साइकिल से यात्रा करने वाले छात्रों की संख्या में क्या अंतर है ?
01:48View SolutionThe given pie-chart, shows the percentage distribution of the expenditure incurred in publishing a book. Study the pie-chart and the answer the question based on it. / दिया गया पाई चार्ट किसी पुस्तक के प्रकाशन में हुए व्ययों के प्रतिशत वितरण को दर्शाता है | इस पाई चार्ट का अध्ययन करें तथा इस पर आधारित प्रश्न का उत्तर दें | In the given pie-chart, by what percentage the Royalty on the book is less than the Printing cost? / दिए गए पाई चार्ट के अनुसार, इस पुस्तक पर रॉयल्टी प्रकाशन की लागत से कितना प्रतिशत कम है ?
04:06View SolutionThe given pie chart shows the expenditure given in millions on each game. दिया गया पाई चार्ट प्रत्येक खेल पर करोड़ो में दिए गए व्यय को दर्शाता है | In the given pie chart, what is the difference between expenditure on cricket and football ? दिए गए पाई चार्ट में , क्रिकेट और फुटबॉल पर किये गए व्यय के बीच क्या अंतर है ?
02:32View Solution

