The following line diagram represents the yearly sales figure of a company in the years 2001-2010. Examine the diagram and answer the question.
निम्नलिखित रेखा आरेख किसी कंपनी की वर्ष 2007-2010 के दौरान वार्षिक बिक्री के आंकड़ों को दर्शाता है। आरेख का अध्ययन करें और नीचे दिए गए प्रश्नों के उत्तर दें-
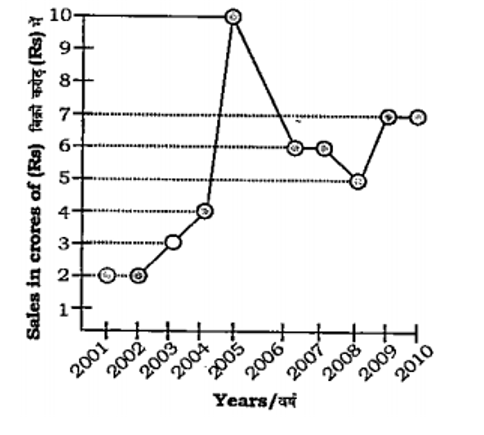 The percentage increase in sales in the year 2005 with respect to the previous year is
वर्ष 2005 में पिछले वर्ष की तुलना में बिक्री में वृद्धि का प्रतिशत है-
80
100
120
150
Step by step video & image solution for The following line diagram represents the yearly sales figure of a company in the years 2001-2010. Examine the diagram and answer the question. निम्नलिखित रेखा आरेख किसी कंपनी की वर्ष 2007-2010 के दौरान वार्षिक बिक्री के आंकड़ों को दर्शाता है। आरेख का अध्ययन करें और नीचे दिए गए प्रश्नों के उत्तर दें- The percentage increase in sales in the year 2005 with respect to the previous year is वर्ष 2005 में पिछले वर्ष की तुलना में बिक्री में वृद्धि का प्रतिशत है- by Maths experts to help you in doubts & scoring excellent marks in Class 14 exams.
Updated on:21/07/2023Topper's Solved these Questions
Similar Questions
Each question has four options(A), (B), (C) and (D) for answers. Select the right answer and write in English letters in the box against each question in the enclosed answer sheet.
A General, while arranging his men, who were 6000 in number, in the form of a square, found that there were 71 men left over. How many were arranged in each row?
View SolutionThere are 200 questions in a 3 h examination. Among 200 questions, 50 are from Mathematics, 100 are from GK and 50 are from Science. Ram spent twice as much time on each Mathematics question as for each other question. How many minutes did he spend on Mathematics questions ?
View SolutionThe following line diagram represents the yearly sales figure of a company in the years 2001-2010. Examine the diagram and answer the question. निम्नलिखित रेखा आरेख किसी कंपनी की वर्ष 2007-2010 के दौरान वार्षिक बिक्री के आंकड़ों को दर्शाता है। आरेख का अध्ययन करें और नीचे दिए गए प्रश्नों के उत्तर दें- By what percent did the sales in 2008 decrease in comparison to the sales in 2006? वर्ष 2006 में बिक्री की तुलना में वर्ष 2008 में बिक्रो में कितने प्रतिशत की कमी आई?
View SolutionThe following line diagram represents the yearly sales figure of a company in the years 2001-2010. Examine the diagram and answer the question. निम्नलिखित रेखा आरेख किसी कंपनी की वर्ष 2007-2010 के दौरान वार्षिक बिक्री के आंकड़ों को दर्शाता है। आरेख का अध्ययन करें और नीचे दिए गए प्रश्नों के उत्तर दें- The ratio of sales in 2002 to that in 2007 is वर्ष 2002 में बिक्री का वर्ष 2007 में बिक्री के साथ अनुपात है-
View SolutionThe following line diagram represents the yearly sales figure of a company in the years 2001-2010. Examine the diagram and answer the question. निम्नलिखित रेखा आरेख किसी कंपनी की वर्ष 2007-2010 के दौरान वार्षिक बिक्री के आंकड़ों को दर्शाता है। आरेख का अध्ययन करें और नीचे दिए गए प्रश्नों के उत्तर दें- Average sale (in crore of Rs.) of the company during the period 2003-2007 is वर्ष 2003 - 2007 की अवधि के दौरान कंपनी की औसत बिक्री (₹ करोड में) है-
View SolutionThe following line diagram represents the yearly sales figure of a company in the years 2001-2010. Examine the diagram and answer the question. निम्नलिखित रेखा आरेख किसी कंपनी की वर्ष 2007-2010 के दौरान वार्षिक बिक्री के आंकड़ों को दर्शाता है। आरेख का अध्ययन करें और नीचे दिए गए प्रश्नों के उत्तर दें- ............................................................................................................................................. Total sales (in crore of Rs.) from 2005 to 2008 is वर्ष 2005 से वर्ष 2008 तक कुल बिक्री (रु. करोड में) है-
View SolutionThe bar graph given below shows the profit (in multiples of thousand rupees) of a company during the year 2010-2018. The average profit for the year 2015-2017 is what percentage more than the 2012 profit? नीचे दिए गए दंड आरेख में वर्ष 2010-2018 के दौरान किसी कंपनी के लाभ (हजार रुपए के गुणक में) को दर्शाया गया है | वर्ष 2015-2017 का औसत लाभ 2012 के लाभ से कितना प्रतिशत अधिक है ?
View SolutionThe following graph shows the sales of cars (in thousands) in four cities in 4 years. Study the graph and answer the questions.
निम्नलिखित आरेख 4 वर्षों में चार शहरों में कारों की बिक्री (हज़ार में) को दर्शाता है। इस आरेख का अध्ययन कीजिए तथा प्रश्नों के उत्तर दीजिए। In which year, the sales are highest?
किस वर्ष, बिक्री सबसे अधिक हुई है?
View SolutionThe following graph shows the sales of cars (in thousands) in four cities in 4 years. Study the graph and answer the questions.
निम्नलिखित आरेख 4 वर्षों में चार शहरों में कारों की बिक्री (हज़ार में) को दर्शाता है। इस आरेख का अध्ययन कीजिए तथा प्रश्नों के उत्तर दीजिए। Which city has the highest percentage of sales, and in which year?
किस शहर की बिक्री का प्रतिशत सबसे अधिक है तथा किस वर्ष में?
View SolutionIn the given bar graph, the Blue bar shows the income and the Red bar shows the expenditure of a company. Study the graph and answer the question that follows
दिए गए दंड आरेख में, नीला दंड एक कंपनी की आय दिखाता है और लाल दंड खर्च (लाख रुपये में) को दर्शाता है। आरेख का अध्ययन करें और उस प्रश्न का उत्तर दें जो नीचे पूछा गया है। The income in 2001 was equal to the expenditure in the year:
2001 में आय किस वर्ष के व्यय के बराबर है :
View Solutionनिम्नलिखित रेखा आरेख किसी कंपनी की वर्ष 2001-2010 के दौरान वार्षिक बिक्री के आंकड़ों को दर्शाता है। आरेख का अध्ययन करें और 5 से 9 तक प्रश्न के उत्तर दें।
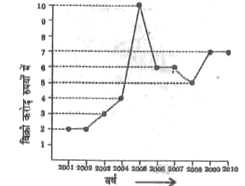
वर्ष 2006 में बिक्री की तुलना में वर्ष 2008 में बिक्री में कितने प्रतिशत की कमी आई?
View Solutionनिम्नलिखित रेखा आरेख किसी कंपनी की वर्ष 2001-2010 के दौरान वार्षिक बिक्री के आंकड़ों को दर्शाता है। आरेख का अध्ययन करें और 5 से 9 तक प्रश्न के उत्तर दें।
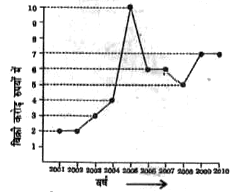
वर्ष 2002 में बिक्री का वर्ष 2007 में बिक्री के साथ अनुपात है
View Solutionनिम्नलिखित रेखा आरेख किसी कंपनी की वर्ष 2001-2010 के दौरान वार्षिक बिक्री के आंकड़ों को दर्शाता है। आरेख का अध्ययन करें और 5 से 9 तक प्रश्न के उत्तर दें।
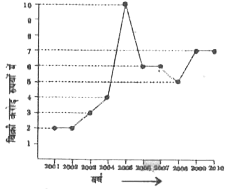
वर्ष 2003-2007 की अवधि के दौरान कम्पनी की औसत बिक्री (Rs. करोड़ में) है
View Solutionनिम्नलिखित रेखा आरेख किसी कंपनी की वर्ष 2001-2010 के दौरान वार्षिक बिक्री के आंकड़ों को दर्शाता है। आरेख का अध्ययन करें और 5 से 9 तक प्रश्न के उत्तर दें।
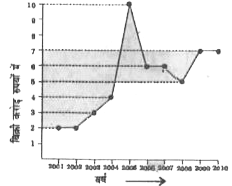
वर्ष 2005 में पिछले वर्ष की तुलना में बिक्री में वृद्धि का प्रतिशत है
View SolutionThe following line diagram shows the annual sales figures of a company during the year 2001-2010. Study the diagram and answer questions 5 to 9. What is the percentage decrease in the sales in the year 2008 as compared to the sales in the year 2006?
View Solution
