निम्न ग्राफ का अध्ययन करे और उसके बाद दिए गए प्रश्न का उत्तर दे।
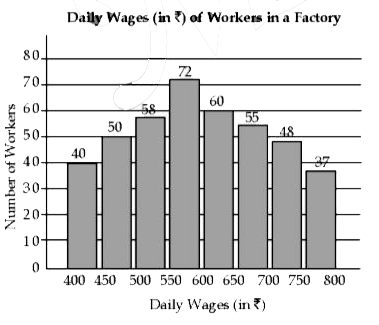 2015 और 2016 में कम्पनी के कुल व्यय और 2016 और 2018 में कम्पनी के कुल आय का अनुपात ज्ञात कीजिये ?
4:5
19:20
6:7
11:20
The correct Answer is:A
Topper's Solved these Questions
Similar Questions
यदि A:B=2:3 और B:C=3:7, तो A+B:B+C:C+A क्या होगा?
View SolutionP और Q की वर्तमान आयु के बीच का क्रमशः अनुपात 3 : 4 है। चार वर्ष बाद Q, P से पाँच वर्ष बड़ा होगा।P की वर्तमान आयु कितनी है?
View SolutionMatch the following Column A to Column B

View SolutionStudy the given graph and answer the question that follows.
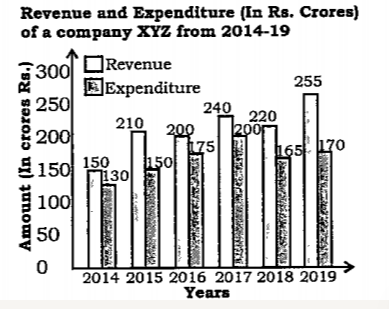
The total revenue in 2015 and 2017 is what per cent of the total expenditure of the company in 2016,2018 and 2019 ( correct to one decimal place)?
दिए गए ग्राफ का अध्ययन करें और नीचे दिए गए प्रश्न का उत्तर दें। 2015 और 2017 2 कुल आय (revenue), 2016, 2018 और 2019 में कंपनी के कुल व्यय (Expenditure) की कितनी प्रतिशत है (दशमलव के बाद एक
स्थान तक गणना करें?
View SolutionStudy the given graph and answer the question that follows. Production and Exports of Computers(In Thousands)by company XYZ in six years The total production of computers in 2013, 2015 and 2018 is x% of the total exports of computers by the company during the six years. The value of x is: दिए गए ग्राफ का अध्ययन करें और इस प्रश्न का उत्तर दें। 2013, 2015 और 2018 छह वर्षों के दौरान कंपनी द्वारा कंप्यूटरों के कुल निर्यात का x% है। X का मान है
View SolutionThe bar graph shows the exports of Cars of Type A and B (in Rs. million).
दिए गए दंड आरेख में टाइप A और B कारो के निर्यात को दर्शाया गया है (मिलियन रु. में)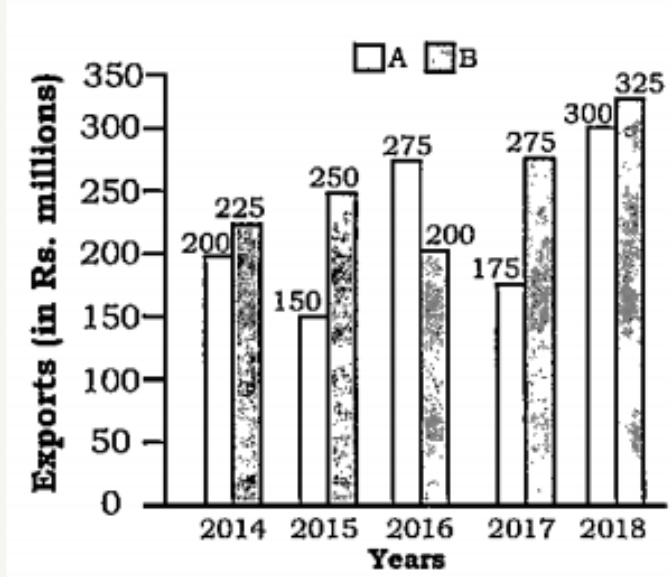 What is the ratio of the exports of cars of Type A in 2014 and 2018 to the total exports of cars of type B in 2015 and 2016?
2014 और 2018 में टाइप A कारो के कुल निर्यात और 2015 और 2016 में टाइप B कारो के कुल निर्यात का अनुपात क्या हे?
View SolutionThe ratio of the income of A to that of B is 5:7. A and B save Rs. 4000 and Rs. 5000 respectively. If the expenditure of A is equal to 6623% of the expenditure of B, then the total income of A and B is :
A की आय और B की आय में 5 : 7 का अनुपात है | A और B महीने में क्रमश 4000 और 5000 रुपये की बचत करते हैं | यदि A का व्यय B के व्यय के 6623% के बराबर है, तो A और B की कुल आय ज्ञात करें |
View SolutionIncomes of A and B are in the ratio of 5 : 3 and their expenditures are in the ratio of 9 : 5. If the income of B is equal to the expenditure of A, then what is the ratio of the savings of A and B?
View SolutionStudy the following bar graph and answer the question given.
निम्नलिखित दंड आरेख का अध्ययन करें तथा दिए गए प्रश्न का उत्तर दें |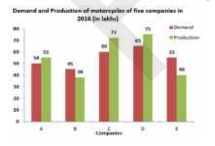 The ratio of the total demand of motorcycles of companies A, C and E to the total production of
motorcycles of B and C is:
कंपनी A, C और E की मोटरसाइकिल की कुल मांग और B तथा C की मोटरसाइकिल के कुल उत्पादन के बीच अनुपात ज्ञात करें
View SolutionThe given Bar Graph presents Income and Expenditure (in crores of Rupees) of a company for the five years, 2014 to 2018. दिया गया दंड आरेख पांच वर्षों अर्थात 2014 से 2018 तक एक कंपनी के आय एवं व्यय ( करोड़ रुपये में ) को दर्शाता है | What is the ratio of total Expenditure to total Income of the company in 2014, 2016 and 2017? 2014, 2016 और 2017 में कंपनी के कुल व्यय और कुल आय में क्या अनुपात है ?
View SolutionThe given Bar Graph presents the Export of Tea and Coffee (in million kg) for the years 2012 to 2016. What is the ratio of total export of tea in 2012, 2014 and 2015 to the total export of coffee in 2013 and 2014?
दिया गया दंड आरेख वर्ष 2012 से 2016 के दौरान चाय और कॉफ़ी के निर्यात ( मिलियन किलो ग्राम में ) को दर्शाता है |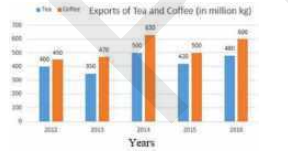
2012, 2014 और 2015 में चाय के कुल निर्यात का 2013 और 2014 में कॉफ़ी के कुल निर्यात के साथ अनुपात ज्ञात करें |
View SolutionThe given table represents the number of engineers recruited by four companies A,B,C and D over the years. Study the table carefully and answer the questions that follows: The ratio of the total number of engineers recruited by companies A and B in 2015 and 2018 to the total number of engineers recruited by C and D in 2014 and 2018 is: दी गयी तालिका चार कंपनियों A, B, C और D के द्वारा इन वर्षों के दौरान भर्ती किये गए इंजीनियरों की संख्या दर्शाती है | इस तालिका का ध्यानपूर्वक अध्ययन करें तथा इसके बाद पूछे गए प्रश्न का उत्तर दें | कंपनी A और B के द्वारा 2015 और 2018 में भर्ती किये गए इंजीनियरों की कुल संख्या एवं C तथा D के द्वारा 2014 और 2018 में भर्ती किये गए इंजीनियरों की कुल संख्या के बीच अनुपात ज्ञात करें |
View SolutionThe given graph represents the percentage distribution of the total expenditure of a company. Study the graph and answer the question that follows.
दिया गया आरेख एक कंपनी के कुल व्यय के प्रतिशत वितरण को दर्शाता है। आरेख का अध्ययन कीजिए और फिर पूछे गए प्रश्न का उत्तर दीजिए।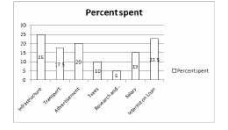 What is the ratio of the total expenditure on .Infrastructure. and .Transport. to the total expenditure on .Taxes. and .Interest on Loans.?
‘आधारभूत संरचना’(Infrastructure) तथा “परिवहन. (Transport) पर किये गए कुल व्यय और “करों (Taxes) तथा “ऋण पर ब्याज.(Interest on loans) पर किये गए कुल व्यय के बीच अनुपात ज्ञात कीजिए।
View SolutionStudy the given graph and answer the questions that follow.
दिए गए आरेख का अध्ययन करें और उन सवालों के जवाब दें, जो अनुसरण करते हैं।
The total revenue in 2015 and 2017 is what percent of the total expenditure of the company in 2016, 2018 and 2019 (correct to one decimal place) ?
2015 और 2017 में कुल राजस्व 2016, 2018 और 2019 में कंपनी के कुल व्यय का कितना प्रतिशत है (एक दशमलव स्थान तक )?
View SolutionThe given Bar Graph presents Income and Expenditure (in crores of Rupees) of a company for five years, 2014 to 2018. What is the ratio of total Expenditure to total Income of the company in 2014,2016 and 2017? दिया गया दंड आरेख (बार ग्राफ) 5 वर्षों, 2014 से 2018 के दौरान किसी कंपनी की आय और व्यय (करोड़ रुपए में) को दर्शाता है| 2014, 2016 और 2017 में कंपनी के कुल व्यय और कुल आय का अनुपात क्या है?
View SolutionThe given Bar Graph present the Imports and Exports of an item (in tonnes) manufactured by a company for the five financial years, 2013-2014 to 2017-2018. दिया गया दंड आरेख (बार ग्राफ) पांच वित्त वर्षों, 2013-2014 से 2017-2018, के दौरान किसी कंपनी दवारा निर्यात किसी वस्तु (टन में] के आयात और निर्यात को दर्शाता है| What is the ratio of total Imports to total Exports during 2014- 2015, 2015- 2016 and 2016- 2017? वर्ष 2014-2015, 2015-2016 33 2016-2011 के दौरान, कुल आयात और निर्यातों का अनुपात कितना है?
View Solution
