Identify correct graph between PV and T for an ideal gas of given number of moles:
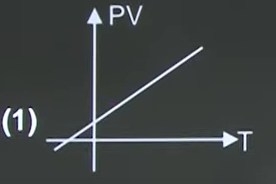
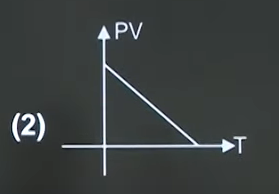
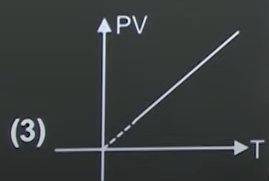
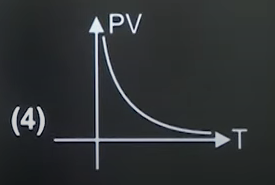
To solve the problem of identifying the correct graph between PV and T for an ideal gas with a fixed number of moles, we can follow these steps:
Step 1: Understand the Ideal Gas Law
The ideal gas law is given by the equation:
PV=nRT
where:
- P = pressure,
- V = volume,
- n = number of moles (constant in this case),
- R = universal gas constant (constant),
- T = temperature.
Step 2: Analyze the Equation
Since n and R are constants, we can rewrite the equation as:
PV=kT
where k=nR is also a constant. This implies that PV is directly proportional to T.
Step 3: Determine the Relationship
From the equation PV=kT, we can see that:
PV∝T
This means that if we plot PV on the y-axis and T on the x-axis, the graph will be a straight line passing through the origin (0,0).
Step 4: Identify the Characteristics of the Graph
1. Straight Line: The graph should be a straight line because of the direct proportionality.
2. No Y-Intercept: Since the graph passes through the origin, there will be no y-intercept; when T=0, PV must also be 0.
Step 5: Evaluate the Graph Options
When evaluating the provided graph options:
- Look for a straight line that passes through the origin (0,0).
- Discard any graphs that have a y-intercept or are not straight lines.
Conclusion
The correct graph will be the one that is a straight line through the origin, indicating that PV is directly proportional to T for an ideal gas with a fixed number of moles.
The ideal gas law is given by the equation:
PV=nRT
where:
- P = pressure,
- V = volume,
- n = number of moles (constant in this case),
- R = universal gas constant (constant),
- T = temperature.
Since n and R are constants, we can rewrite the equation as:
PV=kT
where k=nR is also a constant. This implies that PV is directly proportional to T.
From the equation PV=kT, we can see that:
PV∝T
This means that if we plot PV on the y-axis and T on the x-axis, the graph will be a straight line passing through the origin (0,0).
1. Straight Line: The graph should be a straight line because of the direct proportionality.
2. No Y-Intercept: Since the graph passes through the origin, there will be no y-intercept; when T=0, PV must also be 0.
When evaluating the provided graph options:
- Look for a straight line that passes through the origin (0,0).
- Discard any graphs that have a y-intercept or are not straight lines.
The correct graph will be the one that is a straight line through the origin, indicating that PV is directly proportional to T for an ideal gas with a fixed number of moles.
Topper's Solved these Questions
- JEE MAIN 2021BOOK - JEE MAINS PREVIOUS YEARCHAPTER - JEE MAIN 2021EXERCISE - SECTION-A
80 Videos
- JEE MAIN 2021BOOK - JEE MAINS PREVIOUS YEARCHAPTER - JEE MAIN 2021EXERCISE - SECTION-B
40 Videos
- JEE MAINBOOK - JEE MAINS PREVIOUS YEARCHAPTER - JEE MAINEXERCISE - All Questions
473 Videos
- JEE MAIN 2022BOOK - JEE MAINS PREVIOUS YEARCHAPTER - JEE MAIN 2022EXERCISE - Question
492 Videos
Similar Questions
Knowledge Check
For an adiabatic process graph between PV & V for a sample of ideal gas will be
A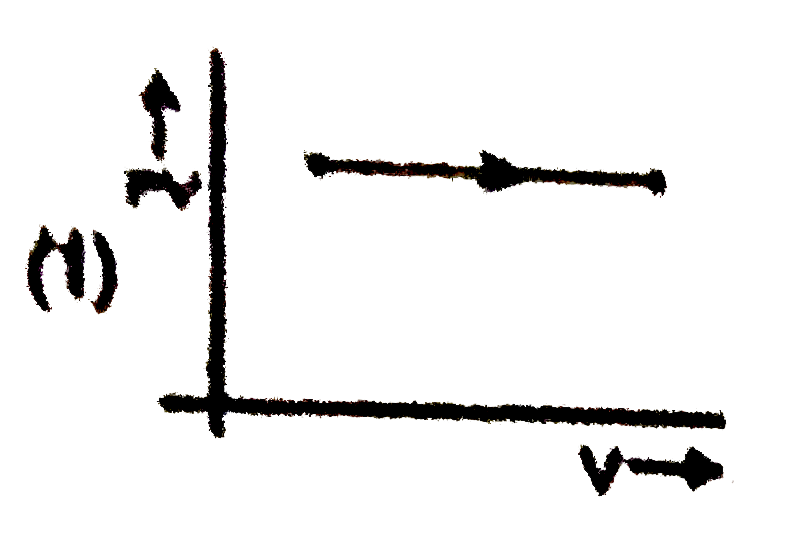 B
B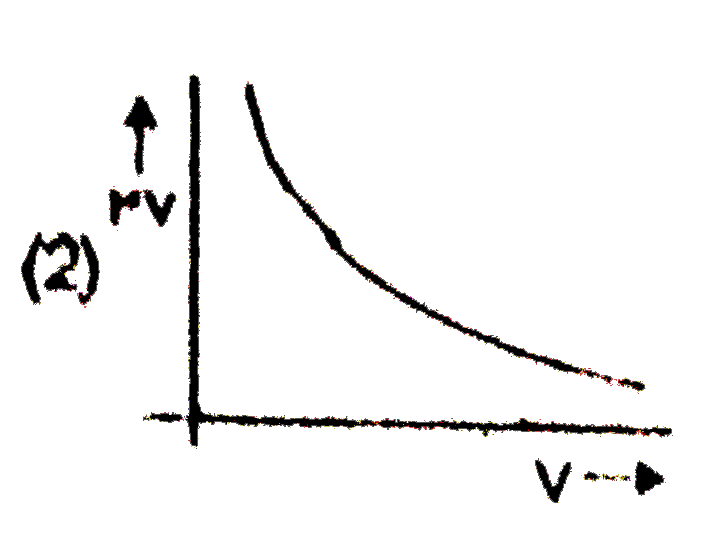 C
C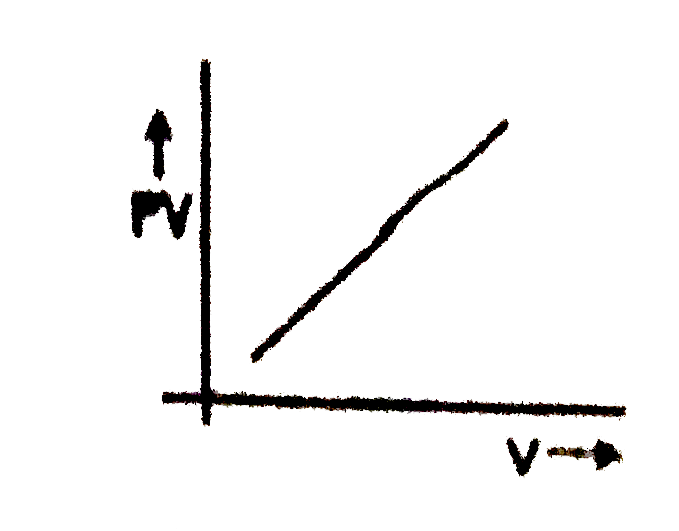 D
D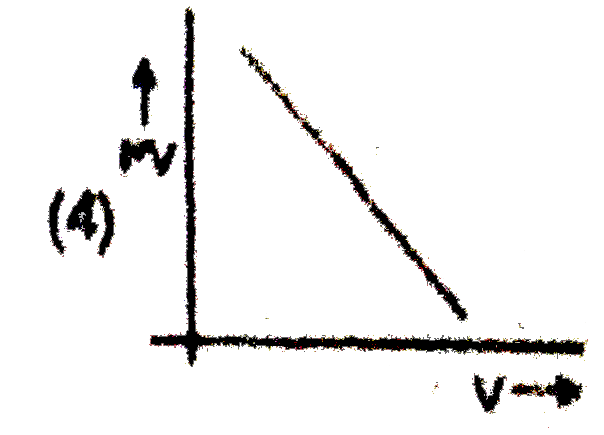
The relation between U,P and V for an ideal gas in an adiabatic process is given by U = 2 + 3 PV. The gas is
AmonoatomicBdiatomicCpolyatomicDeither monoatomic or diatomicGiven is the graph between PVT and P for 1 gm of oxygen gas at two different temperatures T1andT2 Fig. Given, density of oxygen =1.427kgm−3. The value of (PV)/(T) at the point A and the relation between T1andT2 are respectively :
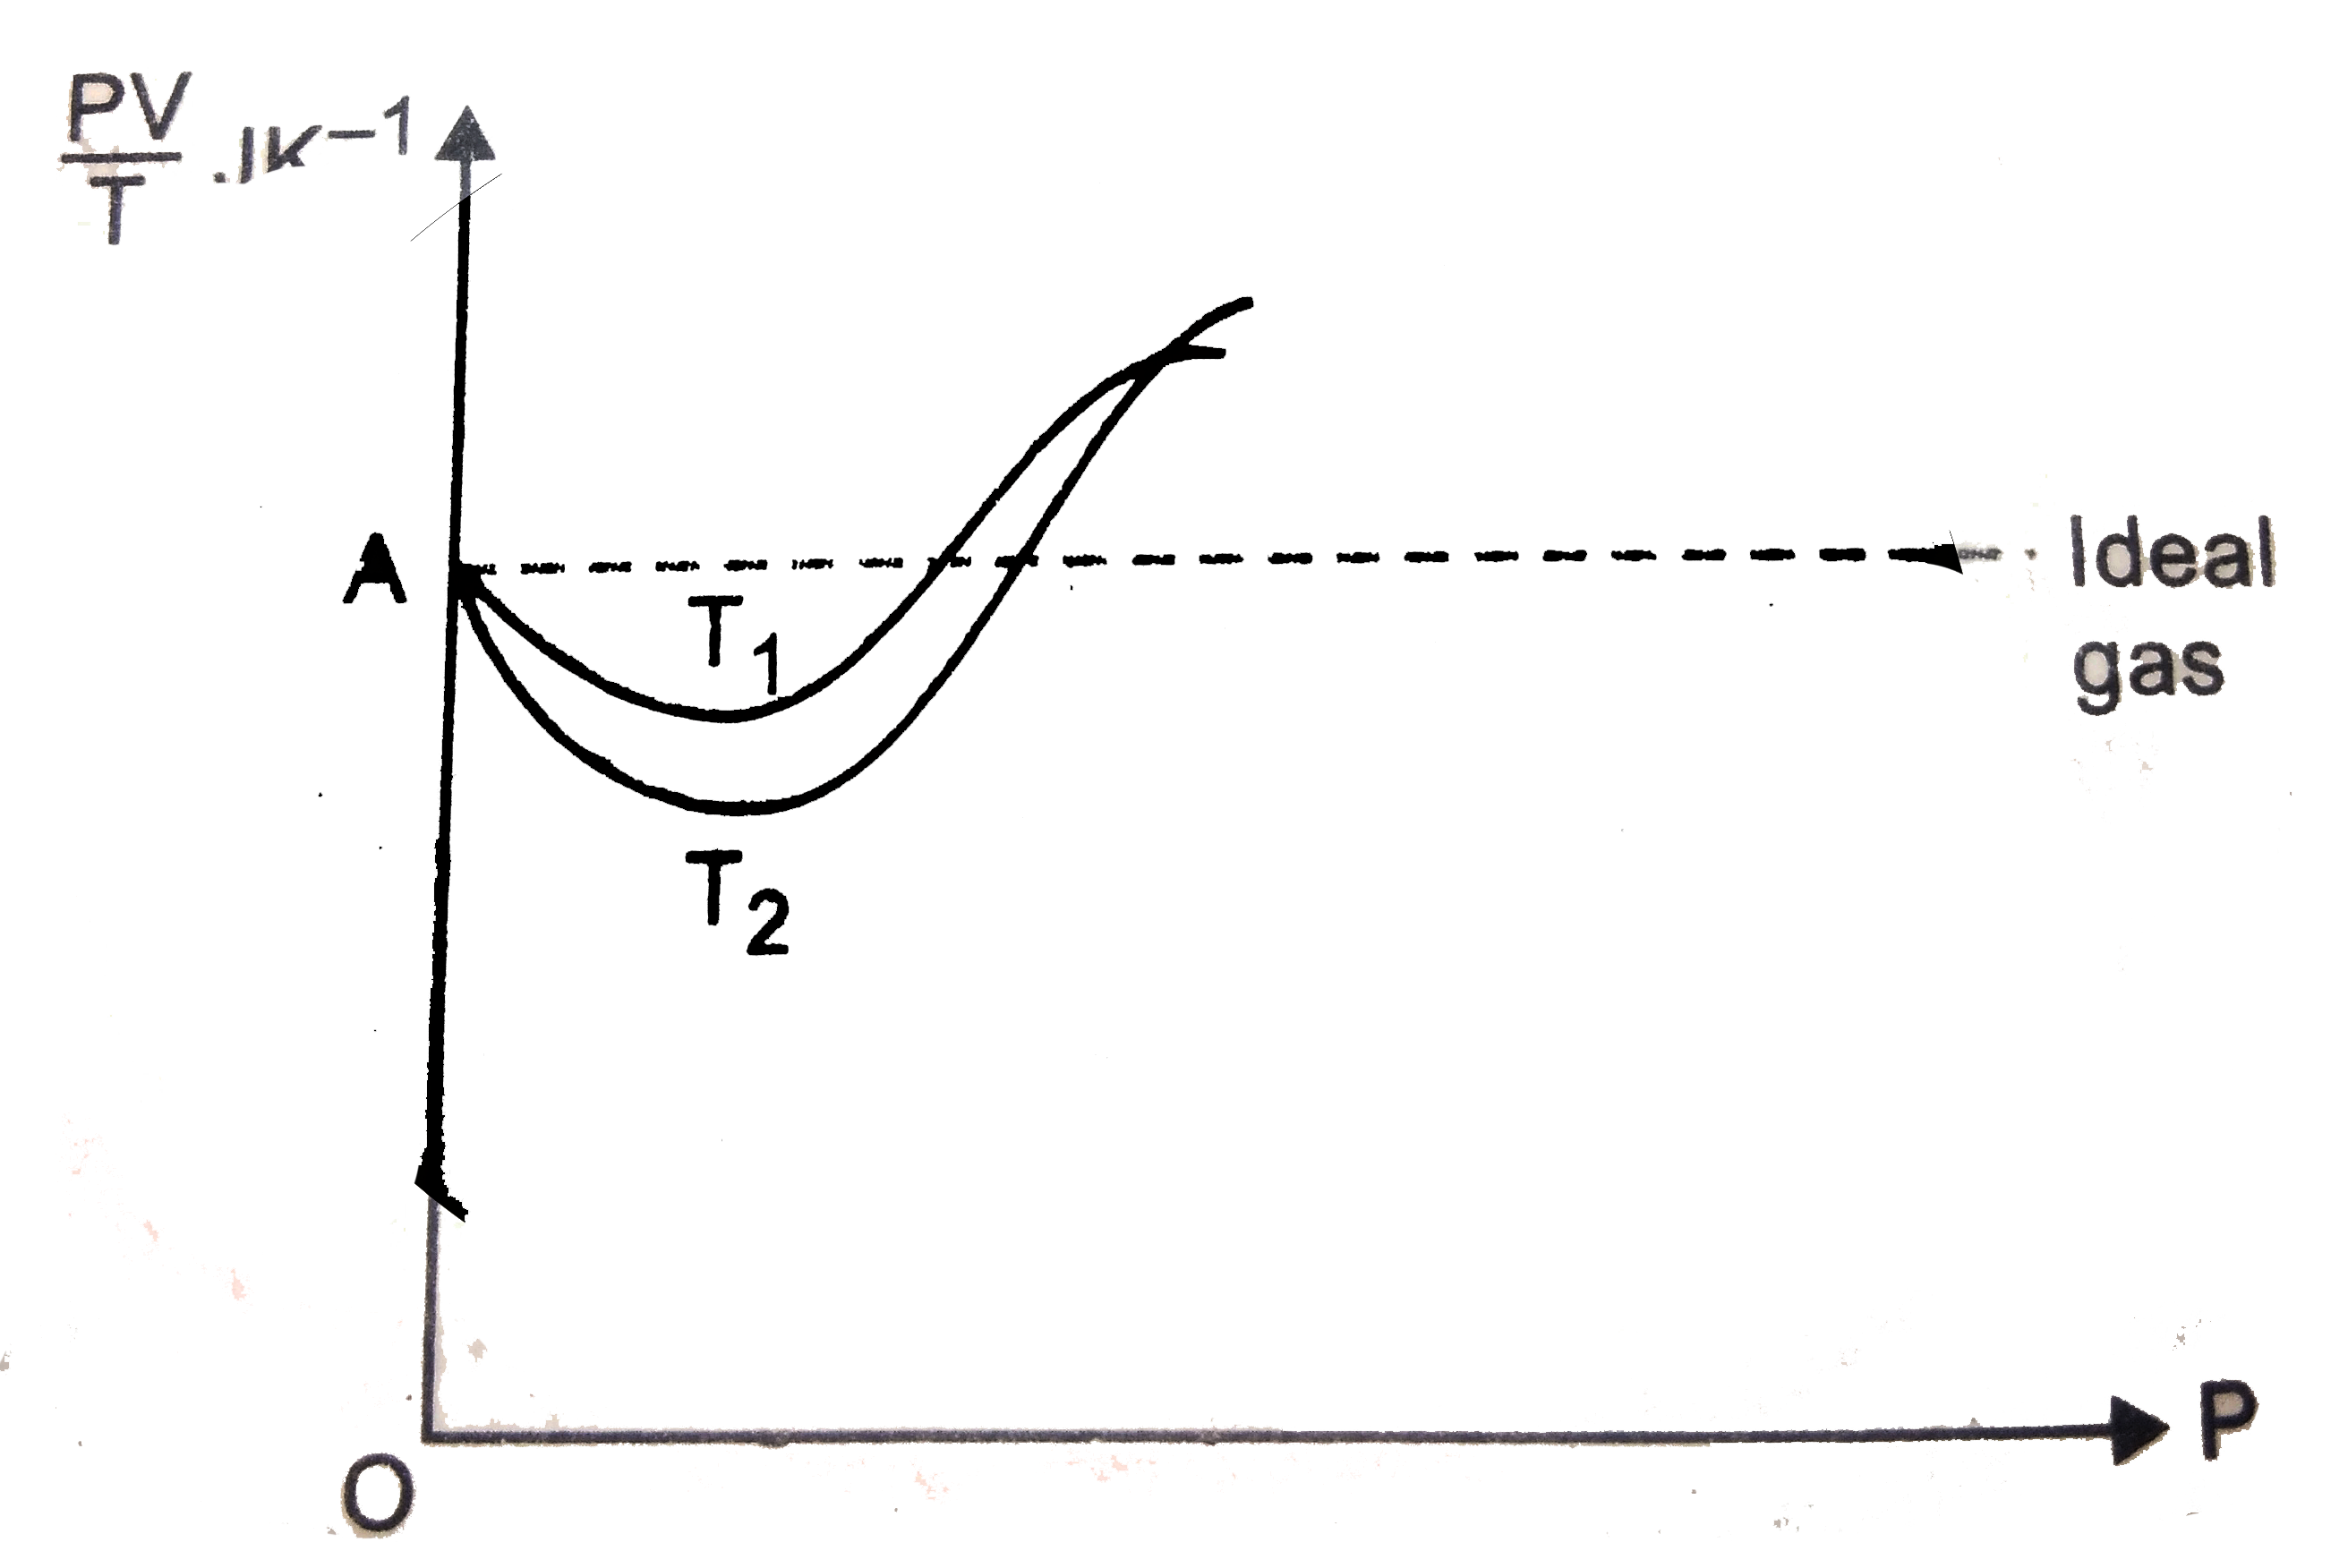 A0.256JK−1andT1<T(2)B8.314mol−1K−1andT1>T(2)C0.256JK−1andT1>T(2)D4.28JK−1andT1<T(2)
Pressure versus temperature graph of an ideal gas of equal number of moles of different volumes is plotted as shown in figure. Choose the correct alternatives.
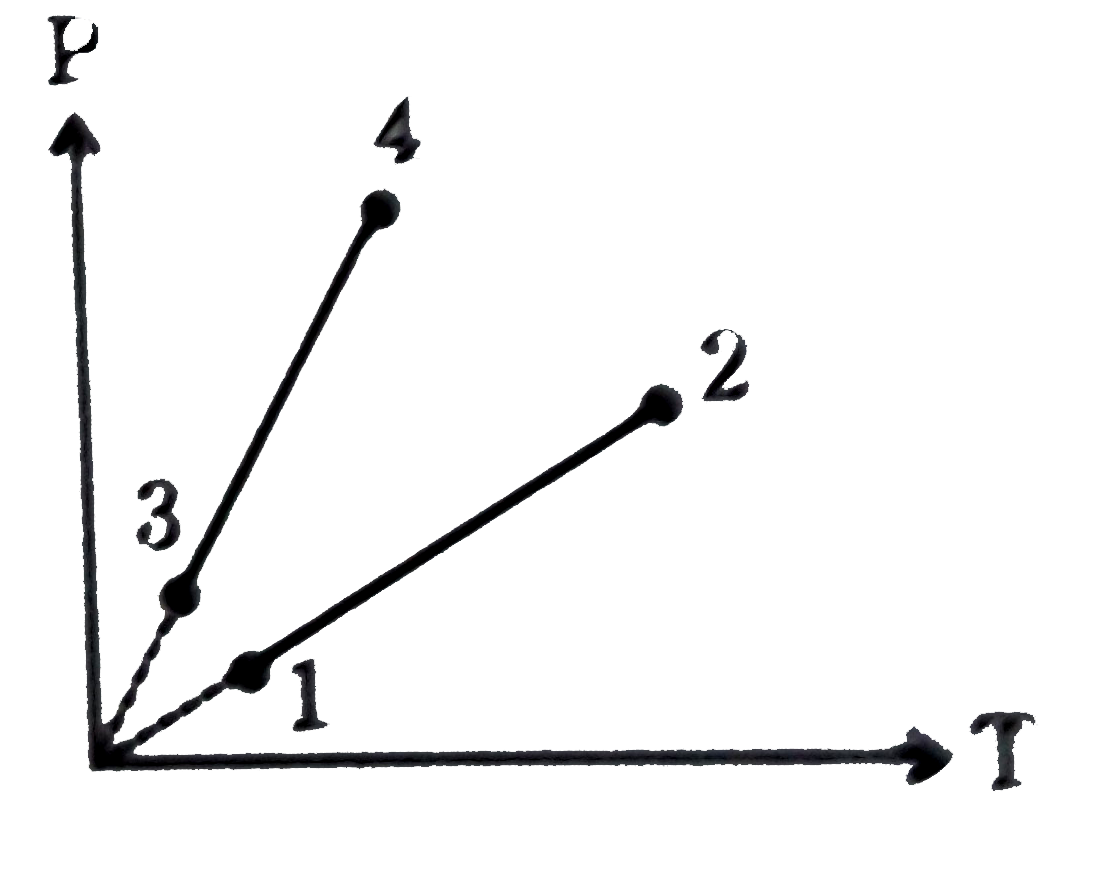
View SolutionPressure versus temperature graph of an ideal gas of equal number of moles of different volumes is plotted as shown in Fig. Choose the correct alternative.
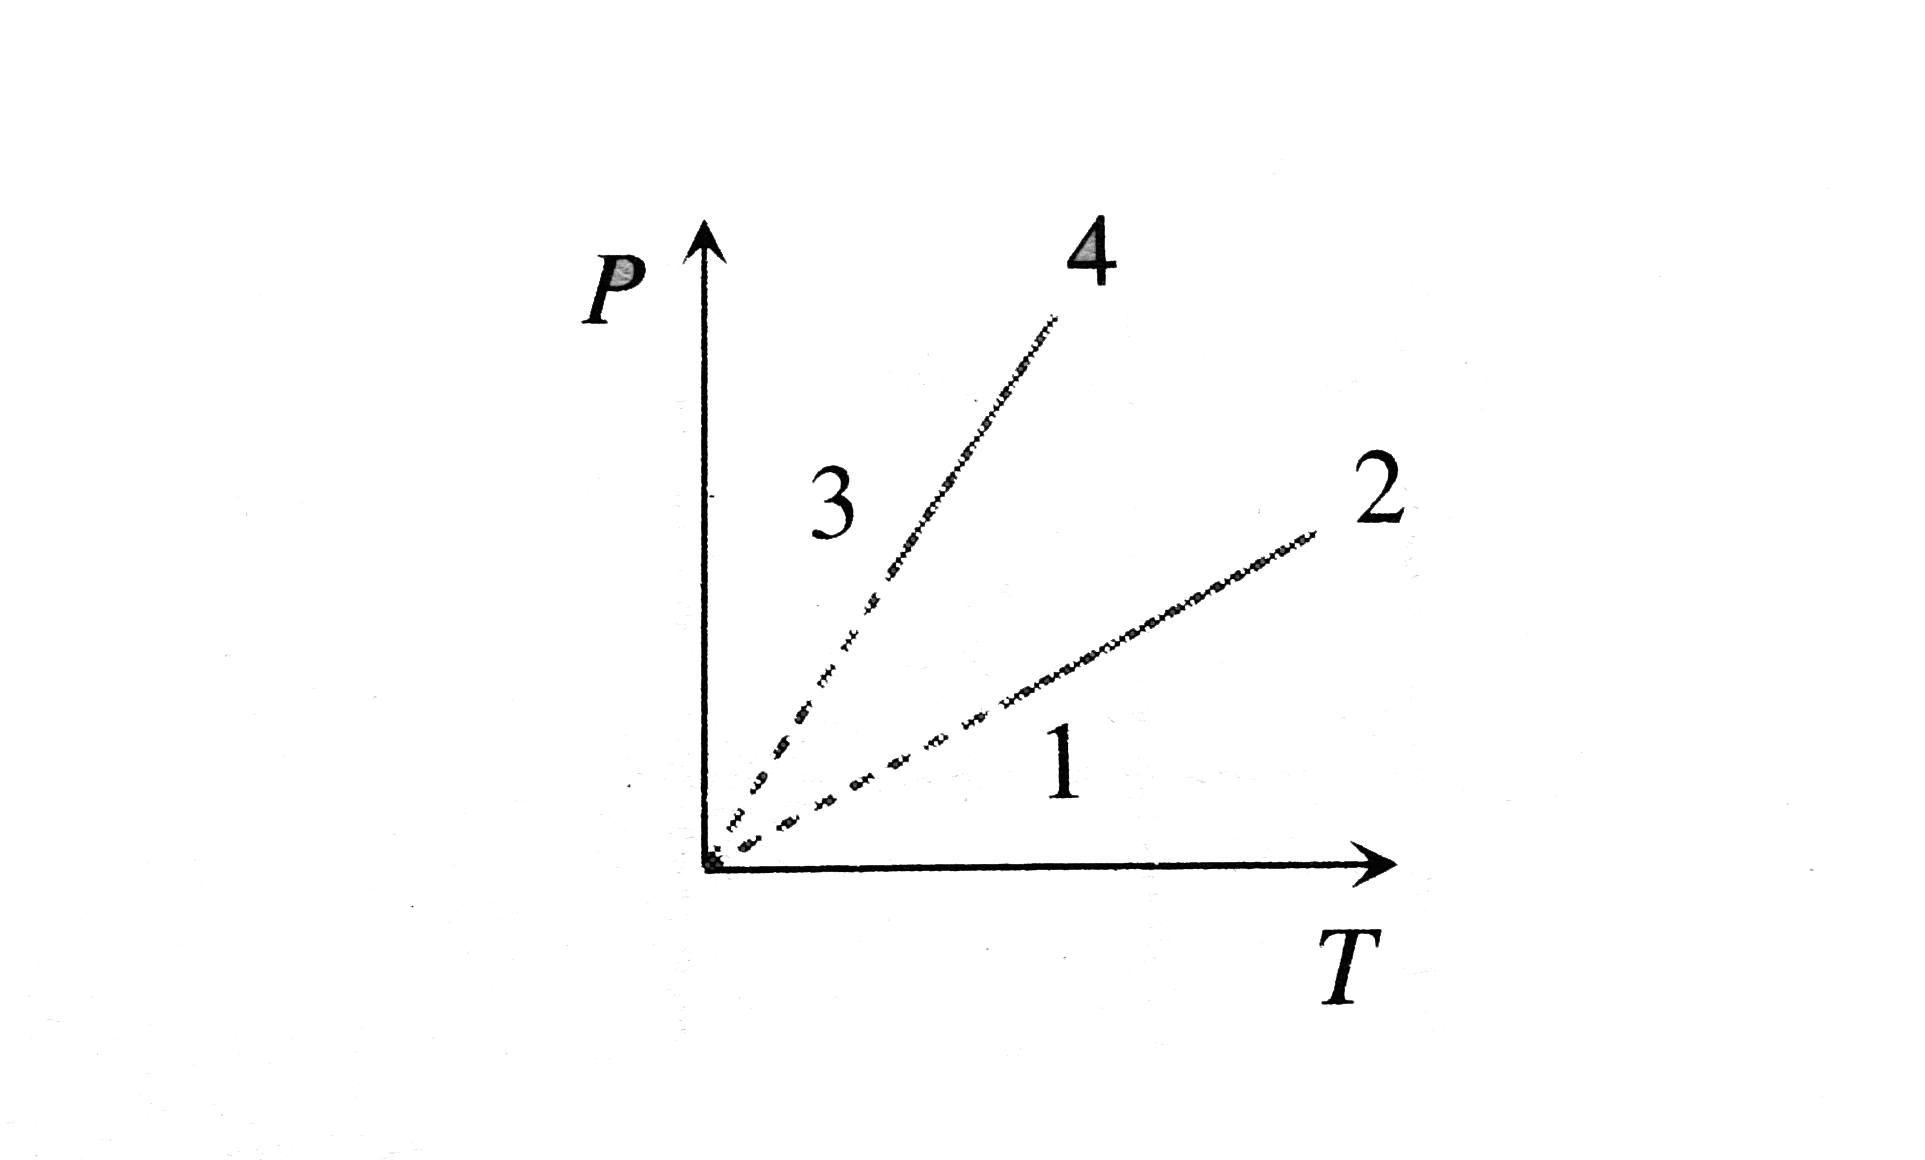
View SolutionIf a graph is plotted between log V and log T for 2 moles of a gas of constant pressure of 0.0821 atm, then which of the following statements are correct?
View SolutionThe volume vs. temperature graph of 1 mole of an ideal gas is given below
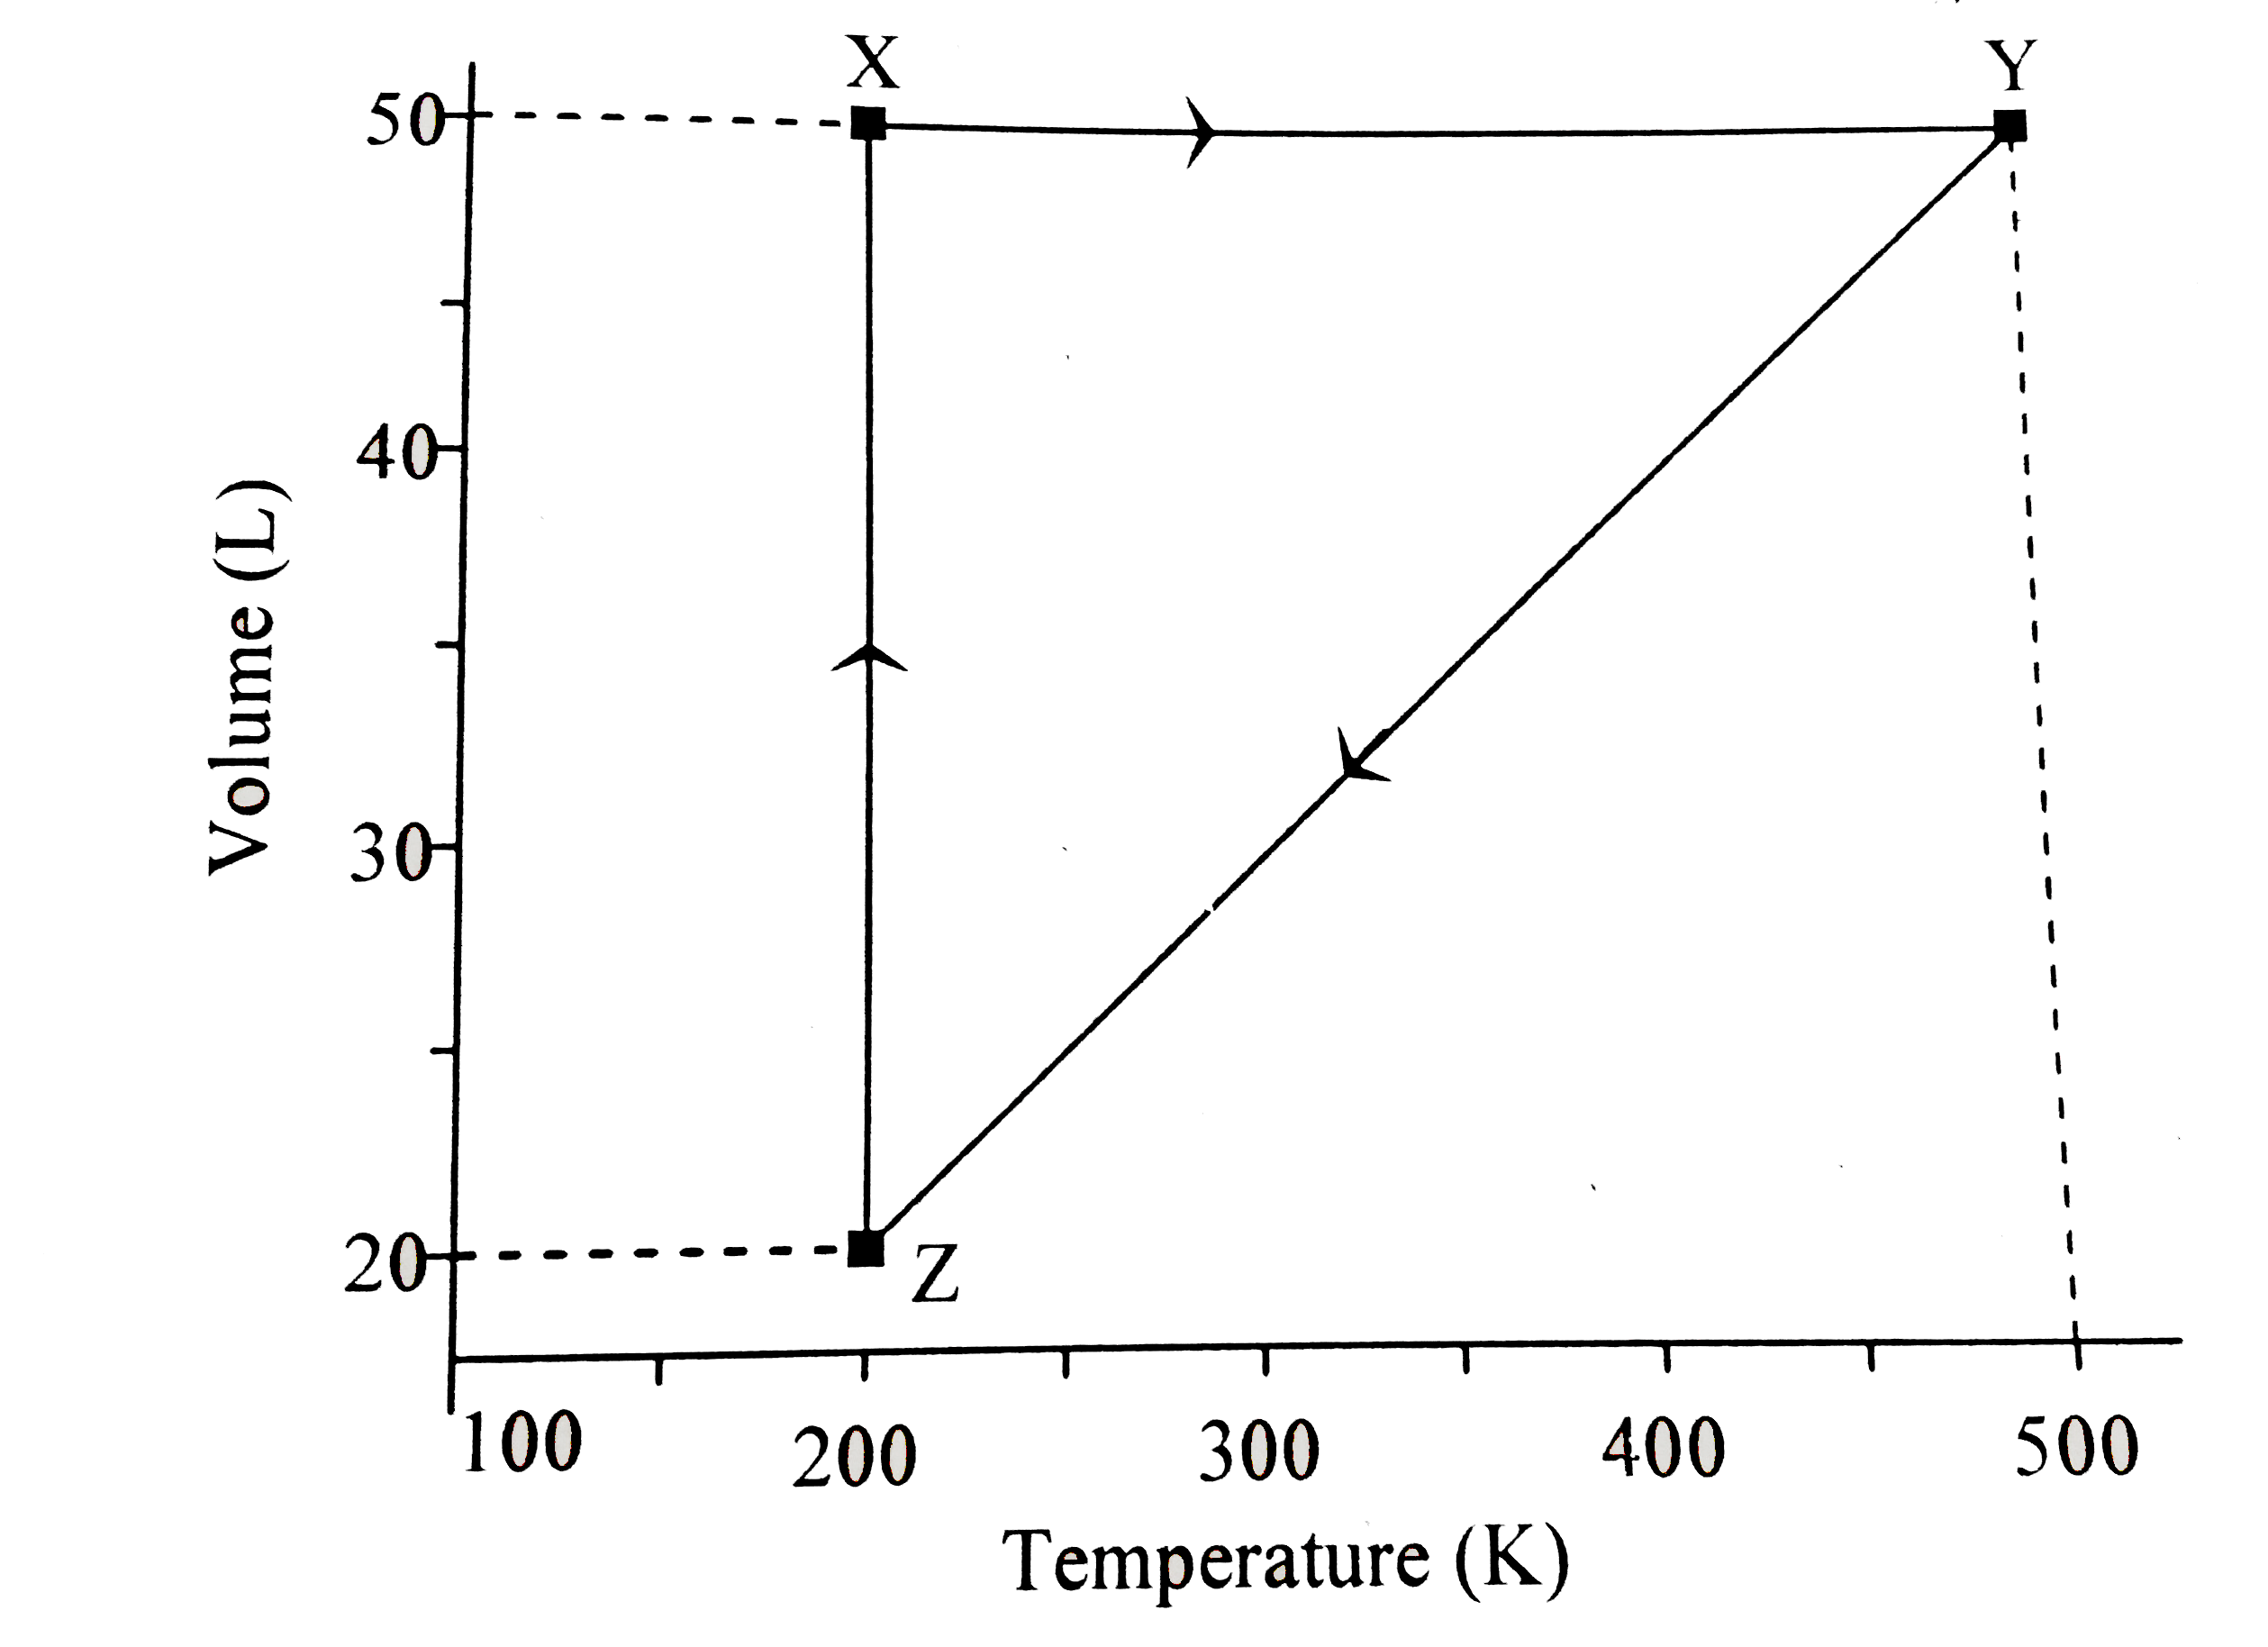
The pressure of the gas (in atm) at X, Y and Z, respectively, are
View SolutionOn the P−T graph of an ideal gas, choose the correct option(s):
View Solution

