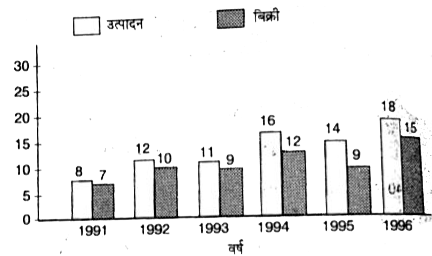
विभिन्न वर्षों में एक कम्पनी की उत्पादन तथा बिक्री मात्रा (लाख टन में)

वर्ष 1992 से 1993 में बिक्री में कितने प्रतिशत की कमी हुई ?
1
10
20
15
The correct Answer is:B
Step by step video, text & image solution for विभिन्न वर्षों में एक कम्पनी की उत्पादन तथा बिक्री मात्रा (लाख टन में) वर्ष 1992 से 1993 में बिक्री में कितने प्रतिशत की कमी हुई ? by Maths experts to help you in doubts & scoring excellent marks in Class 14 exams.
Updated on:21/07/2023Topper's Solved these Questions
- ग्राफBOOK - MAHESH MISHRACHAPTER - ग्राफEXERCISE - 29 C प्रतियोगी परीक्षाओं हेतु अभ्यास प्रश्नमाला
71 Videos
- ग्राफBOOK - MAHESH MISHRACHAPTER - ग्राफEXERCISE - 29 C प्रतियोगी परीक्षाओं हेतु अभ्यास प्रश्नमाला
71 Videos
- क्रमचय और संचयBOOK - MAHESH MISHRACHAPTER - क्रमचय और संचयEXERCISE - 26 C (प्रतियोगी परीक्षाओं हेतु अभ्यास प्रश्नमाला)
35 Videos
- घातांक एंव करणीBOOK - MAHESH MISHRACHAPTER - घातांक एंव करणीEXERCISE - 4 C (प्रतियोगी परीक्षाओं हेतु अभ्यास प्रश्नमाला)
90 Videos
Similar Questions
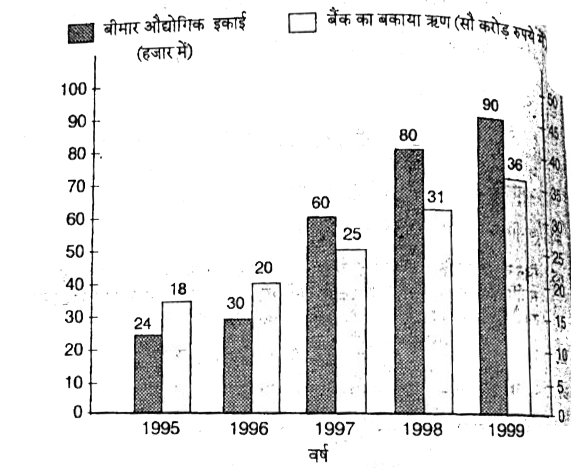
विभिन्न वर्षों में बीमार औद्योगिक इकाईयों की संख्या (×1000) तथा बैंक का बकाया ऋण (×100) करोड़ रुपये में

किस वर्ष बैंक का ऋण प्रति बीमार इकाई अधिकतम था ?
View Solutionविभिन्न वर्षों में बीमार औद्योगिक इकाईयों की संख्या (×1000) तथा बैंक का बकाया ऋण (×100) करोड़ रुपये में

किस वर्ष बैंक का ऋण प्रति बीमार इकाई अधिकतम था ?
View Solution8 छात्र गणित विषय के, 7 छात्र विज्ञान के तथा 4 छात्र अंग्रेजी विषय के है। कितने तरीके से इन छात्रों को स्कॉलरशिप दिए जा सकते हैं यदि यह सर्वोच्च स्थान प्राप्त करनेवालों को ही दिया जाता है ?
View Solution81√0.04=?
View SolutionDetermine the point of symmetry of a regular hexagon.
View SolutionDtermine the images of the following figure about the given line :
View SolutionMatch the following Column A to Column B

View SolutionMatch the following Column A to Column B

View SolutionMatch the following Column A to Column B

View SolutionThe inequation represented by the graph given below is :
View SolutionThe inequation that best describes the graph given below is _________
View SolutionThe inequation that best describes the following graph is _________
View Solutionविद्यालय की कार्यानुभव-प्रयोगशाला में बनी मोमबत्तियाँ तथा अन्य उपयोगी वस्तुओं की बिक्री हेतु लगभग 25 शब्दों में एक विज्ञापन लिखिए।
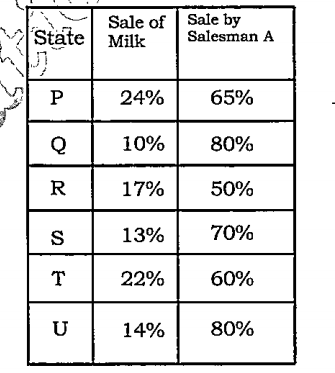
View SolutionThe table below shows the sales of milk in six different states as a percentage of total sales. In each state only two milkmen A and B sell the milk. The table below shows the sales of salesman A as percentage of total sale of milk in each state. The total sales of milk is 200000 litres.
नीचे दी गईं तालिका में छः विभिन्न राज्यों में दूध की कुल बिक्री को प्रतिशत में दर्शाया गया है। प्रत्येक राज्य में केवल दो दूध विक्रेता A तथा B दूध बेचते है। नीचे दी गई तालिका प्रत्येक राज्य में दूध की कुल बिक्री के प्रतिशत में विक्रेता A दवारा की गई बिक्री को दर्शाती है। दूध की कुल बिक्री 200000 लीटर है। What will be difference (in litres) in the sale of milk in state T by
salesmen B and the total sale of milk in state R and S together?
राज्य T में विक्रेता B द्वारा की गई दूध की बिक्री तथा राज्य R तथा S में मिलाकर हुई दूध की कूल बिक्री में क्या अंतर (लीटर में) है?
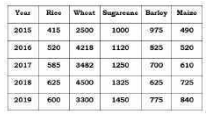
View SolutionIn the following table, the production of various crops (in tonnes) is given from 2015 to 2019. Study the table and answer the question that follows:
दी गयी तालिका में, 2015 से 2019 तक विभिन्न फसलों का उत्पादन (टन में ) दिया गया है | इस तालिका का अध्ययन करें तथा फिर पूछे गए प्रश्न का उत्तर दीजिए | The percentage growth of maize in the year 2019 over the year 2015 is: (correct to one decimal place)
वर्ष 2019 में वर्ष 2015 की तुलना में मक्का के उत्पादन में कितने प्रतिशत की वृद्धि हुई है ? ( दशमलव के एक स्थान तक )
View SolutionThe following graph shows the sales of cars (in thousands) in four cities in 4 years. Study the graph and answer the questions.
निम्नलिखित आरेख 4 वर्षों में चार शहरों में कारों की बिक्री (हज़ार में) को दर्शाता है। इस आरेख का अध्ययन कीजिए तथा प्रश्नों के उत्तर दीजिए। Which city has the highest percentage of sales, and in which year?
किस शहर की बिक्री का प्रतिशत सबसे अधिक है तथा किस वर्ष में?
View Solution
