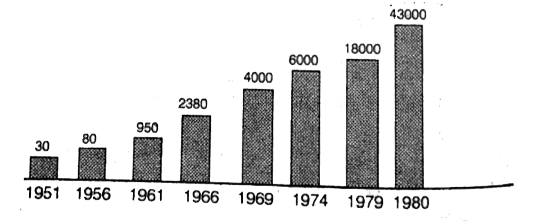
सरकारी क्षेत्र के प्रतिष्ठानों (PSUs) में निवेश में वृद्धि (करोड़ रुपए में )

वर्ष 1974 में PSUs में निवेश राशि , 1969 में निवेश राशि से कितना प्रतिशत अधिक था ?
200
100
150
50
The correct Answer is:D
Step by step video, text & image solution for सरकारी क्षेत्र के प्रतिष्ठानों (PSUs) में निवेश में वृद्धि (करोड़ रुपए में ) वर्ष 1974 में PSUs में निवेश राशि , 1969 में निवेश राशि से कितना प्रतिशत अधिक था ? by Maths experts to help you in doubts & scoring excellent marks in Class 14 exams.
Updated on:21/07/2023Topper's Solved these Questions
- ग्राफBOOK - MAHESH MISHRACHAPTER - ग्राफEXERCISE - 29 C प्रतियोगी परीक्षाओं हेतु अभ्यास प्रश्नमाला
71 Videos
- ग्राफBOOK - MAHESH MISHRACHAPTER - ग्राफEXERCISE - 29 C प्रतियोगी परीक्षाओं हेतु अभ्यास प्रश्नमाला
71 Videos
- क्रमचय और संचयBOOK - MAHESH MISHRACHAPTER - क्रमचय और संचयEXERCISE - 26 C (प्रतियोगी परीक्षाओं हेतु अभ्यास प्रश्नमाला)
35 Videos
- घातांक एंव करणीBOOK - MAHESH MISHRACHAPTER - घातांक एंव करणीEXERCISE - 4 C (प्रतियोगी परीक्षाओं हेतु अभ्यास प्रश्नमाला)
90 Videos
Similar Questions
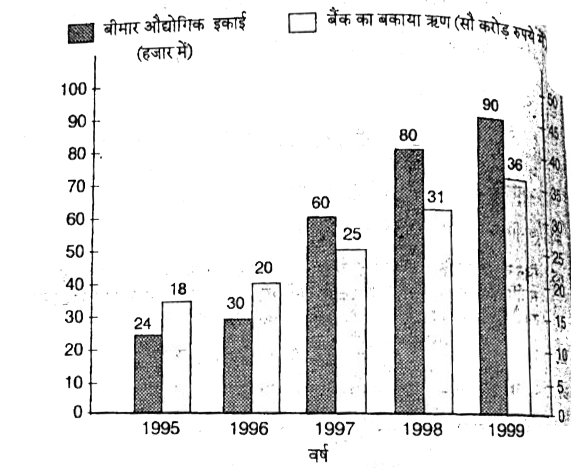
विभिन्न वर्षों में बीमार औद्योगिक इकाईयों की संख्या (×1000) तथा बैंक का बकाया ऋण (×100) करोड़ रुपये में

किस वर्ष बैंक का ऋण प्रति बीमार इकाई अधिकतम था ?
View Solutionविभिन्न वर्षों में बीमार औद्योगिक इकाईयों की संख्या (×1000) तथा बैंक का बकाया ऋण (×100) करोड़ रुपये में

किस वर्ष बैंक का ऋण प्रति बीमार इकाई अधिकतम था ?
View Solution8 छात्र गणित विषय के, 7 छात्र विज्ञान के तथा 4 छात्र अंग्रेजी विषय के है। कितने तरीके से इन छात्रों को स्कॉलरशिप दिए जा सकते हैं यदि यह सर्वोच्च स्थान प्राप्त करनेवालों को ही दिया जाता है ?
View Solution81√0.04=?
View SolutionDetermine the point of symmetry of a regular hexagon.
View SolutionMatch the following Column A to Column B

View SolutionMatch the following Column A to Column B

View SolutionMatch the following Column A to Column B

View SolutionThe inequation represented by the graph given below is :
View SolutionThe inequation that best describes the graph given below is _________
View SolutionThe inequation that best describes the following graph is _________
View Solutionचिकित्सा के क्षेत्र में जैवप्रौद्योगिकी
View Solution(##ARH_HIN_ASP_JEE_MN_CHE_XII_C11_E02_159_Q01.png" width="80%">
उपरोक्त अभिक्रिया में सम्मिलित इलेक्ट्रोनस्नेहि है
View SolutionA and B invest in the ratio 3:5. After 6 months, C joins the business, investing an amount equal to B's. At the end of the year what will be the ratio of their profits? A और B 3:5 के अनुपात में निवेश करते है। 6 महीने के बाद, C व्यवसाय में शामिल हो जाता है तथा B के बराबर राशि का निवेश करता है। वर्ष के अंत में उनके लाभ का अनुपात क्या होगा?
View SolutionThe ratio of investment by A to that by B is a business is 14:15 and the ratio of their respective profits at the end of a year is 2:5. If A invested the money for 3 months, then for how much time (in months) B invested his money?
एक व्यवसाय में A और B के द्वारा किये गए निवेश का अनुपात 14:15 है तथा वर्ष के अंत में उनके लाभों का अनुपात 2 : 5 है | यदि A ने 3 माह के लिए राशि निवेश की थी, तो B द्वारा निवेश की गयी राशि की अवधि (महीने में ) कितनी थी ?
View SolutionPankaj invests an amount after dividing in three different schemes A, B and C giving the interest at the rate of 10%, 12% and 15% respectively and the accumulated interest for one year is Rs. 3200. The amounts invested in A, B and C are in the ratio of 8 : 5 : 12. What amount did he invest in the scheme B ?
पंकज किसी राशि को विभाजित कर तीन अलग-अलग योजनाओं A, B और C में क्रमशः 10%, 12% और 15% प्रति वर्ष ब्याज दर पर निवेश करता है, और एक वर्ष में संचित कुल ब्याज 3200 रूपए है | योजना A, B और C में निवेश की गयी राशि 8 : 5 : 12 के अनुपात में है | योजना B में वह कितनी राशि का निवेश करता है ?
View Solution
